August 21, 2026
When Currency Mechanics Override Yield Math: Understanding Gold's 2026 Advance
Global commodity markets operate according to a hierarchy of forces, and understanding which variable sits at the top of that hierarchy in any given period is what separates reactive investors from informed ones. In mid-2026, that dominant variable is not interest rate policy, not geopolitical risk, and not industrial supply shortages. It is the purchasing power of the world's reserve currency. When gold rises as dollar weakness offsets bond yields, the arithmetic of gold ownership changes for billions of potential buyers operating outside the United States, and that mathematical reality is currently driving bullion toward price levels that would have seemed extreme just a few years ago.
When big ASX news breaks, our subscribers know first
The Structural Relationship Between Currency Depreciation and Gold Pricing
How Dollar Weakness Mechanically Lowers the Global Cost of Gold
Gold's global denomination in U.S. dollars creates a pricing dynamic that most retail investors overlook. When the dollar falls against a basket of major currencies, the spot price of gold in those local currencies declines even if the dollar-denominated price holds flat or rises modestly. This means a European buyer using euros, an Asian buyer using yen, or an emerging-market participant using local currency faces a lower effective acquisition cost simply because the exchange rate moved in their favour.
This mechanism is not theoretical. It operates in real time, and it is one reason why gold demand tends to broaden geographically during periods of sustained dollar weakness. The effective demand pool expands without any change to the physical supply side of the equation, creating upward price pressure through demand aggregation across multiple currency zones simultaneously. Understanding gold and bond dynamics helps clarify why these forces interact in such a powerful and sometimes counterintuitive way.
Why Gold Is Uniquely Sensitive to U.S. Dollar Index Movements
Unlike oil, copper, or most agricultural commodities, gold carries no industrial consumption floor that provides a price backstop independent of financial conditions. Its value is almost entirely a function of perceived monetary credibility and relative purchasing power. This makes it more acutely sensitive to dollar index movements than almost any other raw material. When the DXY slides, gold does not merely benefit indirectly through investor rotation; it benefits directly through the cross-currency price adjustment mechanism described above.
The Inverse Correlation: Historical Evidence and Modern Relevance
Decades of price data consistently show a negative correlation between the U.S. Dollar Index and gold's spot price. This relationship is not perfectly reliable at every time interval, but over multi-week and multi-month horizons it has proven robust across multiple market cycles. For instance, the 2007 to 2011 period saw gold surge from under $700 per ounce to above $1,900 as the dollar weakened substantially following the global financial crisis. The same dynamic reappeared during 2020 dollar weakness and is now reasserting itself in the summer of 2026.
The inverse relationship between gold and the dollar is not incidental. It reflects the deeper reality that gold functions as an alternative monetary asset, and its perceived value rises precisely when confidence in the dominant fiat currency system diminishes.
What Is the Dollar Index Telling Markets Right Now?
Breaking Down the DXY's 0.9% Weekly Decline to a Three-Month Low of 98.76
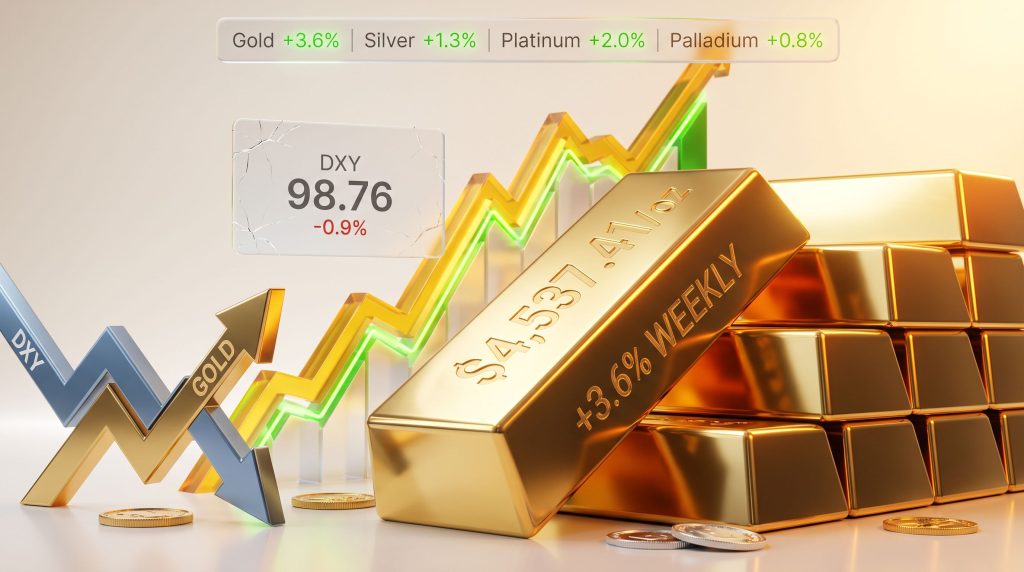
As of August 21, 2026, the U.S. Dollar Index printed a three-month low of 98.76, representing a 0.9% weekly decline. That single data point carries significant implications. A DXY level below 99 signals broad-based dollar weakness against the euro, yen, pound, Canadian dollar, Swedish krona, and Swiss franc. For overseas gold buyers, this translated into a tangible cost reduction for dollar-priced bullion, directly supporting the week's 3.6% advance in spot gold to $4,537.41 per ounce.
Key Data Summary: Precious Metals and Rate Markets, August 21, 2026
| Indicator | Level | Weekly / Daily Change |
|---|---|---|
| U.S. Dollar Index (DXY) | 98.76 | -0.9% (weekly) |
| Spot Gold | $4,537.41/oz | +0.4% (daily), +3.6% (weekly) |
| 30-Year Treasury Yield | 5.2508% | +1.4 bps |
| 10-Year Treasury Yield | 4.7041% | +4.5 bps |
| Silver | $68.93/oz | +1.3% (weekly) |
| Platinum | $1,865.29/oz | +2.0% (weekly) |
| Palladium | $1,344.44/oz | +0.8% (weekly) |
Treasury Debt Management as a Currency Depressant: The Buyback Mechanism Explained
The proximate cause of the dollar's latest leg lower was the U.S. Treasury's decision to double long-dated bond buyback operations to at least $4 billion per operation, with Treasury Secretary Scott Bessent indicating that further expansion remains possible. Buyback programmes inject fresh liquidity into the financial system by repurchasing existing government debt, effectively increasing the dollar money supply at the margin. That incremental expansion in dollar supply contributes to currency depreciation, which in turn lowers the exchange-rate-adjusted cost of gold for non-U.S. buyers.
Why a $40 Trillion Debt Load Structurally Pressures the Dollar Even When Yields Rise
The paradox of the current environment is that U.S. Treasury yields are rising alongside a falling dollar, a configuration that historically would attract foreign capital and support the greenback. The reason this conventional relationship is breaking down is the sheer scale of U.S. sovereign debt, which now exceeds $40 trillion. At that magnitude, rising yields do not simply signal attractive returns; they also signal escalating debt service costs, deteriorating fiscal credibility, and increasing risk that the Treasury's borrowing trajectory is unsustainable.
International investors are beginning to price both sides of that equation simultaneously, limiting the dollar's ability to benefit from higher yields in the conventional manner. Furthermore, central banks influencing gold through reserve diversification strategies are reinforcing this structural pressure on the greenback.
How Do Bond Yields Affect Gold Prices, and Why Aren't They Winning Right Now?
The Opportunity Cost Framework: Why Non-Yielding Assets Compete With Bonds
Gold generates no cash flow. It pays no dividend, coupon, or interest. Every dollar committed to bullion is a dollar that could theoretically earn the prevailing risk-free rate through Treasury ownership. When that risk-free rate is elevated, the implicit cost of holding gold rises, and the relative attractiveness of yield-bearing instruments increases. This is the foundational mechanism behind the conventional wisdom that rising bond yields are bearish for gold.
When Yields Rise But Gold Still Advances: Understanding the Tipping Point
The 30-year Treasury yield rose 1.4 basis points to 5.2508% during the week ending August 21, 2026, while the 10-year added 4.5 basis points to 4.7041%. Under normal conditions, those moves would create meaningful headwinds for bullion. Yet gold gained 3.6% for the week. The explanation lies in the relative magnitude of competing forces. Dollar depreciation of 0.9% against a broad currency basket created cost reductions for overseas buyers that more than offset the opportunity cost penalty imposed by modestly higher yields.
Featured Insight: Gold typically retreats when bond yields climb because interest-bearing instruments become comparatively more attractive. However, when dollar depreciation is substantial enough, as seen with the DXY printing a three-month low of 98.76, the reduction in foreign-currency acquisition costs can outweigh the opportunity cost drag, permitting bullion to advance even while long-bond yields hold above 5.25%.
The Fiscal Dominance Thesis: Why Sovereign Debt Concerns Can Neutralise Yield Pressure
Goldman Sachs strategist Vitali Meschoulam has articulated a view that Treasury buyback programmes lose their capacity to suppress long-end yields once investor anxiety about sovereign financing capacity becomes the primary force shaping demand for government debt. In that environment, fiscal credibility rather than operational mechanics determines where long-term borrowing costs settle. This insight matters enormously for gold investors because it implies that the yield headwind for bullion could remain structurally muted even as nominal rates stay elevated, provided fiscal concerns continue to dominate market psychology.
Step-by-Step: How the Dollar-Yield Tug-of-War Resolves in Gold's Favour
- Dollar weakens through Treasury buyback liquidity injection and fiscal credibility concerns, reducing the local-currency cost of gold for overseas buyers and expanding effective demand.
- Yields rise modestly on the back of persistent inflation uncertainty and bond market scepticism about Treasury's ability to contain long-term borrowing costs, creating a mild opportunity cost headwind for gold holders.
- Net effect is assessed by market participants in real time. When currency depreciation exerts greater downward pressure on effective gold prices than yield increases impose as an opportunity cost, bullion advances.
- Fiscal backdrop amplifies and sustains the dollar weakness channel, because $40 trillion in sovereign debt makes each incremental yield rise a double-edged signal that simultaneously attracts yield seekers and repels dollar bulls.
What Role Does Federal Reserve Policy Play in Gold's Current Trajectory?
Decoding Fed Probability Pricing: What a 63/37 Hold-to-Hike Split Means for Bullion
As of August 21, 2026, futures markets assigned a 63% probability to the Federal Reserve holding rates unchanged at its September meeting, with the remaining 37% pricing in a 25 basis point hike. This probability split has direct implications for gold's near-term trajectory. A hold preserves the current interest rate environment, avoids compounding the opportunity cost penalty for bullion, and allows dollar weakness to remain the dominant pricing force. A hike would do the opposite on both dimensions simultaneously.
Two Federal Reserve officials have already raised concerns that Treasury debt-management changes could influence long-term yields and complicate the broader policy calculus, adding an additional layer of uncertainty to September's outcome that markets are still processing.
Why a September Rate Hold Would Extend Gold's Three-Week Winning Streak
Gold's three-week advance heading into the August 21 session has been built on a combination of dollar softness and rate stability. A September hold would validate that macro configuration, removing one of the two primary downside risks to the current bullion trend. It would also signal that the Fed sees insufficient inflationary pressure to tighten further, which carries its own set of gold-positive implications regarding real interest rates and monetary credibility. Consequently, gold safe-haven demand would likely continue to strengthen under such conditions.
Labour Market Data as a Fed Swing Factor
The September decision will not be made in a data vacuum. Several labour market indicators are feeding directly into the Fed's reaction function:
- Jobless claims: Trending lower, indicating continued labour market resilience and keeping a rate hike on the table.
- July employment report: Came in below consensus expectations, injecting ambiguity into the inflation and wage-growth outlook.
- Inflation trajectory: Remains the decisive variable, with the Fed needing evidence of either sustained disinflation or re-acceleration to commit definitively to either direction.
Treasury Buybacks: Fiscal Tool or False Floor for Long-Term Yields?
What the U.S. Treasury's Decision to Double Long-Dated Buybacks Actually Does
Treasury buyback operations work by repurchasing previously issued government bonds from the market, injecting cash and reducing the outstanding float of specific maturities. In theory, concentrating buyback activity at the long end of the curve should reduce supply pressure on long-dated bonds, pushing their prices higher and yields lower. The mechanism is conceptually straightforward, but its effectiveness depends entirely on what is driving yield levels in the first place.
Why Doubling Operations to $4 Billion Has Failed to Contain the 30-Year Yield
Despite the Treasury doubling its long-dated buyback operations to at least $4 billion per operation, the 30-year yield rose 1.4 basis points to 5.2508% during the same week. The market's failure to respond to the buyback expansion in the expected direction is itself informative. It suggests that the forces pushing long-term yields higher, principally fiscal sustainability concerns and inflation uncertainty, are currently more powerful than the technical supply-reduction effect of the buyback programme. Indeed, gold rises as dollar weakness offsets bond yields in precisely these kinds of environments, where conventional policy tools lose their traction.
Comparing Buyback Outcomes: Policy Intention vs. Market Reality
| Policy Action | Expected Yield Impact | Actual Market Outcome |
|---|---|---|
| Treasury doubles buyback size to at least $4B | Downward pressure on long-end yields | 30-year yield rose 1.4 bps to 5.2508% |
| Further buyback expansion signalled by Bessent | Additional containment of long-term borrowing costs | Market scepticism persists amid $40 trillion debt load |
The next major ASX story will hit our subscribers first
Is Retail Gold Demand Structurally Shifting? The 1,200-Tonne Physical Market Story
Retail Physical Gold Now Represents Roughly 25% of Global Annual Demand
One of the most underappreciated dimensions of the 2026 gold market is the structural transformation occurring at the retail end of the demand curve. Physical bar and coin purchases now account for approximately 25% of total global annual gold demand, representing a meaningful and growing segment of overall consumption. This figure elevates retail participation from a marginal curiosity to a structurally significant demand driver that institutional analysis sometimes underweights.
In addition, the expansion of central bank gold reserves has reinforced the long-term structural case for bullion, providing an institutional demand floor beneath the retail layer.
Why 2025 Volumes Reached a 12-Year High Despite Record-Level Spot Prices
In 2025, retail bar and coin purchases reached approximately 1,200 tonnes, the highest volume recorded in twelve years. This occurred against a backdrop of record spot prices, which would typically suppress consumer demand through the standard price-sensitivity channel. The fact that volumes expanded rather than contracted at elevated price levels carries an important signal: retail buyers in 2025 were not purchasing gold as a discretionary commodity. They were purchasing it as a trust asset and an inflation hedge, motivations that operate largely independently of spot price levels.
This behaviour pattern challenges the conventional demand-destruction assumption at high price levels and suggests that gold's retail buyer base has undergone a psychological shift, treating bullion less like a consumer product and more like an insurance policy priced in currency units.
The Trust Barrier: Why Consumer Confidence Limits Further Retail Participation
Despite the 12-year volume high, the World Gold Council has identified trust as one of the most significant barriers preventing even broader retail participation in physical gold markets. The issue is not price, availability, or awareness. It is the absence of standardised, independently verified assurance frameworks that allow buyers to assess dealer credibility with confidence. This information asymmetry between dealers and buyers acts as a structural ceiling on retail demand growth.
The Gold Dealer Assurance Standard: What It Is and Why It Matters
To address this gap, the British Standards Institution, working in collaboration with the World Gold Council, has developed a new Gold Dealer Assurance Standard. The consultation process drew more than 120 responses from participants across 16 countries, reflecting the genuinely global appetite for a credible dealer quality framework. The standard evaluates dealers across eight assessment domains including fairness, regulatory compliance, and responsible sourcing practices.
World Gold Council Chief Executive David Tait has emphasised that building institutional-grade trust infrastructure is a prerequisite for sustained expansion of retail gold participation. Without verifiable dealer standards, structural demand growth remains constrained by the difficulty buyers face in distinguishing reputable dealers from unreliable ones.
Key details investors should note about the standard's implementation timeline:
- Independent audit and verification processes are scheduled to commence in Q4 2026.
- Until the trust mark becomes formally operational, buyers retain responsibility for conducting their own dealer due diligence.
- The eight-domain assessment framework covers areas including but not limited to fairness, compliance, and responsible sourcing.
- The 120-country consultation base indicates the standard is designed for global applicability rather than single-market use.
How Does the Broader Precious Metals Complex Respond to Dollar Weakness?
Silver, Platinum, and Palladium Performance: Reading the Sympathy Rally
Dollar weakness does not affect gold in isolation. The entire precious metals complex prices in U.S. dollars and benefits from the same cross-currency cost reduction mechanism when the greenback falls. The week ending August 21, 2026 demonstrated this sympathetic relationship clearly across all four major precious metals. Furthermore, record gold ETF inflows recorded in recent periods underline how institutional capital has been flowing into the broader precious metals space alongside retail demand growth.
Weekly Performance Across the Precious Metals Complex, August 21, 2026
| Metal | Spot Price | Weekly Performance |
|---|---|---|
| Gold | $4,537.41/oz | +3.6% |
| Platinum | $1,865.29/oz | +2.0% |
| Silver | $68.93/oz | +1.3% |
| Palladium | $1,344.44/oz | +0.8% |
Why Precious Metals Move Together and When They Diverge
The sympathetic rally across silver, platinum, and palladium reflects shared sensitivity to dollar movements, but the relative performance rankings reveal important differences in each metal's underlying demand drivers. Gold's outsized 3.6% weekly gain reflects its primary role as a monetary asset where currency dynamics are the dominant pricing variable. Silver's smaller 1.3% advance partly reflects its dual industrial and monetary character, where manufacturing demand signals occasionally compete with safe-haven narratives. Platinum and palladium's intermediate performance reflects their heavier weighting toward industrial and automotive demand, where dollar weakness is a tailwind but not the only factor at play.
What Are the Key Scenarios That Will Determine Gold's Next Move?
Mapping the Three Most Probable Outcomes Before the September Fed Decision
With the September Federal Reserve decision functioning as the most significant near-term binary event for gold, investors should map their positioning against at least three distinct scenarios rather than anchoring to a single base case.
Strategic Scenario Modelling: Gold Price Outlook
| Scenario | Fed Action | DXY Direction | 30-Year Yield | Gold Outlook |
|---|---|---|---|---|
| A (Bull Case) | Hold | Continues lower | Stable or easing | Third weekly gain extends; further upside likely |
| B (Bear Case) | 25 bps Hike | Strengthens | Rises further | Opportunity cost rises; three-week advance at risk |
| C (Mixed) | Hold | Stabilises | Breaks above 5.25% | Yield headwind grows; dollar tailwind fades; neutral to negative |
Scenario B represents the most acute risk to current gold positioning. A rate hike would simultaneously strengthen the dollar, raise the yield benchmark, increase the opportunity cost of non-yielding gold, and potentially break the technical momentum underpinning the three-week advance. The 37% market-implied probability assigned to this outcome is not negligible, and investors treating it as a tail risk may be underweighting a scenario that has a meaningful chance of materialising depending on August inflation data.
Frequently Asked Questions: Gold, Dollar Weakness, and Bond Yields
Why does a weaker dollar push gold prices higher?
Because gold is globally denominated in U.S. dollars, a weaker dollar reduces the local-currency cost of purchasing bullion for buyers operating in euros, yen, yuan, or other currencies. This expands the effective demand base without any change to physical supply, creating upward price pressure through demand aggregation.
What is the opportunity cost of holding gold when bond yields are elevated?
The opportunity cost is the forgone yield that an investor could earn by holding interest-bearing Treasury securities instead of non-yielding gold. With the 30-year yield at 5.2508%, that cost is meaningful, but it is currently being outweighed by the demand-positive effects of dollar depreciation.
Can gold continue rising if Treasury yields remain above 5%?
Historically, sustained gold advances alongside elevated yields are possible but require a compensating force of sufficient magnitude. In the current environment, that force is dollar weakness driven by fiscal credibility concerns. If the DXY continues declining, gold can advance even against a persistent yield headwind.
What is the Gold Dealer Assurance Standard and when does it take effect?
It is a new quality and trust framework developed by the British Standards Institution in collaboration with the World Gold Council, based on consultation with more than 120 respondents across 16 countries. Independent audits under the standard commence in Q4 2026.
How large is the global retail physical gold market compared to total demand?
Retail bar and coin purchases represent approximately 25% of total global annual gold demand. In 2025, this segment reached roughly 1,200 tonnes, its highest volume level in twelve years.
Key Takeaways: The Macro Forces Behind Gold's 3.6% Weekly Advance
Three Catalysts to Monitor Before the September Fed Decision
- DXY trajectory: Any sustained move below 98 would accelerate the demand-pool expansion mechanism described above and likely extend bullion's advance.
- September Fed outcome: The 63/37 hold-to-hike probability split means the policy decision carries binary implications for gold's opportunity cost and dollar direction simultaneously.
- 30-year yield behaviour: A sustained break above 5.25% that is not accompanied by renewed dollar weakness would create a genuinely challenging environment for gold, representing Scenario C in the framework above.
Why the Structural Demand Story Adds a Long-Term Floor Beneath Short-Term Volatility
Short-term gold price movements will continue to be dominated by the dollar-yield-policy triangle outlined in this analysis. However, beneath those tactical oscillations, the structural demand story, 1,200 tonnes of annual retail bar and coin purchases at a 12-year volume high, the impending Gold Dealer Assurance Standard, and the broadening of gold's role as a trust asset rather than a discretionary purchase, creates a durable demand floor that limits the downside even in bearish policy scenarios.
The current environment is one where gold rises as dollar weakness offsets bond yield pressure with sufficient force to drive a meaningful multi-week advance. Whether that configuration persists depends almost entirely on what the Federal Reserve communicates in September and how the Treasury's buyback expansion affects long-end yields in the weeks ahead. For now, the balance of macro forces favours continued support for bullion, with the 63% Fed hold probability and a DXY at three-month lows providing the primary structural tailwinds.
This article is for informational purposes only and does not constitute financial advice. Gold price forecasts, Federal Reserve probability assessments, and scenario projections involve inherent uncertainty. Past correlations between currency movements and commodity prices do not guarantee future outcomes. Investors should conduct independent research and consult a qualified financial adviser before making investment decisions.
For further analysis of macro commodity trends and gold market dynamics, visit Crux Investor, which provides institutional-grade resource market coverage across global commodity sectors.
Want to Capitalise on the Next Major Mineral Discovery Before the Broader Market?
Discovery Alert's proprietary Discovery IQ model instantly identifies significant ASX mineral discoveries, translating complex commodity data into actionable investment insights for both short-term traders and long-term investors — explore historic discovery returns to understand what's possible, then begin your 14-day free trial to position yourself ahead of the market.