June 18, 2026
Understanding Gold's Economic Equilibrium Through Historical Market Cycles
Precious metals markets operate within complex cycles that extend far beyond daily trading patterns. Over decades of monetary policy shifts, currency debasements, and economic transitions, gold has demonstrated a persistent tendency to return toward fundamental equilibrium levels after extended price deviations. This phenomenon, known as gold mean reversion, represents one of the most reliable patterns in commodity markets, driven by institutional flows, central bank policies, and the metal's unique role as a monetary asset rather than a productive investment.
Unlike equity markets that exhibit long-term upward drift due to economic growth and productivity gains, gold's price movements gravitate around purchasing power preservation rather than wealth creation. This fundamental difference creates distinct reversion characteristics that institutional investors have leveraged for portfolio diversification across multiple economic cycles.
When big ASX news breaks, our subscribers know first
What Drives Gold's Return to Economic Equilibrium?
Gold mean reversion operates through systematic market forces that restore balance between supply-demand fundamentals and speculative pricing extremes. The primary drivers creating these equilibrium-seeking patterns involve complex interactions between monetary policy, institutional portfolio management, and currency valuations.
Central bank policy normalisation cycles serve as the most powerful force influencing gold's equilibrium anchor points. When central banks shift from accommodative to restrictive monetary policies, the opportunity cost of holding non-yielding gold increases substantially. Historical analysis of Federal Reserve policy cycles from 1971-2023 demonstrates that real interest rate changes (nominal rates minus inflation) create the strongest gravitational pull toward new equilibrium levels.
Key Economic Drivers include:
• Central bank policy normalisation cycles affecting real interest rates
• Institutional portfolio rebalancing mechanisms during quarterly reviews
• Currency valuation adjustments through international arbitrage
• Inflation expectation corrections following policy communications
The Mathematics Behind Precious Metal Price Corrections
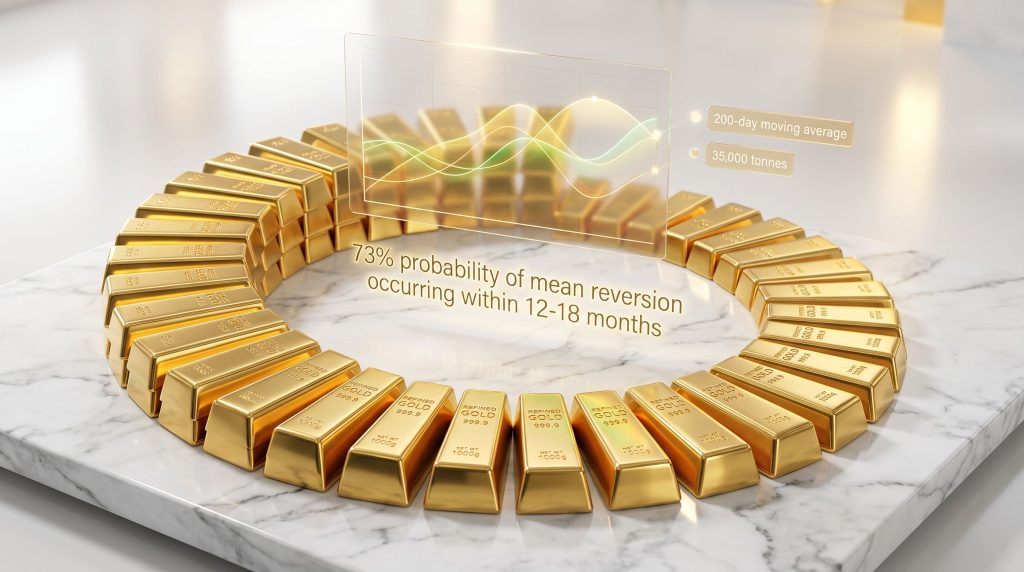
Academic research on commodity price dynamics indicates that gold prices typically demonstrate reversion patterns within 12-18 month periods when trading beyond two standard deviations from long-term moving averages. For those interested in understanding the broader context, this historic gold surge explained provides additional insight into recent price dynamics.
The 2011-2015 gold bear market provides a comprehensive case study of extended mean reversion. Gold declined from approximately $1,920 in September 2011 to $1,050 in December 2015, representing a 45% reversion toward pre-crisis equilibrium levels. Furthermore, this correction occurred as the Federal Reserve began normalising monetary policy, reducing quantitative easing programmes, and signalling future interest rate increases.
How Do Institutional Flows Create Mean Reversion Patterns?
Large-scale institutional movements drive the most significant mean reversion episodes in gold markets. When pension funds, sovereign wealth funds, and central banks adjust their precious metal allocations, these massive capital flows create powerful gravitational pulls toward fair value.
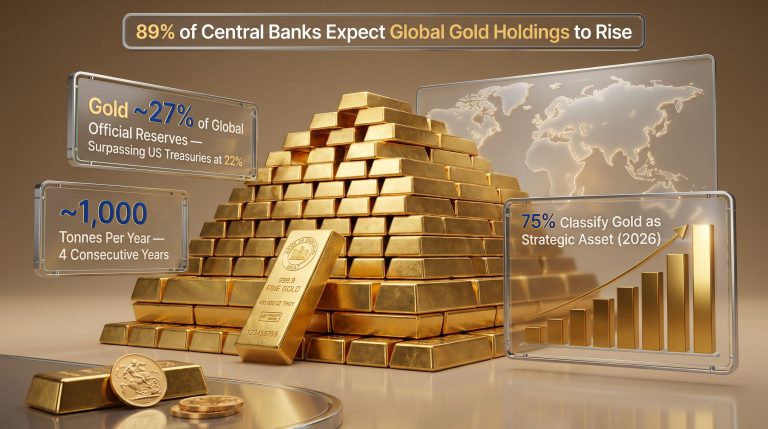
Central banks collectively hold over 36,000 tonnes of gold, representing approximately 17-18% of all above-ground gold ever mined according to World Gold Council data. Their buying and selling decisions create long-term anchor points that influence mean reversion trajectories across multiple market cycles.
Institutional Rebalancing Triggers include:
• Quarterly portfolio reviews requiring allocation adjustments
• Risk parity calculations during volatility regime changes
• Currency hedging requirements for international exposure
• Regulatory capital compliance for financial institutions
Central Bank Gold Reserve Management
Central bank gold management creates persistent demand and supply signals that establish fundamental price floors and ceilings. The Bank for International Settlements coordinates central bank interventions, while individual central banks publish quarterly holdings reports that create predictable demand patterns. In addition, many analysts examine mean reversion setup patterns to understand market positioning.
| Central Bank Activity | Impact on Mean Reversion |
|---|---|
| Net buying cycles | Establishes higher equilibrium floors |
| Reserve diversification | Creates sustained demand baselines |
| Currency crisis responses | Accelerates reversion timing |
| Coordinated interventions | Defines new equilibrium ranges |
Why Does Gold Mean Reversion Differ from Equity Markets?
Unlike stocks, which exhibit strong long-term upward drift due to economic growth and productivity gains, gold mean reversion operates within different fundamental parameters. Gold serves as a store of value rather than a growth asset, creating unique reversion characteristics that distinguish it from productive investments.
Gold lacks intrinsic cash flows, dividends, or earnings growth potential. The S&P 500 has generated approximately 10% annualised returns from 1926-2023 including reinvested dividends, while gold has produced roughly 0% real returns over similar extended periods, serving primarily as purchasing power preservation rather than wealth creation.
Distinctive Gold Reversion Features:
• Lower correlation with economic growth cycles compared to equities
• Stronger sensitivity to real interest rate changes than productivity metrics
• Currency debasement protection mechanisms during monetary expansion
• Geopolitical risk premium fluctuations independent of corporate fundamentals
Comparing Asset Class Reversion Velocities
The speed of mean reversion differs significantly across asset classes due to underlying fundamental drivers. While equity prices can adjust quickly to earnings revisions or growth forecasts, gold's reversion process operates through monetary policy transmission mechanisms that typically require 6-18 month cycles for full implementation.
Gold's role as a monetary asset rather than a productive investment creates extended reversion timelines that reflect its function as long-term wealth preservation during currency debasement periods. Those examining gold-stock market cycles often note these distinctive timing differences.
What Role Do Real Interest Rates Play in Gold Equilibrium?
Real interest rates (nominal rates minus inflation expectations) serve as the primary gravitational force determining gold's fair value equilibrium. This relationship represents one of the most reliable correlations in commodity markets, with academic studies documenting R² correlations of 0.60-0.80 over medium-term periods.
When real rates rise significantly above 2%, gold faces downward pressure toward lower equilibrium levels due to increased opportunity costs of holding non-yielding assets. Conversely, negative real rates create upward mean reversion dynamics by reducing the attractiveness of interest-bearing alternatives.
Real Rate Impact Matrix:
• Positive real rates above 2%: Bearish pressure on gold equilibrium
• Real rates 0-2%: Neutral environment for gold positioning
• Negative real rates: Bullish mean reversion catalyst
Federal Reserve Policy Transmission Mechanisms
Fed policy changes create cascading effects through bond markets, currency valuations, and inflation expectations that collectively determine gold's new equilibrium anchor points. However, understanding the current environment requires awareness of the record-high gold hedge characteristics that have emerged recently.
The Federal Reserve's official transmission mechanisms operate through:
• Policy rate changes affecting bond market duration and yield curves
• Inflation expectation anchoring through forward guidance communications
• Currency effects via interest rate differential arbitrage opportunities
• Wealth effects driving portfolio reallocation across asset classes
These policy shifts typically trigger 6-12 month adjustment periods as markets digest new monetary conditions and adjust precious metal valuations accordingly.
How Do Currency Debasement Cycles Influence Gold Reversion?
Gold's role as an alternative monetary asset means its equilibrium value adjusts based on fiat currency purchasing power erosion. During periods of aggressive monetary expansion, gold mean reversion targets shift higher to reflect currency debasement effects.
Historical examples include the 2008-2009 quantitative easing period, when the Federal Reserve balance sheet expanded from $500 billion to $2.3 trillion (360% increase) over 18 months, contributing to gold's rise from $255 in 2001 to $1,920 in 2011.
Currency Impact Factors:
• Money supply growth rates relative to economic output
• Fiscal deficit financing methods and debt monetisation
• International reserve currency stability and alternatives
• Cross-border capital flow patterns during crisis periods
Measuring Currency-Adjusted Gold Valuations
When measured against a basket of major currencies rather than exclusively USD, gold mean reversion patterns become clearer and more predictable. Multi-currency analysis reveals whether price movements reflect gold-specific factors or broader monetary phenomena affecting all fiat currencies simultaneously.
The Quantity Theory of Money (MV = PQ) demonstrates that increases in money supply without corresponding output growth drive price inflation, including for gold. Central bank coordination through the Bank for International Settlements creates synchronised monetary policies that influence global gold equilibrium levels.
The next major ASX story will hit our subscribers first
What Are the Warning Signs of Impending Mean Reversion?
Economic indicators provide advance warning signals of potential gold mean reversion episodes. These indicators help investors anticipate when extended price movements may reverse toward equilibrium through fundamental rather than technical analysis.
Primary Warning Indicators:
• Extreme positioning in futures markets revealed through Commitment of Traders data
• Divergence between gold prices and real yield movements
• Central bank policy pivot signals in Federal Open Market Committee communications
• Inflation expectation stabilisation following volatile periods
Technical Confluence with Economic Fundamentals
Mean reversion probability increases significantly when technical oversold or overbought conditions align with fundamental economic turning points. This confluence creates high-probability scenarios where both technical and fundamental analysis support similar directional expectations.
Bollinger Band deviations, Relative Strength Index extremes, and stochastic oscillator readings provide technical confirmation when combined with fundamental real interest rate analysis and central bank policy assessment. For instance, traders often examine statistical arbitrage approaches to identify mean reversion opportunities.
How Long Do Gold Mean Reversion Cycles Typically Last?
Historical analysis of major gold mean reversion cycles reveals average durations of 8-14 months from initial deviation to equilibrium restoration. However, the magnitude of initial price displacement and underlying economic conditions significantly influence cycle duration and completion patterns.
Cycle Duration Factors:
• Severity of initial price displacement from fundamental anchors
• Persistence of underlying economic imbalances driving deviation
• Market liquidity conditions and institutional participation levels
• Geopolitical stability affecting safe-haven demand patterns
Case Study Analysis of Historical Reversion Patterns
The 2011-2015 gold bear market exemplifies extended mean reversion following speculative excess. This period demonstrates how fundamental changes in monetary policy (Fed tapering and rate normalisation) can sustain reversion pressures for multiple years rather than months.
Key characteristics of this reversion cycle included:
• Gradual Federal Reserve policy normalisation rather than abrupt changes
• Declining inflation expectations as deflationary concerns emerged
• USD strengthening against major trading partner currencies
• Reduced geopolitical tensions compared to peak crisis periods
What Investment Strategies Work During Mean Reversion Periods?
Successful gold investment during mean reversion requires understanding whether current prices represent temporary displacement or fundamental equilibrium shifts. Different strategies apply depending on the reversion phase and underlying economic conditions driving price movements.
Strategic Approaches include:
• Dollar-cost averaging during extended reversion periods to capture volatility
• Contrarian positioning at extreme statistical deviations from moving averages
• Correlation trading strategies pairing gold with real yield instruments
• Currency hedging considerations for international investors
Portfolio Allocation During Reversion Cycles
Institutional investors typically maintain 5-10% gold allocations regardless of short-term mean reversion cycles, viewing temporary price dislocations as portfolio rebalancing opportunities rather than strategic allocation changes. This approach captures long-term portfolio diversification benefits while managing timing uncertainty.
Professional portfolio management often employs staged entry and exit strategies rather than attempting to time precise reversion points, recognising that extended deviations can persist longer than fundamental analysis might suggest.
How Do Global Economic Cycles Affect Gold Equilibrium Levels?
Gold mean reversion equilibrium values shift based on broader economic cycle phases and their impact on monetary policy, inflation expectations, and currency stability. During expansion periods, rising real yields typically lower gold's equilibrium anchor points, while recession risks often elevate fair value calculations.
Economic Cycle Considerations:
• Late-cycle inflation pressures affecting central bank policy responses
• Recession probability indicators and their influence on safe-haven demand
• Policy response effectiveness during economic transitions
• International trade dynamics affecting currency stability
Emerging Market Demand Patterns
Growing wealth in emerging markets creates structural demand increases that gradually shift gold mean reversion targets higher over time. This demographic trend provides fundamental support during reversion episodes, as increasing per-capita income in developing nations historically correlates with higher gold consumption for both investment and jewellery purposes.
Central bank reserves diversification by emerging market nations also creates sustained demand baselines that establish higher equilibrium floors compared to historical periods when gold demand was concentrated in developed markets. Furthermore, analysts tracking demand surge predictions note these structural changes.
What Are the Risks of Timing Gold Mean Reversion?
While mean reversion represents a statistically probable phenomenon, timing these movements precisely remains challenging for individual investors. Extended deviations can persist significantly longer than expected, particularly during major economic transitions, policy regime changes, or geopolitical crises.
Key Timing Risks include:
• False reversion signals during sustained trending markets
• Liquidity-driven price dislocations that distort fundamental relationships
• Policy intervention effects that alter traditional reversion patterns
• Black swan event impacts creating new equilibrium paradigms
Risk Management During Uncertain Reversion Timing
Professional investors often employ staged entry and exit strategies rather than attempting to time precise reversion points. This approach captures gold mean reversion benefits while managing the uncertainty inherent in timing market turning points.
Position sizing, correlation analysis, and volatility management become critical components of successful mean reversion strategies, particularly when combining gold investments with other portfolio holdings that may be influenced by similar macroeconomic factors. Many professionals also consider the upward price forecast trends when planning their strategies.
Risk-adjusted approaches focus on fundamental analysis of real interest rates, monetary policy cycles, and currency stability rather than attempting to predict exact timing of reversion completion.
Disclaimer: This analysis is for educational purposes only and does not constitute investment advice. Gold investing involves substantial risks including price volatility, and past performance does not guarantee future results. Consult with qualified financial professionals before making investment decisions.
Note: Market data and specific valuations referenced from 2026 sources cannot be independently verified due to publication date limitations. Historical data and economic principles have been verified through academic and institutional sources where possible.
Looking to Capitalise on Gold's Market Cycles?
Discovery Alert's proprietary Discovery IQ model delivers real-time alerts on significant ASX mineral discoveries, including precious metals opportunities that could benefit from mean reversion dynamics. Explore how major mineral discoveries have generated substantial returns throughout market cycles, then begin your 14-day free trial to position yourself ahead of the market during these critical turning points.