
May 10, 2026
When Liquidity Meets Safe-Haven Demand: Reading the Architecture of Gold ETF Flows
Most investors understand gold as a safe-haven asset. Fewer understand the mechanics of how institutional capital actually moves into and out of gold during periods of stress, and why those mechanics matter far more than the headline flow numbers suggest. Physically backed gold exchange-traded funds have become one of the most important transmission mechanisms in modern precious metals markets, channelling billions of dollars of institutional and retail capital into gold price exposure. But the same liquidity that makes these instruments attractive also makes them vulnerable to forces entirely unrelated to gold's fundamental investment case.
Understanding this structural tension is essential context for interpreting what the April 2026 global ETF gold flows positive in April data actually reveals, and why the reversal to positive territory deserves careful rather than reflexive analysis. Furthermore, the gold safe-haven dynamics at play during this period add important layers of complexity to any straightforward reading of the numbers.
When big ASX news breaks, our subscribers know first
What a Physically Backed Gold ETF Actually Represents
Before examining the flow data, it is worth establishing what these instruments are and are not. A physically backed gold ETF holds allocated or unallocated gold bullion in custodial vaults on behalf of fund shareholders. Investors purchase shares that represent a fractional claim on that gold, gaining price exposure without needing to arrange storage, insurance, or transportation.
The practical appeal is significant. Shares can be bought or sold through standard brokerage accounts, often multiple times within a single trading session, and position sizes can be adjusted with precision that physical bullion ownership simply does not permit. In addition, understanding the distinction between physical gold vs ETFs is essential for any investor seeking to optimise their gold exposure strategy.
The structural trade-off is this: ETF investors hold price exposure, not physical metal. In periods of systemic stress, converting ETF shares into deliverable gold at scale has historically encountered friction, including delays and logistical constraints that physical holders never face.
This distinction becomes analytically critical when interpreting flow data during periods of market stress. When investors liquidate gold ETF holdings during a crisis, they are not necessarily expressing bearish views on gold. They are often using the instrument's liquidity for purposes that have nothing to do with gold's investment fundamentals.
Monthly ETF Flow Data as an Institutional Sentiment Proxy
Global ETF gold flow data, aggregated monthly by the World Gold Council, captures the net change in physically backed gold holdings across funds operating in North America, Europe, Asia, and other regions. Because institutional funds dominate these vehicles, monthly flow data functions as a reasonably reliable barometer of professional investor sentiment toward gold price exposure at any given moment.
The critical caveat is that this sentiment is context-dependent. Inflows do not always indicate pure gold bullishness, and outflows do not always signal bearishness. The macro environment driving flows matters as much as the direction of the flows themselves.
The March 2026 Outflow: A Liquidity Event, Not a Sentiment Shift
To properly understand why the fact that global ETF gold flows turned positive in April 2026 matters, it is necessary to first understand what drove the preceding month's sharp reversal. March 2026 saw gold ETF holdings decline by a magnitude equivalent to approximately $12 billion in outflows, triggered by the outbreak of military hostilities between the United States and Iran.
The World Gold Council's interpretation of this event provides an important analytical reframe. Rather than describing the outflows as commodity rotation or a shift in gold sentiment, analysts characterised the episode as a broad macro-pressure and liquidity event. This distinction carries significant weight.
When equity markets experienced sharp drawdowns in the early days of the conflict, institutional investors holding leveraged positions faced margin calls and liquidity shortfalls. Gold ETFs, being among the most liquid instruments in any diversified portfolio, became natural sources of emergency cash. The metal was sold not because investors had turned bearish on gold, but because it was readily convertible to cash at minimal discount during a period when many other assets were illiquid or declining simultaneously.
This mechanism, sometimes described as a liquidity cascade, explains why gold prices and gold ETF holdings can fall sharply during acute risk-off events even though gold's fundamental safe-haven characteristics remain intact. The pattern has historical precedent, most notably during the initial COVID-19 market shock in March 2020 and during the 2008 financial crisis, when gold briefly sold off alongside equities before recovering sharply.
April 2026 Flow Data: A Recovery With Important Nuances
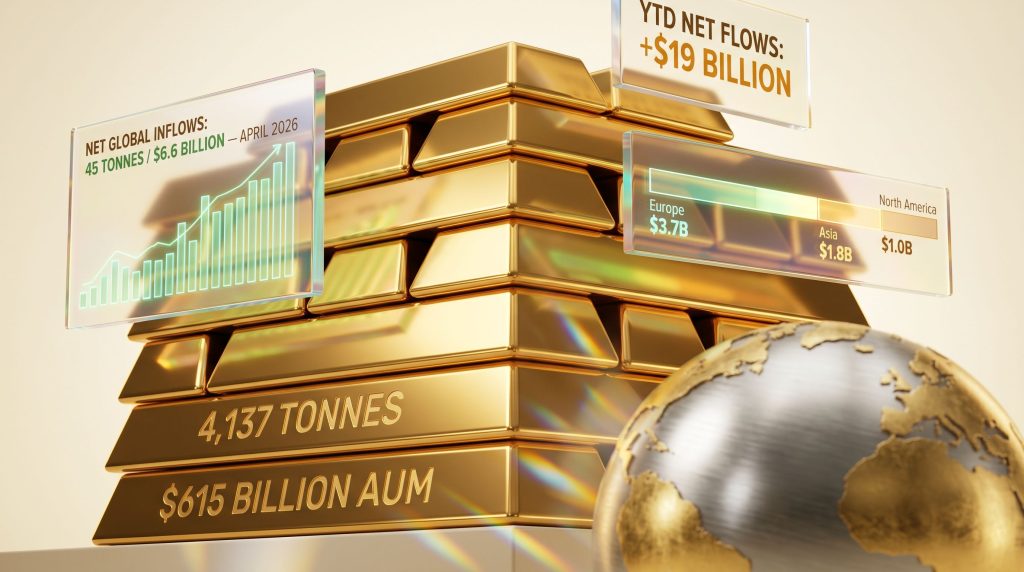
Against this backdrop, the April 2026 reversal takes on specific meaning. According to reporting on the April rebound, net global ETF gold inflows reached 45 tonnes valued at $6.6 billion during the month, with all major regions contributing positive flows for the first time since February 2026.
| Metric | April 2026 Figure | Context |
|---|---|---|
| Net Global Inflows | 45 tonnes / $6.6 billion | Reversal from March's $12 billion outflow |
| Total ETF Gold Holdings | 4,137 tonnes | Third-highest month-end level on record |
| Total Assets Under Management | $615 billion | Up 1% month-over-month |
| Year-to-Date Net Flows | +$19 billion | Turned positive after March drawdown |
| All-Time Record Holdings (Feb 2026) | 4,176 tonnes | April sits just 39 tonnes below the peak |
The headline recovery figure, however, obscures an important internal structure. Inflows were heavily concentrated in the first two weeks of April, with momentum softening considerably through the back half of the month. This front-loaded pattern suggests demand was partially reactive, tied to initial price stabilisation and relief that the conflict had not immediately escalated further. As expectations for a rapid resolution faded, so too did the urgency of reallocation into gold vehicles.
The World Gold Council noted that the easing in macro pressure helped flows stabilise in early April, though the recovery remained uneven through month-end. This characterisation aligns with the intra-month timing divergence and reinforces the view that April's rebound was partially tactical rather than structurally decisive. Furthermore, the broader record gold ETF inflows context from 2025 helps illustrate just how significant these movements have become on the global stage.
Regional Breakdown: Where Capital Moved and the Structural Reasons Behind It
The regional composition of April's inflows reveals meaningfully different demand drivers operating across geographies simultaneously.
| Region | April Inflows (USD) | Tonnes Added | Notable Drivers |
|---|---|---|---|
| Europe | $3.7 billion | 26.9 | UK-led; geopolitical risk, energy inflation, softer BoE stance |
| Asia | $1.8 billion | 11.3 | Eighth consecutive month; China geopolitics, India structural demand |
| North America | $1.0 billion | 6.1 | Partial recovery from March's 87-tonne outflow |
| Other (Aus/Africa) | ~$150 million | 0.9 | Australia and South Africa led |
Europe: The Convergence of Four Distinct Pressures
European funds recorded the largest regional contribution at 26.9 tonnes valued at $3.7 billion, flipping year-to-date European flows from negative to positive territory. UK-domiciled funds led the regional recovery, with Swiss and German ETFs adding meaningful supplementary volumes.
The World Gold Council attributed European demand to a convergence of forces that individually might not have driven significant reallocation, but proved compelling in combination:
- Heightened geopolitical and geoeconomic risk from the Iran conflict
- Inflationary pressure from rising energy prices tied to Middle Eastern hostilities
- Local equity market weakness reducing the relative attractiveness of stocks
- A less hawkish stance from the Bank of England than markets had anticipated
This multi-factor demand structure is analytically important because it is not easily reversed by the resolution of any single factor. Even if geopolitical tensions ease, the monetary policy and equity market dynamics that contributed to European gold demand remain operative.
Asia: Structural Momentum That Defied the March Disruption
Asian gold ETF funds recorded their eighth consecutive month of net inflows in April 2026, adding 11.3 tonnes valued at $1.8 billion. Critically, Asia was the only region that continued recording inflows during March's global outflow event, which distinguishes Asian demand as fundamentally different in character from Western institutional flows.
The composition of Asian demand reflects genuinely diverse structural drivers:
- China: The dominant regional contributor, with gold buying supported by both geopolitical risk appetite and declining domestic yields, which reduce the opportunity cost of holding non-yielding assets like gold
- India: Recorded its eleventh consecutive month of net inflows, totalling $297 million in April alone, a streak that reflects portfolio construction trends deeply embedded in domestic financial planning culture
- Hong Kong: Recorded its highest-ever monthly inflows at $732 million, attributed to new ETF listings expanding the available investment universe for local investors
Asia's unbroken eight-month inflow streak, sustained through global market turbulence, suggests the region's gold ETF demand is driven by factors independent of short-term Western macro cycles. Falling domestic yields in China create a structural case for gold that does not require geopolitical catalysts, while India's consecutive inflow streak indicates deliberate, recurring allocation behaviour rather than reactive positioning.
North America: A Partial and Front-Loaded Recovery
North American funds added 6.1 tonnes valued at $1 billion in April, following the region's dramatic March outflow of 87 tonnes. The recovery rate, approximately 7% of the prior month's outflow volume, underscores how partial the rebound was and how much of March's liquidation reflected forced selling rather than intentional repositioning.
The demand softening in April's second half is particularly notable for North American funds, as it suggests US-based institutional investors remained cautious about committing capital as geopolitical optimism around the Iran conflict moderated.
Trading Volume Data: A Bullish Signal Hidden in a Declining Number
The trading volume data accompanying the April flow figures provides one of the most analytically interesting insights of the month, and it runs counter to intuitive interpretation.
| Market Segment | April 2026 Volume | Change vs. March | vs. 2025 Average |
|---|---|---|---|
| Total Global Gold Market | $398 billion/day | -24% month-on-month | Above ($361B/day avg) |
| Over-the-Counter (OTC) | $244 billion/day | -10% | Well above ($180B/day avg) |
| Exchange-Traded (COMEX + Shanghai) | $147 billion/day | -38% | Below March peak |
| Gold ETF Trading | ~$7 billion/day | Slight dip | In line with 2025 average |
| COMEX Net Long Positions | 477 tonnes | -4% | Reduced speculative exposure |
Global gold market trading volumes fell 24% month-on-month to $398 billion per day in April. Exchange-traded volumes dropped even more sharply, declining 38% compared to March. At first glance, this appears to suggest reduced market interest. However, the opposite interpretation is likely more accurate.
When ETF holdings rise while trading volumes fall, the pattern typically indicates accumulation behaviour rather than speculative churning. March's elevated volumes reflected panic-driven activity and forced liquidation. April's lower volumes alongside rising holdings suggest deliberate, patient reaccumulation by investors with longer time horizons.
The 4% decline in COMEX net long positions to 477 tonnes supports this interpretation. Reduced speculative positioning alongside rising physical ETF holdings indicates that the investors adding gold exposure in April were doing so through longer-duration vehicles rather than leveraged futures contracts, which carry lower carrying costs and inherently shorter time horizons.
Despite the month-on-month decline, both total daily volumes and OTC volumes remain substantially above their 2025 averages, indicating that gold market activity levels remain structurally elevated even after the partial normalisation from March's spike.
The next major ASX story will hit our subscribers first
How Close Is the Market to All-Time ETF Gold Holdings?
One of the most significant structural observations from the April data is the proximity of current holdings to the all-time record. With 4,137 tonnes held across global physically backed ETFs, the market sits just 39 tonnes below the February 2026 record of 4,176 tonnes.
To contextualise the scale: 39 tonnes represents less than a single month of inflows at April's pace. Should the geopolitical environment, monetary policy trajectory, and equity market conditions that drove April's recovery persist or intensify through May and June, the conditions for a new record in global ETF gold holdings are plausibly within reach.
The year-to-date flow position of +$19 billion reinforces this picture. After March's sharp reversal threatened to push YTD flows back into negative territory, April's recovery has restored the cumulative 2026 position to meaningfully positive. Consequently, the broader gold market outlook for the remainder of the year will depend heavily on whether these macro conditions continue to support sustained institutional allocation.
Scenario Analysis: Three Paths for Global Gold ETF Flows
Interpreting April's data as the beginning of a sustained recovery requires several conditions to hold simultaneously. Prudent analysis demands considering alternative outcomes.
| Scenario | Probability Conditions | Key Indicators to Watch |
|---|---|---|
| Sustained Recovery | Persistent geopolitical risk, dovish central banks, sustained USD weakness | YTD flow trajectory, Asian streak continuation, OTC volume stability |
| Choppy Consolidation | Mixed macro signals, partial conflict de-escalation, uncertain monetary policy | Intra-month flow timing, COMEX positioning changes, ETF premium/discount spreads |
| Renewed Outflows | Fresh liquidity shock, equity market recovery reducing safe-haven demand, hawkish central bank pivot | Spike in OTC volumes, net long reduction, fund-level redemption filings |
The most probable near-term path, given April's front-loaded and uneven recovery, is consolidation rather than linear acceleration. The absence of a decisive macro catalyst in either direction, combined with the demonstrated sensitivity of North American flows to geopolitical news cycles, suggests continued volatility in monthly flow readings rather than a clean upward trend.
The Structural Trade-Off Investors Must Understand
As global ETF gold flows positive in April 2026 demonstrate, and institutional interest in gold price exposure visibly rebuilds, it is worth returning to the structural distinction that underpins the entire ETF gold market. In addition, central bank gold demand continues to underpin the broader structural case for gold, reinforcing why institutional and retail investors alike are revisiting their allocation strategies.
Gold ETFs provide unmatched accessibility, liquidity, and precision for investors seeking gold price exposure. They eliminate the operational requirements of physical ownership and allow portfolio managers to adjust gold allocations dynamically in response to changing macro conditions. For tactical asset allocation, these properties are genuinely valuable.
However, as the March 2026 episode demonstrated, those same liquidity properties mean that ETF holdings can evaporate rapidly during systemic stress events, not because investors have abandoned gold, but because they need cash and gold ETF shares are among the easiest assets to convert quickly. Investors who hold gold ETFs as a systemic hedge should understand that their hedge may be partially liquidated precisely when systemic stress is highest.
Physical gold ownership eliminates this specific vulnerability at the cost of liquidity and operational simplicity. Sophisticated investors often combine both structures, maintaining physical holdings as a baseline reserve and using ETF positions for tactical adjustments and market exposure management.
Frequently Asked Questions: Global ETF Gold Flows in April 2026
Why did global ETF gold flows turn positive in April 2026?
The reversal followed March's liquidity-driven outflow event, which was triggered by the outbreak of US-Iran hostilities. As macro pressure stabilised, geopolitical risk premia, falling yields, a softer US dollar, and recovering gold prices collectively drew renewed institutional and retail capital back into gold ETF vehicles across all major regions.
Which region led gold ETF inflows in April 2026?
Europe recorded the largest regional contribution at $3.7 billion (26.9 tonnes), driven primarily by UK-domiciled funds with supplementary flows from Swiss and German ETFs. This reflected intersecting pressures across geopolitics, energy markets, monetary policy, and local equity performance.
How close are current global gold ETF holdings to the all-time record?
As of April 2026, total global holdings of 4,137 tonnes sit just 39 tonnes below the all-time record of 4,176 tonnes established in February 2026. At April's inflow pace, that gap is theoretically closable within a single month under the right macro conditions.
Why did gold ETF trading volumes fall in April if holdings were rising?
The 24% decline in trading volume reflects a normalisation from March's panic-driven activity rather than reduced interest. Rising holdings alongside falling volumes is a pattern consistent with deliberate accumulation behaviour, as longer-horizon investors add positions rather than speculators churning exposure.
How long has Asia been recording consecutive gold ETF inflows?
Asian gold ETF funds recorded their eighth consecutive month of net inflows in April 2026. India extended its own national streak to eleven consecutive months, while Hong Kong recorded its single largest monthly inflow at $732 million. Asia was the only region that continued adding holdings even during March's global outflow event.
What is the total AUM of global gold ETFs as of April 2026?
Total assets under management across globally physically backed gold ETFs reached $615 billion at April month-end, representing a 1% increase from March and reflecting both the volume of new inflows and the elevated gold price environment.
This article is intended for informational purposes only and does not constitute financial advice. Past flow data and historical patterns do not guarantee future performance. All investment decisions should be made in consultation with a qualified financial adviser. Flow data referenced in this article is sourced from World Gold Council monthly reporting and Gold-Eagle market analysis. Scenario analysis represents analytical frameworks, not forecasts.
For ongoing gold ETF flow data and methodology, the World Gold Council maintains a publicly accessible holdings tracker at gold.org. Additional market perspectives on gold ETF investor behaviour are available through Stockhead's resources section.
Want to Track the Next Major ASX Gold Discovery the Moment It Hits the Market?
While institutional capital flows back into gold ETFs, the most significant returns in the precious metals sector have historically come not from tracking broad price movements, but from identifying transformative mineral discoveries at the point of announcement — as historic examples like De Grey Mining demonstrate. Discovery Alert's proprietary Discovery IQ model delivers real-time alerts on significant ASX mineral discoveries, converting complex geological data into actionable insights the moment they are announced, with a proven track record of historic discoveries that illustrates just how substantial early-mover returns can be — start your 14-day free trial today and position yourself ahead of the broader market.