
June 16, 2026
The Hidden Architecture of Gold's Demand Divide
Investor behaviour in commodity markets is rarely uniform across geographies, but the scale of divergence now visible in global gold exchange-traded fund flows represents something structurally significant. Across Asia, fund managers and retail participants continue to add gold exposure through ETF vehicles at a steady pace, even as the metal has retreated sharply from historic highs. Meanwhile, in North America and much of Europe, the same price environment has prompted net redemptions and portfolio rebalancing away from gold. Understanding why these two worlds are responding so differently to identical price signals reveals a great deal about the contrasting economic anxieties, monetary realities, and investment frameworks operating across the global economy in 2026.
This is not merely a story about regional preferences. It is a window into how fundamentally different economic conditions are shaping capital allocation decisions, and what those decisions may mean for where gold's price floor ultimately sits.
When big ASX news breaks, our subscribers know first
Asian Gold ETFs Continue to Add Holdings Even as U.S. and European Funds See Outflows
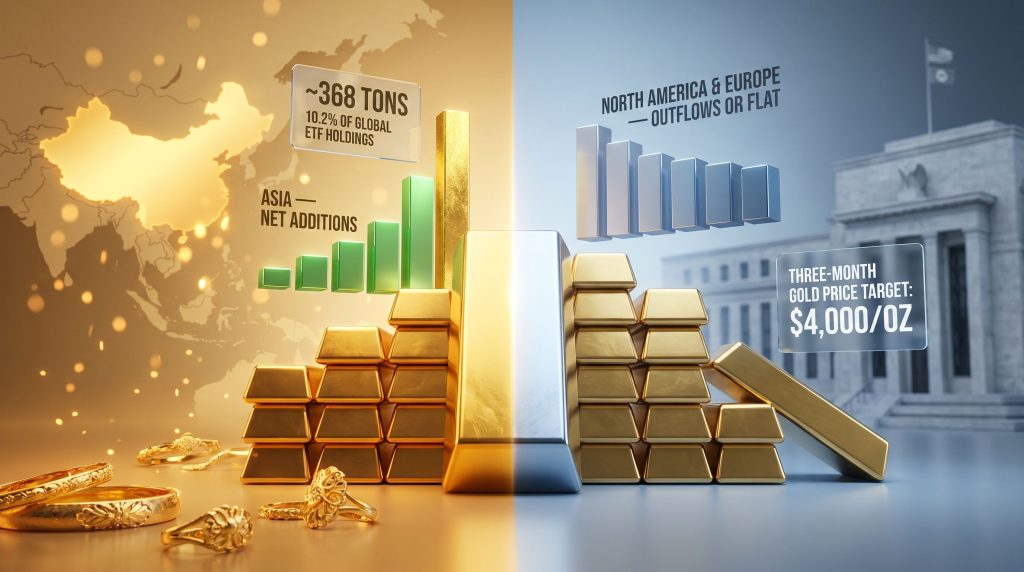
The headline statistic that frames this entire market dynamic is the approximately 25% pullback in gold from its January 2026 closing high, bringing the metal to a technical support zone near the $4,000 per ounce level. In Western markets, this correction has largely been treated as a catalyst for reducing exposure. In Asia, it has functioned as the opposite: an invitation to accumulate.
Asian gold ETFs have continued building holdings through this period, with the regional total reaching approximately 368 tons as of June 2025, representing roughly 10.2% of total global gold ETF holdings. China has been the primary engine of these inflows, absorbing capital during periods when North American and European counterparts were recording net outflows. For a broader view of global gold-backed ETF holdings, the World Gold Council maintains comprehensive flow data that contextualises these regional shifts.
Why the Same Price Creates Opposite Investor Reactions
The contrast in behaviour stems from the fact that gold performs different functions for different investor bases. In Western markets, particularly the United States, gold is frequently evaluated through the lens of opportunity cost against interest-bearing assets. When the Federal Reserve raises rates, the relative appeal of non-yielding gold diminishes for institutional portfolio managers who benchmark returns against bonds and cash equivalents.
In Asia, this calculation carries far less weight. The dominant considerations driving gold accumulation include:
- Currency depreciation risk: Multiple Asian economies have experienced meaningful domestic currency weakening, elevating gold's appeal as a stable store of value denominated in a universally recognised hard asset
- Sustained inflationary pressure: Consumer price dynamics across key Asian markets have remained elevated, reinforcing demand for assets with a historical track record of inflation protection
- Geopolitical risk premiums: Regional tensions and the spillover effects of global conflicts have intensified the safe-haven demand profile for gold across institutional and retail Asian investor bases
- Limited domestic investment alternatives: Particularly in China, where equity market volatility and property sector stress have reduced confidence in traditional domestic asset classes, gold ETFs offer a relatively accessible and liquid alternative
- Cultural and generational demand: The deep-rooted cultural significance of gold in Chinese and Indian societies creates a baseline demand floor that persists through price cycles in ways that Western markets simply do not replicate
The China Factor: Structural Inflows in a Period of Global Uncertainty
China's role in sustaining Asian gold ETF inflows during the current correction period cannot be overstated. While India has shown some evidence of profit-taking behaviour following the metal's record-high pricing earlier in the year, Chinese-listed gold ETFs have continued to attract net new capital. This reflects both institutional reallocation away from distressed domestic asset classes and retail investor behaviour shaped by years of financial market volatility.
Furthermore, gold as a safe haven has taken on renewed significance across Asian markets precisely because conventional alternatives have underperformed expectations.
| Region | Flow Direction (Mid-2026) | Key Driver |
|---|---|---|
| China | Sustained net additions | Domestic asset class alternatives limited; currency hedging demand |
| India | Modest profit-taking | Price-sensitive consumer behaviour at elevated levels |
| Japan and Southeast Asia | Mixed; broadly supportive | Geopolitical risk hedging and currency concerns |
| North America | Outflows or flat | Fed rate hike expectations; opportunity cost calculations |
| Europe | Mixed; some inflows in May 2026 | Selective re-engagement amid regional uncertainty |
Western Gold ETF Outflows: The Rate Cycle Headwind
The mechanics driving Western gold fund outflows are directly connected to the Federal Reserve's policy trajectory. Citigroup revised its three-month gold price target downward to $4,000 per ounce from $4,300, attributing the adjustment to expectations that elevated energy prices and the ongoing impasse over the Strait of Hormuz could prompt the Fed to resume rate hikes. Analysts including Kenny Hu noted that softening physical demand may add further downward pressure to prices.
This creates a feedback loop that is particularly damaging to Western gold sentiment: rising rate expectations push the opportunity cost of holding gold higher, triggering ETF outflows, which in turn amplify short-term price weakness, which reinforces the bearish narrative for rate-sensitive investors.
Bank of America has outlined the structural limitations that constrain gold's appeal as an official reserve asset, noting that its price volatility, lack of yield, high physical storage costs when held in tangible form, and inelastic supply collectively reduce its utility as a liquidity instrument in major institutional Western portfolios. These characteristics, which are essentially features for long-term store-of-value investors, become liabilities in environments where capital needs to be rapidly deployable and yield-generating. In addition, central bank gold demand continues to shape the broader structural backdrop, even as individual sovereign decisions diverge sharply.
Gold Equities: A Valuation Gap That Demands Attention
While the spot gold price has attracted most of the commentary, the equity side of the gold market presents its own compelling analytical picture. Scotia's multi-metric assessment of gold mining equities, spanning free cash flow yield, EV/EBITDA, price-to-cash-flow, and price-to-net-asset-value, and benchmarked against historical data reaching back to the 1970s, concludes that gold stocks are trading at historically attractive valuations relative to the gold price itself.
This is a nuanced distinction worth unpacking. It is not simply that gold equities are cheap in absolute terms. The more significant observation is that the relative valuation of gold miners compared to the underlying commodity they extract has rarely been this compressed over a multi-decade timeframe. Investors seeking to understand this disconnect further may find value in exploring undervalued mining stocks and the structural reasons behind the pricing gap.
Junior Miners: The Re-Rating Gap
RBC's analysis of more than 90 junior gold companies adds granular depth to this picture. The data shows that enterprise value per ounce of resource across the junior universe has risen materially from mid-2025 levels, with average valuations now estimated at approximately $80 per ounce, up from roughly $30 per ounce at mid-2025. This increase has cleared the prior cyclical high established in 2020.
However, when junior miner EV-per-ounce is measured as a percentage of the gold price rather than in absolute dollar terms, valuations remain near cyclical lows. This means that despite nominal appreciation, the sector has not fully repriced to reflect gold's longer-term gains.
| Metric | Mid-2025 | Mid-2026 | Implication |
|---|---|---|---|
| Junior gold EV per ounce (RBC universe) | ~$30/oz | ~$80/oz | Cleared 2020 cyclical highs in absolute terms |
| EV per ounce as % of gold price | Near historic lows | Still near historic lows | Sector has not fully re-rated relative to gold |
| Number of companies tracked | 90+ | 90+ | Broad-based observation, not isolated to large caps |
The Bullish Percent Index Signal: Reading Market Capitulation
One of the more striking technical data points within the gold equity universe is the Gold Miners Bullish Percent Index, which collapsed to approximately 7.7 during the recent correction. This type of reading has appeared only a handful of times over the past decade, with previous occurrences including:
- March 2020 – The COVID-19 market crash, which preceded one of the sector's sharpest recoveries on record
- Late 2022 – The sector bottom, followed by a sustained multi-month rally
- The 2023 low – Which marked the beginning of a significant upward move in gold miners
Readings below the 10 level have historically coincided with peak capitulation in the gold mining sector rather than the beginning of structural decline. The implication for contrarian junior mining investors is significant: extreme pessimism of this magnitude has consistently preceded meaningful sector recoveries when measured against the subsequent 12-month return profile.
Contrarian investment frameworks applied to the gold mining sector suggest that the current index reading may represent maximum fear rather than a structural breakdown, a pattern consistent with prior major buying opportunities in the space.
Physical Demand as a Structural Support: The Chow Tai Fook Signal
Perhaps the most underappreciated element of the current gold market dynamic is the behaviour of physical demand at the consumer level, particularly in Asia. Chow Tai Fook, one of the region's largest gold jewellery retailers, reported FY26 net income of HK$9.0 billion, representing a 52% year-over-year increase, with FY27 guidance that exceeded analyst expectations.
The underlying driver was a recovery in weight-based gold jewellery demand, meaning consumers were purchasing more gold by volume as prices pulled back from their earlier highs. This is the counter-cyclical physical demand dynamic that Asian markets have demonstrated repeatedly: rather than following Western investors out of the market during price weakness, Asian consumers often interpret corrections as purchasing opportunities.
Same-store sales data from April and May reinforced this pattern: mainland China recorded +19.7% growth, while Hong Kong and Macau posted an even stronger +40.6%. These figures suggest that the demand floor beneath gold during Western-led selloffs is materially supported by physical consumption patterns across Asia.
Risk Factors That Could Undermine the Gold Thesis
A balanced assessment of the gold market requires equal attention to the structural risks that could erode the current bullish thesis for Asian ETF holders and gold equity investors.
Royalty and Taxation Policy Risks
The regulatory environment for gold mining is evolving in ways that could materially affect production economics. Scotiabank has identified several jurisdictions where royalty policy changes are under active consideration, including Panama, Chile, Papua New Guinea, and Indonesia. Sliding scale royalty structures, already common across South American and African mining jurisdictions, may be adopted by countries that have not yet implemented them as part of broader alignment with regional policy norms. For investors holding mining equities with exposure to these jurisdictions, incremental cost pressure from royalty adjustments represents a material risk to free cash flow projections.
Operational Disruptions: A Case Study in Grade Risk
Resolute Mining's recent experience illustrates a category of risk that junior and mid-tier gold producers face that is often underestimated by equity investors: the intersection of operational logistics, security conditions, and underground grade variability. The company flagged that security concerns through April and May disrupted delivery of key equipment, affecting access to higher-grade zones in the A21 pit. Simultaneously, intermittent blasting caused by temporary explosives supply issues resulted in underground grades coming in below plan. Deferred maintenance, originally scheduled for May, was extended into June 2026, compounding production impacts. Canaccord noted the company is now targeting the lower end of its full-year guidance range as a result.
This type of multi-variable operational setback is a reminder that gold equities carry execution risk that the commodity itself does not, a distinction that becomes particularly relevant when sector valuations are being reassessed.
Central Bank Reserve Liquidation
Not all central banks are on the same side of the gold trade. The European Central Bank has noted that following the escalation of Middle East conflict, certain central banks liquidated both gold and U.S. Treasury holdings to defend currencies and absorb economic shocks. Turkey's central bank conducted one of the largest reserve drawdowns in recent years, selling or loaning approximately 130 tons of gold to defend the lira, offset rising energy import costs, and manage broader economic instability. Russia has also been reported as a gold seller in 2026, with proceeds reportedly directed toward ongoing military expenditures.
These forced liquidations from economically stressed sovereigns represent a source of supply that is not captured by standard mine output forecasts and can create unexpected price headwinds during periods of existing market weakness.
Platinum's Divergence: A Precious Metals Warning
While gold has found structural support through Asian ETF accumulation, platinum has moved decisively in the opposite direction. ETF holders reduced platinum holdings by 46,948 troy ounces in a single recent session, a 1.6% daily decline that brought year-to-date selling to 15%, the steepest drawdown among all precious metals tracked. Geopolitical headline volatility has been the primary attribution for this selling pressure, underscoring the point that not all precious metals benefit equally from safe-haven flows during periods of global uncertainty. A closer look at gold-silver ratio analysis further illustrates how differently individual metals can respond to the same macro environment. The latest data from Investor Daily also highlights how shifting appetite for risk assets is weighing on broader precious metals demand in Western markets.
The next major ASX story will hit our subscribers first
Three Scenarios for Gold's Near-Term Trajectory
The question of whether Asian gold ETFs continue to add holdings even as U.S. and European funds see outflows ultimately hinges on which macro scenario dominates over the next six to twelve months.
Scenario 1: Sustained Divergence – Asian accumulation continues while Western flows stabilise near current reduced levels. The $4,000 support level holds, underpinned by physical demand and ETF buying from Asian markets, while Western investors remain cautious pending greater clarity on the Federal Reserve's rate trajectory.
Scenario 2: Western Re-engagement – A shift toward a more accommodative Fed stance, or a material de-escalation of geopolitical tensions, triggers renewed inflows into Western gold ETFs. Global flows re-align, and gold benefits from a convergence of both Eastern and Western demand, potentially catalysing a sharp price recovery.
Scenario 3: Asian Demand Cooling – If gold prices stabilise or recover sharply from current levels, the profit-taking behaviour already observed in India could broaden across the Asian investor base. This scenario would narrow the East-West divergence and reduce the demand support structure that has provided a floor during the current correction.
What Informed Investors Should Monitor
Given the complexity of forces operating across both sides of this demand divide, several data points deserve ongoing attention:
- World Gold Council monthly flow reports, specifically the China-disaggregated ETF data, which provides the most granular view of Asian accumulation trends
- Federal Reserve rate guidance, particularly any signals of a policy pivot that could reactivate Western gold ETF demand
- Price behaviour around the $4,000 per ounce level, which represents both a technical support zone and Citigroup's revised three-month price target
- Junior miner valuation metrics relative to spot gold, where the re-rating gap identified by RBC continues to represent a potential structural opportunity for equity-focused investors
- Royalty policy developments in Panama, Chile, Papua New Guinea, and Indonesia, which could alter cost structures for mining operators in those territories
- Sovereign gold selling activity, particularly from emerging market central banks managing fiscal and currency pressures, which represents a non-standard supply variable
This article is intended for informational and educational purposes only and does not constitute financial advice. Gold prices, ETF flows, and mining equity valuations are subject to rapid change and involve significant uncertainty. Readers should conduct their own due diligence and consult a licensed financial adviser before making investment decisions. Forward-looking statements and scenario projections involve assumptions that may not prove accurate.
Want to Track the Next Major ASX Mineral Discovery Before the Market Moves?
Discovery Alert's proprietary Discovery IQ model delivers real-time alerts on significant ASX mineral discoveries, transforming complex geological and commodity data into actionable investment insights for both short-term traders and long-term investors — start your 14-day free trial today and explore how historic discoveries have generated substantial returns for those who positioned early.