June 25, 2026
The Mechanics Behind Gold's Retreat: Why Non-Yielding Assets Suffer When Rates Rise
Understanding why gold and interest rates move in opposite directions requires a look at how investors think about opportunity cost. When rates are low or falling, holding a non-yielding asset like gold carries minimal sacrifice. Investors give up little by allocating capital to bullion instead of bonds or cash. But as interest rate expectations climb, the calculus shifts.
Treasury bonds begin offering meaningful real returns, and suddenly gold's inability to generate income becomes a genuine liability in portfolio construction. The gold price forecast for 2026 has deteriorated sharply as a result of this shifting dynamic.
This dynamic sits at the heart of gold's sharp retreat through the first half of 2026, and it helps explain why gold ETF outflows on Fed monetary tightening have become one of the defining stories in commodity markets this year.
U.S. 10-year real yields, which strip out inflation expectations from nominal yields, function as one of the most reliable leading indicators for gold price direction. Historically, sustained moves higher in real yields have preceded significant ETF redemption cycles. The mechanism is straightforward: when real yields rise materially, institutional investors holding physically-backed gold ETFs begin reassessing whether the position still earns its place in a risk-adjusted portfolio. The result tends to be a wave of redemptions that amplifies the downward price pressure triggered by the monetary policy shift itself.
When big ASX news breaks, our subscribers know first
Gold's 2025 Momentum and How 2026 Broke It
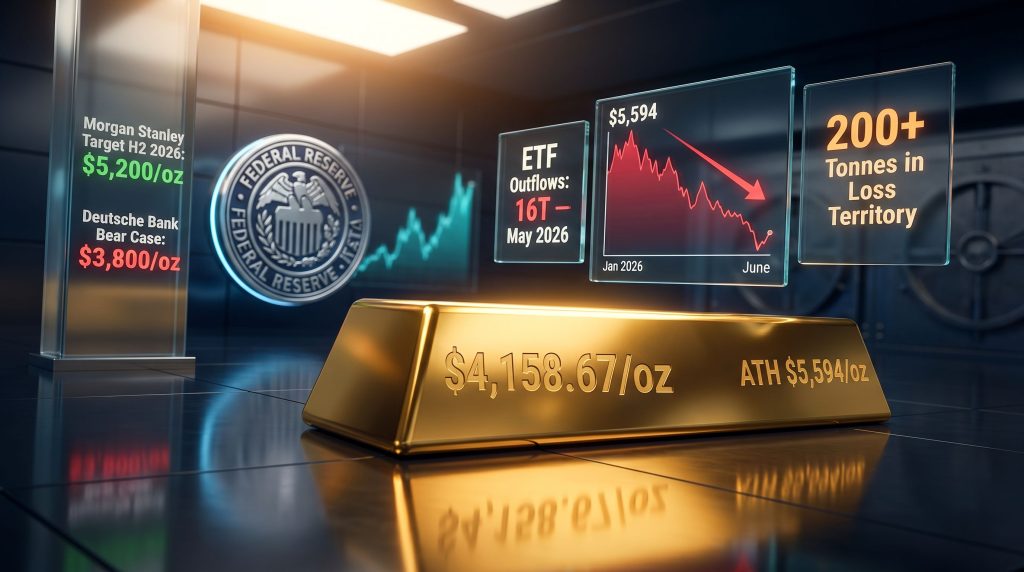
To appreciate the scale of gold's current correction, it helps to understand just how powerful the preceding rally was. Throughout 2025, widespread expectations that the U.S. Federal Reserve would deliver a series of interest rate cuts created a uniquely supportive environment for gold. Real yields fell, the U.S. dollar softened, and institutional investors ploughed capital into physically-backed ETFs at a pace not seen in years. That accumulation drove spot gold to a record high of $5,594/oz in January 2026.
Then the macro backdrop shifted sharply. Rising energy prices, partly a consequence of geopolitical disruption stemming from the Iran war, reignited inflationary pressures across the global economy. Central banks, including the Federal Reserve, responded by adopting a more hawkish tone. Market pricing, which had been confidently positioned for rate cuts, reversed course. Investors began pricing in rate hikes instead, and gold paid a steep price for that reversal.
By June 23, 2026, spot gold had fallen to $4,158.67/oz, representing a decline of approximately 29% from the January peak. The $4,000/oz level, a key psychological threshold, was breached for the first time since November 2025, adding further bearish momentum to an already fragile sentiment picture.
What the ETF Flow Data Actually Reveals
The World Gold Council's data tells a clear story of deteriorating investment demand. Gold-backed ETFs recorded net outflows of 16 tonnes in May 2026, with further outflows continuing through the first half of June. The trend offers a textbook illustration of how quickly institutional investors rotate out of gold when rate expectations tighten.
Julius Baer analyst Carsten Menke has noted that ETF flows are closely linked to U.S. monetary policy, as reflected in the buying and selling activity within physically-backed products. The relationship is not merely correlational. ETF managers and the institutional clients they serve actively monitor Federal Reserve communications and adjust positioning accordingly.
There was a brief flash of stabilisation in late June, when gold-backed ETFs recorded their strongest weekly net inflows since mid-April. Analysts at ING acknowledged that this suggested selling pressure may be easing, but cautioned that ETF demand is likely to remain considerably less supportive than it was throughout 2025.
A particularly striking data point comes from Standard Chartered's analysis: at price levels around $4,000/oz, more than 200 tonnes of gold held within ETFs are sitting in loss-making territory. This structural overhang creates a potentially self-reinforcing selling dynamic. Holders sitting on paper losses face growing pressure to exit, particularly if they believe further price weakness is likely, which itself can contribute to that very outcome.
Monthly and Regional Flow Summary
| Period | ETF Flow Direction | Key Catalyst |
|---|---|---|
| Early 2025 | Strong net inflows | Fed rate cut expectations; gold ATH at $5,594/oz |
| January 2026 | Peak price environment | All-time high of $5,594/oz reached |
| May 2026 | Net outflows of 16 tonnes | Hawkish Fed signals; inflation resurgence |
| First half of June 2026 | Continued net outflows | Rate hike bets intensify post-Iran war energy shock |
| Late June 2026 (weekly) | Strongest weekly net inflows since mid-April | Temporary sentiment stabilisation |
| June 23, 2026 | Spot gold at $4,158.67/oz | 29% decline from January peak |
Regional dynamics add an important nuance to the global picture. While Asian gold markets have generally demonstrated greater resilience than Western counterparts, that resilience is not uniform. South Korean domestic gold ETFs alone recorded approximately 930 billion won in net outflows across the February to May 2026 period, a figure that underscores how even traditionally robust Asian demand contains pockets of significant institutional retreat when monetary headwinds intensify.
Furthermore, comparing physical vs ETFs highlights how differently each vehicle responds to tightening cycles, with physical demand proving more resilient in certain regions.
The Iran War Energy Shock and the AI Capital Rotation Thesis
Two forces have compounded gold's difficulties in ways that go beyond a straightforward rate story. The first is the inflationary impulse created by the Iran war. Energy price spikes have transmitted into broader consumer price data, forcing central banks to maintain or escalate tightening rhetoric at precisely the moment investors had hoped for policy relief. This created a scenario where gold lost two tailwinds simultaneously: rate cut expectations disappeared, and real yields climbed.
The second force is more structurally novel. Adrian Ash, Head of Research at BullionVault, has observed that rising rate forecasts combined with the enormous volumes of capital being raised for artificial intelligence investment signal a broadly optimistic view of U.S. economic capacity. When institutional capital is gravitating toward high-growth technology investment themes, defensive stores of value like gold find it considerably harder to attract fresh allocations. Ash noted that investor attention has decisively shifted elsewhere, even if gold's long-term case remains intact.
This convergence of monetary tightening and technology-driven capital reallocation represents a dual headwind for gold that is qualitatively different from prior rate cycle pressures, when there was no comparable competing demand for institutional capital.
How Major Banks Are Reassessing Their Gold Price Targets
The shift in the monetary outlook has forced meaningful revisions across the major bank research desks covering gold.
| Institution | Position / Target | Key Condition |
|---|---|---|
| Morgan Stanley | H2 2026 target: $5,200/oz | Requires ETF buying revival and oil-price disinflation |
| Goldman Sachs | Lowered December forecast | Reduced ETF demand projections |
| Deutsche Bank | Downside scenario: $3,800/oz | Sustained Fed hikes + ETF outflows + weak Asian demand |
| Standard Chartered | Constructive but cautious | 200+ tonnes of ETF holdings in loss territory |
Morgan Stanley's conditional $5,200/oz target for the second half of 2026 is particularly instructive. The bank has been explicit that achieving this level depends heavily on a revival in ETF buying and evidence that softening oil prices are feeding through to a more accommodative interest rate outlook. Neither condition appears close to being met as of late June 2026.
Goldman Sachs has similarly tempered its enthusiasm, lowering its December gold price forecast and cutting its projections for ETF demand. Deutsche Bank's bear case deserves careful attention: a fall toward $3,800/oz would require three simultaneous adverse conditions, namely sustained Fed rate hike risks, continued ETF outflows, and weakening Asian physical demand. Individually, each of these risks is plausible. In combination, they represent a tail scenario rather than a base case, but the probability of that scenario has risen meaningfully since the start of the year.
Central Bank Buying: The Structural Floor That ETF Flows Cannot Erase
One of the most important dimensions of the current gold market that gets lost in the ETF outflow narrative is the continued strength of official sector demand. Central bank demand has remained robust, with sovereign institutions accumulating gold at historically elevated rates, driven by motivations that are largely insensitive to short-term rate cycles.
The primary drivers of sovereign gold accumulation include:
- De-dollarisation strategies pursued by emerging market central banks seeking to reduce dependence on U.S. dollar reserves
- Geopolitical risk management, particularly among nations seeking to insulate reserve portfolios from potential sanctions or asset freezes
- Reserve diversification as a long-term structural objective, independent of gold's near-term price trajectory
- Inflation hedging at the sovereign portfolio level, where long time horizons make short-term price volatility less relevant
Standard Chartered's Suki Cooper has argued that if official sector accumulation continues at its current pace, sovereign purchases have the capacity to compensate for shortfalls in ETF-driven investment demand, effectively providing a structural price floor even during periods of pronounced investor retreat. This perspective offers a more balanced view than the headline ETF outflow data might suggest.
| Demand Driver | 2025 Trend | 2026 Trend | Outlook |
|---|---|---|---|
| Gold-backed ETF flows | Strong net inflows | Net outflows (May-June) | Contingent on Fed pivot |
| Central bank purchases | Robust accumulation | Continued growth | Structurally supported |
| Asian physical demand | Resilient | Mixed; pockets of weakness | Moderate |
| AI/tech capital rotation | Minimal impact | Growing headwind | Bearish for gold near-term |
The next major ASX story will hit our subscribers first
How a Fed Pivot Would Likely Trigger ETF Re-Accumulation
Understanding the pathway back to positive ETF flows requires mapping out the sequential logic of how monetary policy shifts translate into gold investment behaviour. The steps tend to follow a predictable pattern based on prior rate cycles:
- Inflation data moderates as monthly CPI readings begin trending toward the Fed's target range, reducing the urgency for further tightening.
- The Fed signals a pause through forward guidance language, shifting from an active tightening posture to a holding pattern.
- Real yields plateau or begin declining, reducing the opportunity cost of holding non-yielding assets like gold.
- Institutional ETF flows turn positive as fund managers begin rebuilding gold allocations, often beginning with tactical overweight positions.
- Retail investor sentiment follows, with broader participation amplifying inflow momentum and pushing ETF holdings higher.
- Price recovery accelerates as renewed ETF demand combines with persistent central bank buying, potentially creating a return toward the $5,000/oz zone.
The critical timing question is whether this sequence can plausibly unfold before the end of 2026. Morgan Stanley's $5,200/oz scenario requires it to begin relatively soon. Deutsche Bank's bear case assumes it does not materialise at all in the near term. In addition, the interplay between gold and bonds during this transition will be closely watched by institutional investors managing duration risk.
The Three Scenarios Investors Need to Monitor
Given the binary nature of the current macro setup, three distinct price pathways deserve serious consideration:
- Bullish case: The Fed pauses rate hikes by Q3 2026 as inflation peaks; ETF inflows resume; central bank buying continues; gold targets $5,200/oz by year-end.
- Base case: Rates remain elevated through H2 2026; ETF flows stabilise but stay subdued; gold trades within the $4,000 to $4,500/oz range; central bank demand provides a floor.
- Bearish case: The Fed hikes again in July 2026; ETF outflows accelerate as loss-territory holders capitulate; Asian demand weakens further; gold tests $3,800/oz.
Historically, gold in recessions has demonstrated a capacity to recover sharply once monetary policy pivots, which is why the bearish scenario, whilst plausible, remains a minority view among analysts.
Frequently Asked Questions: Gold ETF Outflows and Fed Monetary Policy
Why Do Gold ETFs Experience Outflows When Interest Rates Rise?
When interest rates rise, bond yields and cash returns become more attractive relative to gold, which generates no income. Institutional investors holding gold ETFs reassess whether the allocation remains competitive on a risk-adjusted basis and frequently reduce exposure in favour of higher-yielding alternatives.
What Is the Relationship Between U.S. Real Yields and Gold Prices?
U.S. real yields represent the return on government bonds after adjusting for inflation expectations. When real yields are negative or very low, gold's lack of yield is less of a disadvantage. When real yields rise materially, the cost of holding gold relative to yielding assets increases, which historically puts sustained downward pressure on gold prices.
What Would It Take for Gold ETF Inflows to Resume?
A convincing shift in Federal Reserve forward guidance toward pausing or cutting rates, combined with evidence that inflation is returning to target, would likely be the primary catalyst. A sustained decline in energy prices following a resolution of geopolitical tensions could accelerate this shift considerably.
Is Central Bank Gold Buying Enough to Support Prices Without ETF Demand?
Standard Chartered's analysis suggests that sustained official sector accumulation at current rates can partially offset the loss of ETF demand, providing a structural floor for prices. However, central bank buying alone is unlikely to drive the kind of price recovery that gold ETF outflows on Fed monetary tightening historically reverse when conditions improve.
Readers seeking additional context on gold market dynamics and ETF investment flows may find related reporting from the World Gold Council's research division a valuable reference for official sector data and demand trends. Furthermore, Mining Weekly's international coverage provides ongoing gold sector analysis useful for tracking real-time developments. This article contains forward-looking statements and analyst forecasts that involve significant uncertainty. Past relationships between interest rates and gold prices do not guarantee future outcomes. Nothing in this article constitutes financial advice.
Want to Stay Ahead of the Next Major ASX Mineral Discovery?
Discovery Alert's proprietary Discovery IQ model delivers real-time alerts on significant ASX mineral discoveries, instantly cutting through complex data to surface actionable opportunities — explore the historic returns major discoveries have generated to understand the potential at stake, then begin your 14-day free trial at Discovery Alert to position yourself ahead of the broader market.