June 24, 2026
The Mechanics of Gold ETF Outflows in a Tightening Monetary Cycle
Understanding how interest rate expectations reshape capital allocation requires looking beyond the simple narrative of "rates up, gold down." The relationship between Federal Reserve monetary policy and gold ETF outflows on Fed monetary tightening operates through a layered set of mechanisms that include real yield dynamics, currency effects, and institutional positioning behaviour. These forces often front-run official policy decisions by weeks or months. For investors trying to navigate the current precious metals landscape, decoding these mechanisms is foundational.
When big ASX news breaks, our subscribers know first
How the Opportunity Cost Equation Undermines Gold ETF Demand
Gold occupies a structurally unique position within investment portfolios. Unlike equities, bonds, or cash deposits, it generates no income whatsoever — no dividends, no coupon payments, no interest. In low-rate environments, this characteristic is tolerable because competing assets offer little yield compensation either. However, when the Federal Reserve shifts to a tightening stance, the landscape transforms rapidly.
Why Real Yields Matter So Much
As real yields on instruments like 10-year Treasury Inflation-Protected Securities (TIPS) climb into positive territory, the implicit cost of holding an ounce of gold in an ETF rises in parallel. Institutional portfolio managers, who are accountable to performance benchmarks, begin systematically reallocating out of physically backed gold products and into yield-generating alternatives. This process does not happen all at once — it unfolds gradually but persistently, creating the sustained outflow patterns now visible in World Gold Council data.
The US dollar adds a second layer of complexity. Tightening cycles historically strengthen the dollar index as yield differentials attract foreign capital into USD-denominated assets. A stronger dollar mechanically reduces gold's purchasing power appeal for investors operating in euros, yen, or other currencies — consequently increasing the cost of holding gold for a large portion of the global investor base.
Furthermore, understanding gold and bond dynamics helps clarify why Julius Baer analyst Carsten Menke has highlighted that ETF flows are closely tied to US monetary policy, as reflected in the buying and selling activity within physically backed products. This linkage is not coincidental — it is structural and has repeated across multiple tightening cycles.
Rate Expectations as a Leading Indicator: Do ETFs Move Before the Fed Does?
One of the least appreciated dynamics in gold ETF markets is how anticipatory the flows actually are. Institutional investors and systematic strategies do not wait for official Federal Reserve announcements before repositioning. Instead, they monitor real-time indicators including:
- Federal funds futures pricing, which reflects market-implied probability of rate hikes at upcoming FOMC meetings
- CME FedWatch Tool data, which quantifies the probability distribution across rate scenarios
- Fed communication tone, including FOMC minutes, member speeches, and press conference language
- Inflation data releases, particularly CPI and PCE readings that inform rate trajectory expectations
When these indicators collectively shift toward a more hawkish outlook, ETF redemption pressure typically builds ahead of any formal policy action. This creates a dynamic where gold prices begin experiencing selling pressure even before a single rate hike occurs — a pattern that has played out repeatedly across historical tightening cycles.
The anticipatory nature of ETF flows means that by the time a rate hike is formally announced, a significant portion of the repositioning may already be complete. Investors who react to announcements rather than expectations often find themselves selling into weakness that was already priced in.
Quantifying the Current Outflow Cycle
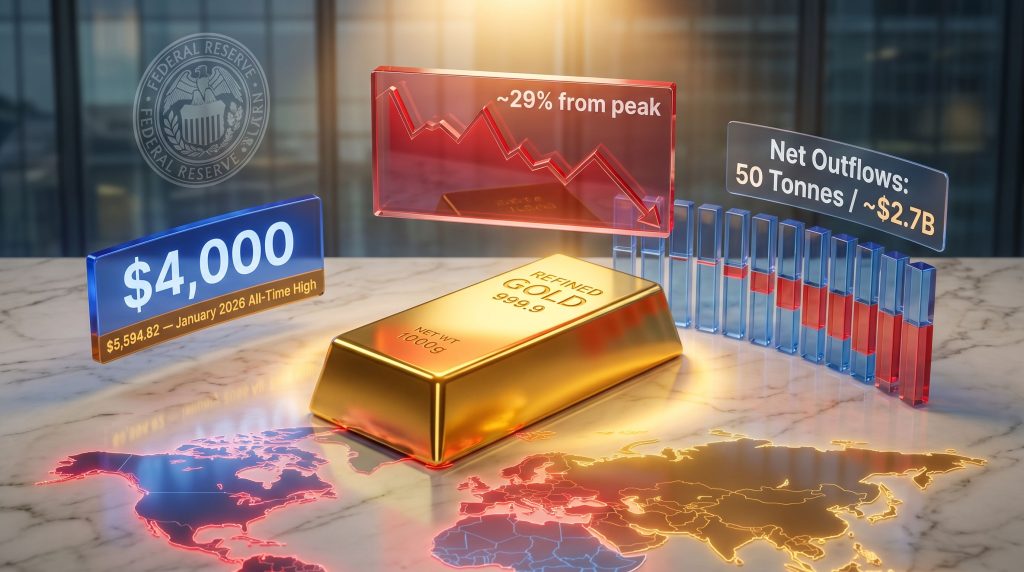
The data emerging from mid-2026 provides a clear picture of deteriorating ETF demand conditions. World Gold Council figures confirm that gold-backed ETFs recorded net outflows of 16 metric tonnes in May 2026 alone, with continued redemptions extending into the first half of June. On a first-half aggregate basis, global gold ETF demand turned net negative by approximately 50 tonnes, representing roughly $2.7 billion in fund redemptions.
Despite a brief stabilisation that saw the strongest weekly net inflow since mid-April 2026, analysts at ING have assessed that ETF demand is unlikely to deliver the same structural support it provided throughout 2025's bull run. For context, ING's analysis on gold price momentum provides useful background on how tightening cycles historically affect gold positioning. The distinction between a temporary pause in outflows and a genuine reversal in trend is critical for investors assessing positioning risk.
Regional Flow Divergence: Asia Stands Apart
Not all regions are experiencing the same dynamic. The breakdown of ETF flows by geography reveals meaningful divergence:
| Region | Flow Direction | Primary Driver |
|---|---|---|
| North America | Net Outflows | Fed hawkishness, rising real yields |
| Europe | Net Outflows | Dollar strength, energy-driven inflation |
| Asia | Net Inflows | Structural demand, currency diversification |
| Global Aggregate | Net Negative | Tightening monetary conditions |
Asian markets, particularly China and India, have maintained a different relationship with gold ETFs. Domestic currency depreciation concerns, persistent cultural demand for gold as a store of value, and a monetary policy environment that has diverged from the Fed's trajectory have kept Asian flows in positive territory. This regional bifurcation is a structural feature of gold markets, not a temporary anomaly.
The $4,000 Level: Technical Support Becomes Technical Resistance
Spot gold's breach of the $4,000 per ounce level in June 2026 marked the first time prices had fallen through this threshold since November 2025. Measured from the January 2026 all-time high of $5,594.82 per ounce, this represented a decline of approximately 29% — a correction of a magnitude that carries significant technical and psychological consequences for ETF positioning.
When a widely watched price level breaks, systematic trading strategies that employ stop-loss mechanisms are triggered automatically, generating forced selling that amplifies the downside move. More critically, Standard Chartered has flagged that at price levels prevailing in mid-June 2026, more than 200 tonnes of gold held within ETFs sits in loss-making territory. This creates a structural overhang:
- Holders of those underwater positions face ongoing pressure to exit at breakeven rather than at a profit
- Any price recovery toward former entry levels risks triggering additional selling by investors seeking to limit losses
- The 200-tonne figure functions as a technical ceiling on sustained price rallies until that inventory is absorbed or prices recover sufficiently
What Is Fuelling the Hawkish Narrative? Energy Prices and AI Capital Flows
Two forces are working in combination to sustain the higher-for-longer rate environment that is suppressing gold ETF outflows on Fed monetary tightening. The first is energy price inflation. Geopolitical conflict in the Middle East has driven energy costs higher, reigniting inflationary pressures at a time when central banks had hoped to declare victory over the post-pandemic price surge. The Fed's response has been to adopt progressively more hawkish communication, shifting market expectations from rate cut pricing to active rate hike probability.
The AI Capital Expenditure Factor
The second force is less commonly discussed: the massive capital raising cycle underway to fund artificial intelligence infrastructure. Adrian Ash, head of research at BullionVault, has made the point that rising rate forecasts combined with large-scale AI-related capital raising signals investor confidence in the trajectory of the US economy.
This matters for gold because it reduces the portfolio insurance function that bullion traditionally serves. When investors are bullish on economic growth and are channelling capital into high-return technology bets, the defensive allocation case for gold weakens considerably. This dual dynamic — energy-driven inflation sustaining hawkish policy plus AI capital expenditure attracting risk appetite — creates a compounding headwind for gold ETFs that goes beyond a simple rate-versus-gold relationship.
The next major ASX story will hit our subscribers first
Central Bank Buying: A Structural Floor, Not a Demand Substitute
Central bank gold buying has been a defining feature of the multi-year gold bull market. Official sector purchasers across emerging markets, particularly in Asia and the Middle East, have been diversifying reserves away from US dollar assets, with gold representing the primary alternative allocation. This demand pillar does not disappear during tightening cycles — central banks are not yield-sensitive investors in the same way institutional fund managers are.
However, as Suki Cooper, analyst at Standard Chartered, has indicated, sustained growth in official sector demand has the capacity to partially compensate for ETF shortfalls — though this is conditional on the pace and consistency of accumulation. The critical distinction is that central bank buying:
- Operates on multi-year strategic timelines rather than monthly rebalancing cycles
- Does not respond dynamically to short-term price signals or ETF redemption waves
- Provides a demand floor for prices but cannot generate the price-positive momentum that sustained ETF inflows create
- Is reported with a lag, meaning its full impact is never visible in real time
In addition, central bank gold reserves data highlights the mismatch in demand timing between official sector buying and ETF flows — the two cannot simply cancel each other out, as they operate on fundamentally different frequencies.
Institutional Price Forecasts and the Conditions Attached to Them
The headline forecasts from major investment banks tell one story; the conditions attached to them tell another.
| Institution | Gold Price Target | Key Condition |
|---|---|---|
| Morgan Stanley | $5,200/oz (H2 2026) | Requires ETF revival and dovish rate signal |
| Goldman Sachs | Revised lower (Dec 2026) | Reduced ETF demand projections |
| ING | Cautious | Selling pressure may be easing, but structural support lacking |
| Standard Chartered | Constructive long-term | Contingent on central bank demand acceleration |
Morgan Stanley's $5,200 target is explicitly conditional on two simultaneous developments: a meaningful recovery in ETF buying activity and evidence that lower energy prices are feeding through to a more accommodative Federal Reserve outlook. Goldman Sachs, having revised its December 2026 forecast downward, is signalling reduced conviction that either condition materialises in the near term.
For a broader view of where prices may be heading, the gold price forecast for 2025 and beyond underscores how significantly ETF demand shapes these projections. The 200-tonne underwater ETF overhang identified by Standard Chartered suggests that even if prices begin to recover, sustained upside will face structural headwinds as loss-making holders seek to exit positions.
Key Institutional Insight: Major banks are not abandoning their long-term gold thesis — they are explicitly linking near-term price targets to ETF demand recovery. Without that demand engine restarting, even structurally bullish forecasts become theoretical rather than actionable.
Three Forward Scenarios for Gold ETF Flows Through End-2026
Scenario 1: Prolonged Tightening (Base Case Risk)
The Fed maintains elevated rates through Q4 2026 as energy-driven inflation remains persistent. ETF outflows continue, with the 200-tonne underwater overhang capping price recovery. Gold consolidates in the $3,800 to $4,200 range, with central bank buying providing a structural floor but insufficient momentum for a sustained rally.
Scenario 2: Policy Pivot Signal (Bull Case Trigger)
Disinflation evidence and softening labour markets prompt the Fed to signal a credible rate cut timeline. Institutional investors front-run the policy shift, driving ETF inflows that rapidly absorb the loss-making overhang. Morgan Stanley's $5,200 target becomes achievable within a six-to-nine month window. This scenario requires both energy price relief and labour market deterioration simultaneously.
Scenario 3: Stagflationary Shock (Alternative Safe-Haven Reactivation)
Energy prices surge further, economic growth contracts, and the Fed confronts a policy dilemma between controlling inflation and preventing recession. Gold's safe-haven role reasserts itself independently of rate dynamics. ETF flows could reverse rapidly on pure risk-off positioning, bypassing the normal rate-cut catalyst entirely. This scenario is historically rare but has precedent in the 1970s stagflation period.
Historical Context: Gold ETF Behaviour Across Prior Fed Tightening Cycles
Placing current outflow dynamics in historical context reveals both the severity and the precedent for what is occurring. The current cycle of gold ETFs outflows on Fed monetary tightening is tracking similarly to prior episodes in terms of directional momentum.
| Fed Tightening Period | ETF Flow Outcome | Peak Outflow Volume | Gold Price Impact |
|---|---|---|---|
| 2013-2015 (Taper Tantrum) | Sustained net outflows | ~880 tonnes over 2 years | ~35% price decline |
| 2017-2018 (Rate Hike Cycle) | Mixed; modest net outflows | ~100 tonnes | ~10-15% correction |
| 2022-2023 (Aggressive Hike Cycle) | Significant net outflows | ~50 tonnes (H1 2023) | Significant pressure |
| 2025-2026 (Current Cycle) | Net outflows accelerating | 16 tonnes (May 2026 alone) | ~29% from January peak |
Note: Historical data is presented for structural comparison purposes only. Past market behaviour does not predict future outcomes.
The 2013 Taper Tantrum remains the most instructive precedent because it demonstrated how aggressively ETF holders can exit positions when rate expectations shift decisively. Nearly 880 tonnes left gold ETFs over a two-year period, contributing to a 35% price decline. Furthermore, as investor appetite for risk assets demonstrates, ETF demand cooling can also be driven by broader confidence in equity markets rather than rates alone.
What Investors Should Monitor Going Forward
For investors seeking to track the evolution of gold ETF flows, the following indicators represent the most direct signal inputs:
- 10-year TIPS real yield — the single most important variable for gold ETF positioning; when this moves above 2%, pressure on gold intensifies materially
- Fed communication cadence — every FOMC statement, minutes release, and member speech now functions as a direct ETF flow trigger in either direction
- Energy price trajectory — crude oil and natural gas prices are the upstream driver of the inflation narrative keeping the Fed hawkish
- World Gold Council monthly flow reports — the most reliable source for tracking ETF demand across regions with breakdown by fund type
- The 200-tonne loss-making overhang — this figure represents the structural selling pressure ceiling on any price recovery attempt
The near-term outlook for gold ETFs remains constrained by the convergence of real yield pressure, dollar strength, and the competing narrative of AI-driven US economic confidence. However, the long-term structural case built on central bank diversification, geopolitical uncertainty, and de-dollarisation trends has not been dismantled. What has changed is the timeline — and the catalyst required to bring institutional ETF demand back to the table.
Disclaimer: This article is for informational purposes only and does not constitute financial advice. All forecasts, price targets, and scenario projections involve significant uncertainty and may not be realised. Past performance of gold or gold ETFs does not indicate future results. Readers should conduct their own due diligence before making investment decisions.
Want to Stay Ahead of the Next Major Mineral Discovery on the ASX?
While gold ETF dynamics and monetary policy shifts shape the broader precious metals landscape, the most significant wealth-creation events in the sector often come from ground-level mineral discoveries — and Discovery Alert's proprietary Discovery IQ model delivers real-time alerts the moment significant ASX discoveries are announced, turning complex data across 30-plus commodities into clear, actionable insights. Explore Discovery Alert's discoveries page to see the historic returns major mineral discoveries have generated, and begin a 14-day free trial to position yourself ahead of the broader market.