August 4, 2026
When Capital Follows Conviction: How Gold Reclaimed Australia's Exploration Agenda
Every major commodity cycle eventually produces a moment of reckoning, where the assumptions that drove the previous wave of investment are stress-tested against real-world returns. For Australia's mineral exploration sector, that moment arrived clearly in 2025. After years of enthusiasm around battery metals and critical minerals, the Australian Mineral Exploration Review gold surge revealed one of the most decisive redirections of exploration capital in recent memory. The result is a dataset that tells a story not just about gold, but about how the entire architecture of Australian mineral exploration is being renegotiated in real time.
When big ASX news breaks, our subscribers know first
What the 2025 AMER Numbers Actually Reveal Beneath the Surface
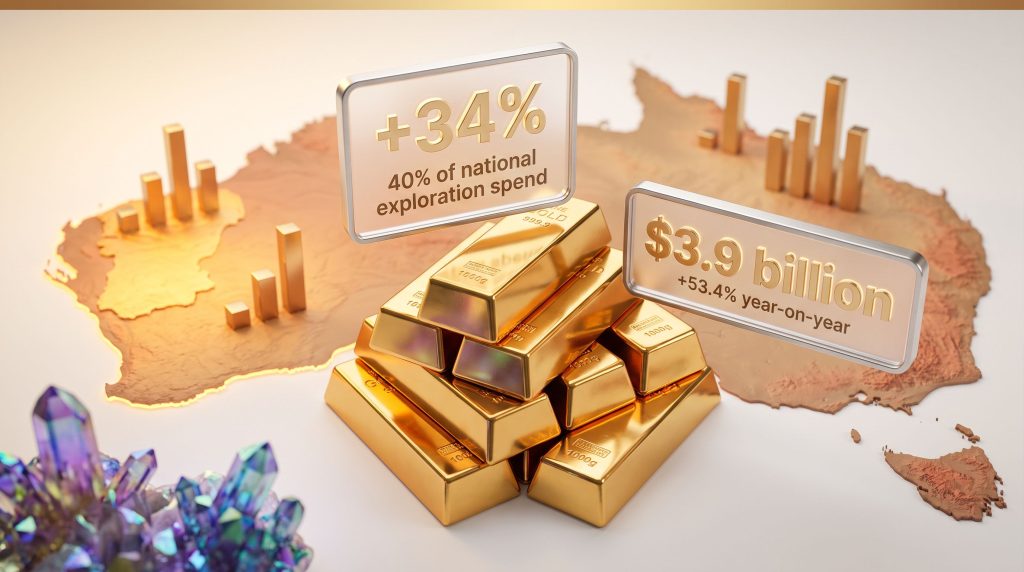
The headline figure from the 2025 data is deceptively calm. Total national mineral exploration expenditure reached $3.9 billion, representing a gain of just 0.2% year-on-year. On its face, that suggests a sector in stasis. But the internal composition of that figure tells an entirely different story.
Gold exploration expenditure surged 34% during the year, capturing approximately 40% of all national exploration spending. That means roughly two dollars in every five directed toward Australian mineral exploration in 2025 was chasing gold. By the March 2026 quarter, the acceleration had intensified further, with Australian Bureau of Statistics data recording total mineral exploration reaching $949.3 million for the quarter alone, up 16.3% from the same period in 2025. Gold's year-on-year growth rate for that quarter reached 53.4%.
The flat total expenditure figure conceals a dramatic internal redistribution. Capital was not simply added to gold exploration on top of existing budgets; it was actively pulled away from other commodities and redirected. This is a structural preference shift, not an incremental expansion.
Understanding this distinction matters enormously for anyone reading exploration data as a forward indicator of future mineral supply. The question is not just how much money is being spent, but where it is going and why. Furthermore, the gold price records in 2025 provide essential context for understanding why capital moved so decisively.
The Gold Price Mechanism and Exploration Decision-Making
There is a well-established relationship between sustained gold price levels and exploration drilling intensity. When prices breach and hold above key psychological thresholds, junior and mid-tier exploration companies gain improved access to equity capital markets, which directly funds drilling programs. The US$2,800 to US$3,000 per ounce price range that characterised much of the 2025 to 2026 period appears to have been the threshold at which Australian brownfields drilling programs accelerated most aggressively.
What is less commonly understood is the lag structure embedded in this relationship. Exploration decisions, particularly at the brownfields level, are typically made six to twelve months before drilling commences, meaning the surge in gold-related activity visible in 2025 data partly reflects pricing signals from mid-2024. The acceleration visible in the March 2026 ABS data therefore reflects decisions made during the elevated price environment of late 2024 and into 2025.
Compared to the 2023 to 2024 gold price environment, where prices were already trending upward but with more volatility, the 2025 period provided the sustained price floor that boards and project managers need before committing to multi-quarter drilling budgets.
Commodity-by-Commodity: Where the Money Went and Where It Didn't
The redistribution of exploration capital in 2025 played out differently across commodity classes. The following table captures the key movements:
| Commodity | 2025 Exploration Trend | Share of Total Spend | Key Dynamic |
|---|---|---|---|
| Gold | +34% year-on-year | ~40% of national total | Dominant and still accelerating |
| Silver-Lead-Zinc | +20% year-on-year | Moderate, growing share | Strong secondary growth signal |
| Critical Minerals | Declined vs. 2024 | Significant but contracting | Spending down, discovery rate maintained |
| Iron Ore and Coal | Broadly flat | Declining relative share | Mature asset profiles |
Silver-Lead-Zinc: The Secondary Trend Most Analysts Are Missing
While gold commands the narrative, a 20% increase in silver-lead-zinc exploration spending represents a meaningful secondary signal that deserves more analytical attention. Polymetallic systems containing silver, lead, and zinc have historically offered diversified revenue streams that make project economics more resilient across commodity cycles. Silver in particular occupies a unique dual role, functioning simultaneously as an industrial input for solar panel manufacturing and electronics, and as a monetary metal that tends to attract interest during the same macroeconomic conditions that support gold.
The growth in polymetallic exploration may also reflect a subtle strategic calculation by exploration companies: diversified commodity exposure within a single tenement reduces the risk that a single price correction will strand an otherwise viable deposit. In addition, current gold exploration trends suggest that polymetallic systems adjacent to gold-bearing structures are attracting increasing attention from geological teams.
Critical Minerals: The Counterintuitive Discovery Paradox
Perhaps the most analytically interesting aspect of the 2025 AMER data is the apparent paradox in critical minerals exploration. Spending fell relative to 2024 levels, yet the sector produced 32 maiden mineral resource discoveries during the year. This outcome challenges the conventional assumption that exploration investment and discovery rates move in direct proportion.
Several factors explain how discovery efficiency can improve even as overall spending contracts:
- Improved pre-competitive geoscience data: As Geoscience Australia's publicly available geological datasets become richer and more granular, private explorers can target drilling programs more precisely, reducing the number of metres drilled per discovery.
- Machine learning-assisted geological targeting: A growing number of exploration companies are applying predictive geological modelling to narrow their search areas before a single drill hole is committed.
- Accumulated learning from prior campaigns: Years of prior critical minerals drilling across northern Australia have produced datasets that current exploration teams can interpret with greater sophistication.
- Maturation of tenure portfolios: Companies that secured tenements during the critical minerals enthusiasm of 2021 to 2023 are now drilling into better-understood geological settings.
Australia's Critical Mineral Resource Base Expanded Dramatically in 2025
Despite the spending reduction, the resource growth numbers from 2025 are strategically significant and, in the case of gallium, historically notable. Australia's critical minerals outlook has been reshaped considerably by these discoveries, with downstream implications for allied supply chains.
| Critical Mineral | Resource Growth in 2025 | Primary Application |
|---|---|---|
| Gallium | +467% increase in known Australian resources | Semiconductors, solar cells, defence electronics |
| Antimony | +40% increase in known resources | Battery technology, flame retardants, military munitions |
| Rare Earth Elements | +8% increase in known resources | EV motors, wind turbines, precision-guided systems |
Why the Gallium Number Carries Outsized Strategic Weight
A 467% expansion in Australia's known gallium resource base is not simply a geological statistic. Gallium is a byproduct mineral, meaning it is typically recovered from bauxite processing streams rather than mined directly. This extraction pathway makes primary gallium supply extremely concentrated, with China historically accounting for the overwhelming majority of global refined gallium output.
Export controls on gallium introduced by China in 2023 sent significant price signals through global semiconductor and defence supply chains. The growth in Australia's known gallium resources therefore arrives at a moment when allied nations are actively seeking alternative supply pathways for this material. Understanding that gallium is not mined from dedicated gallium deposits but is instead recovered as a processing co-product is critical context for evaluating what these resource additions actually mean for future supply feasibility.
Gallium's strategic classification under several allied nations' critical minerals frameworks reflects its irreplaceability in compound semiconductor manufacturing. There is currently no commercially viable substitute for gallium arsenide in certain high-frequency military and communications applications.
Antimony's 40% resource growth is similarly significant. Beyond its battery technology applications, antimony trioxide is a primary flame retardant used in electronics manufacturing, and antimony is a key component in certain military munitions and armour-piercing projectiles. Like gallium, its supply chain is heavily concentrated, with China and Russia historically controlling the dominant share of global output.
The Brownfields Dominance: What It Means for Future Gold Supply Timelines
One of the less-discussed but critically important aspects of the Australian Mineral Exploration Review gold surge is the compositional nature of the drilling activity driving the numbers. The 2025 to 2026 gold exploration surge has been predominantly brownfields in character, meaning the majority of new drilling is occurring at or adjacent to existing known deposits rather than in genuinely new frontier terrain.
This has specific implications for how quickly exploration activity converts into production capacity:
- Faster resource conversion: Brownfields drilling aimed at resource extension and infill can convert inferred resources to indicated and measured categories within one to two years, potentially triggering production decisions much faster than greenfields discoveries.
- Lower per-metre discovery cost: Drilling into known geological settings typically produces commercially meaningful results at lower cost than frontier exploration.
- Limited transformational upside: A brownfields-dominated cycle is unlikely to produce the kind of new district-scale discoveries that reshape national gold production profiles over the following decade.
- Western Australia's structural advantage: The Eastern Goldfields, Murchison, and Pilbara geological corridors in Western Australia contain the largest concentration of existing gold infrastructure, making brownfields activity in these regions particularly capital-efficient.
Western Australia accounted for the largest share of national gold exploration expenditure by a considerable margin, with the state recording record quarterly exploration spending levels during late 2025 and into early 2026.
A Speculative Scenario: What a Sustained Price Environment Could Trigger
If gold prices remain within or above the US$2,800 to US$3,000 per ounce range through 2026 and into 2027, the logical progression of the current brownfields drilling cycle would be an intensification of resource-to-reserve conversion programs. Companies sitting on inferred resource inventories that were marginal at lower gold prices now have the economic incentive to invest in the tighter drill spacing and metallurgical work required to move those resources toward production decisions.
A secondary greenfields wave could plausibly follow approximately 12 to 18 months after the brownfields cycle peaks, as junior explorers access improved capital market conditions and target areas adjacent to newly expanded deposits. This sequencing — brownfields first and greenfields following — is consistent with historical exploration cycle behaviour in Western Australia during prior gold bull markets.
This scenario involves speculative assumptions about future gold prices and capital market conditions. Readers should treat this projection as a framework for thinking about cycle dynamics rather than a prediction of specific outcomes.
The AMER's Digital Transformation: A Structural Upgrade for Exploration Intelligence
Beyond the commodity data itself, the 2025 AMER introduced a significant change in how exploration intelligence is disseminated. For the first time since the publication's launch in 2009, users can download both the complete report and the underlying datasets simultaneously. Furthermore, the mineral discovery curve framework helps contextualise where individual projects sit within broader exploration cycles.
The practical implications of this architectural shift extend across several stakeholder groups:
- Junior exploration companies can now overlay AMER spatial data against their own tenement positions to identify geological trends relevant to their specific project areas.
- Institutional investors conducting resource sector due diligence can integrate exploration trend data into proprietary screening models without manual data extraction.
- Government infrastructure planners can use discovery location data to inform regional transport, energy, and processing facility investment decisions more precisely.
- Academic researchers gain access to a standardised longitudinal dataset spanning from 2009 to the present, enabling time-series analysis of Australian exploration cycles.
Integration with GIS platforms, including the Digital Atlas of Australia, enables spatial correlation analysis that was previously only possible for organisations with substantial in-house data science capability. This democratisation of exploration intelligence is a meaningful step toward levelling the analytical playing field between well-resourced majors and smaller exploration participants.
The next major ASX story will hit our subscribers first
Pre-Competitive Geoscience: The 35-Year Investment Horizon
One dimension of Australia's exploration landscape that is frequently underappreciated by investors is the role of pre-competitive geoscience investment in shaping where private exploration capital flows over the medium and long term.
Geoscience Australia's Resourcing Australia's Prosperity initiative represents a commitment to building publicly available geological knowledge over a 35-year horizon. The logic underpinning this investment is that private exploration companies cannot economically justify the cost of acquiring basin-scale geophysical data, deep crustal imaging, or regional geochemical surveys that benefit the entire industry rather than a single tenement holder.
When government funds this pre-competitive layer, it effectively reduces the geological risk premium embedded in exploration decision-making across the sector. The latest Australian mineral exploration data further underscores how public geoscience investment is influencing where private capital is being directed. The practical effect is particularly visible in frontier regions such as northern Australia, where limited prior exploration history has historically constrained private capital commitment.
Reading the 2025 Data as a Forward Indicator: Key Metrics to Watch
The Australian Mineral Exploration Review gold surge data is a point-in-time snapshot of capital preference rather than a permanent structural verdict on which commodities matter most. Several dynamics could shift the composition of exploration spending significantly over the next two to four years:
- Gold price trajectory: A correction below the US$2,500 per ounce level sustained over multiple quarters could trigger a rapid reallocation of exploration capital back toward battery metals and critical minerals.
- Critical minerals policy evolution: Announcements relating to offtake arrangements with allied nations, or new additions to the Australian Government's Critical Minerals Strategic Reserve, would likely stimulate targeted exploration spending in affected commodity classes.
- Quarterly ABS mineral exploration data: The June 2026 quarter release will provide the next benchmark for assessing whether the gold exploration acceleration is maintaining momentum or beginning to moderate.
- Greenfields permit applications in northern Australia: An uptick in new exploration licence applications across underexplored northern terrains would serve as a leading indicator that a second-wave greenfields cycle is beginning to form.
- Downstream processing investment decisions: The commercial viability of Australian critical mineral deposits is increasingly evaluated alongside proximity to potential processing infrastructure, making processing investment announcements an important contextual variable for assessing discovery quality.
Disclaimer: The forward-looking metrics and scenario analyses discussed in this article are provided for informational and educational purposes only. They do not constitute financial advice. Past exploration trends are not necessarily indicative of future investment performance. Readers should conduct independent research and consult qualified financial advisers before making investment decisions related to the mining sector.
Frequently Asked Questions
What is the Australian Mineral Exploration Review?
The Australian Mineral Exploration Review is an annual publication by Geoscience Australia that provides a comprehensive national overview of mineral exploration activity, covering expenditure data, commodity trends, resource discoveries, and the policy and geological factors shaping future mineral supply. The 2025 edition marked the first release in a fully downloadable digital format with accessible underlying datasets since the publication's launch in 2009.
How much did gold exploration spending increase in Australia in 2025?
Gold exploration expenditure grew by 34% in 2025, reaching a share of approximately 40% of Australia's total mineral exploration spend of $3.9 billion. By the March 2026 quarter, Australian Bureau of Statistics data showed gold exploration growing at 53.4% year-on-year.
Why did critical minerals exploration spending fall despite strong discovery numbers?
Capital was redistributed toward gold in response to elevated gold prices, reducing critical minerals exploration expenditure relative to 2024. Despite this, improved geological targeting methodologies and richer pre-competitive geoscience data allowed the sector to maintain a high discovery rate, producing 32 maiden mineral resource discoveries during the year. Furthermore, those interested in interpreting drill results will find that efficiency gains in targeting have been a key contributor to maintaining discovery rates under tighter budgets.
What were the largest critical mineral resource gains recorded in 2025?
Australia's known gallium resources expanded by 467%, antimony resources grew by 40%, and rare earth element resources increased by 8%. Each of these minerals is identified under strategic supply frameworks maintained by Australia and several allied nations.
What is the difference between brownfields and greenfields exploration?
Brownfields exploration involves drilling activity at or near existing known mineral deposits, typically offering lower geological risk and faster timelines to production decisions. Greenfields exploration targets areas with no prior discovery history, carrying higher geological uncertainty but offering the potential for transformational new discoveries. The dominant character of the 2025 to 2026 gold exploration surge has been brownfields.
Where is gold exploration most concentrated in Australia?
Western Australia is the dominant jurisdiction, with the Eastern Goldfields, Murchison, and Pilbara corridors attracting the largest share of national gold exploration capital. The state recorded record quarterly exploration spending levels during late 2025 and into the first quarter of 2026.
Want to Know When the Next Major ASX Gold Discovery Hits the Market?
Discovery Alert's proprietary Discovery IQ model scans ASX announcements in real time, instantly identifying significant mineral discoveries — including the gold and critical mineral opportunities reshaping Australia's exploration landscape — and delivering actionable alerts directly to subscribers. Explore historic discoveries and their remarkable returns, then start your 14-day free trial at Discovery Alert to position yourself ahead of the market.