
August 4, 2026
The Monetary Scoreboard Most Investors Never Check
Every financial system operates on a unit of measurement. In the United States, that unit is the dollar. Yet remarkably few investors ever stop to ask whether the measuring stick itself is shrinking. A portfolio denominated entirely in dollars can display rising nominal values while quietly delivering falling real wealth, and the mechanism responsible for that gap is visible in a single data series: M2 money supply and gold prices tell a story together that neither tells alone.
Understanding why requires stepping back from individual asset prices entirely and examining the monetary system that denominates them all. Furthermore, exploring the gold bull market catalysts at play today adds important context to this analysis.
When big ASX news breaks, our subscribers know first
What M2 Money Supply Actually Measures
The Federal Reserve publishes money supply data through its monthly H.6 Money Stock Measures release, tracking the US economy's monetary pool across several aggregate layers. Each layer captures a progressively broader definition of spendable money.
The Architecture of Money: From Base to Broad
-
M0 (Monetary Base): Physical currency in circulation plus commercial bank reserves held at the Federal Reserve. This is the raw material of money creation, created directly by central bank policy decisions.
-
M1: Currency, demand deposits, checking account balances, and savings deposits. Notably, the Federal Reserve reclassified savings deposits into M1 in May 2020 per the H.6 Money Stock Measures update, making M1 substantially broader than its pre-2020 definition [Federal Reserve H.6].
-
M2: Everything within M1, plus two near-liquid categories: small-denomination certificates of deposit under $100,000, and retail money market fund balances. IRA and Keogh retirement account balances are excluded from the aggregate total.
Key Definition: M2 represents the complete stock of dollars that are either immediately spendable or convertible to spendable form within days. It is the economy's usable monetary pool, capturing the total volume of dollars available to bid on goods, services, and financial assets at any given moment.
The critical distinction between M1 and M2 is not merely technical. M1 captures dollars available today. M2 captures dollars that could enter the spending economy by the end of the week. For monetary analysis, M2 is the more meaningful figure precisely because it maps the full scale of potential purchasing pressure.
What M2 Reveals That CPI Cannot
Consumer price indices measure the downstream symptom of monetary expansion: the price effects that appear after new money has already circulated through the economy. M2 measures the upstream cause — the volume of dollars being created before those price effects materialise.
This distinction carries significant practical weight. Austrian monetary theory holds that inflation is fundamentally a monetary phenomenon, driven by money supply expansion beyond real economic output, with visible price changes representing its downstream expression [Federal Reserve / academic literature]. Empirically, M2 growth has demonstrated a lag of approximately 12 to 24 months before feeding through to consumer price measures, making it a leading indicator rather than a coincident one.
A Quantitative Record of US M2 Expansion
Historical Timeline: Six and a Half Decades of Monetary Growth
| Period | Approximate M2 Level | Key Driver |
|---|---|---|
| 1959 | Under $300 billion | Post-war economic expansion |
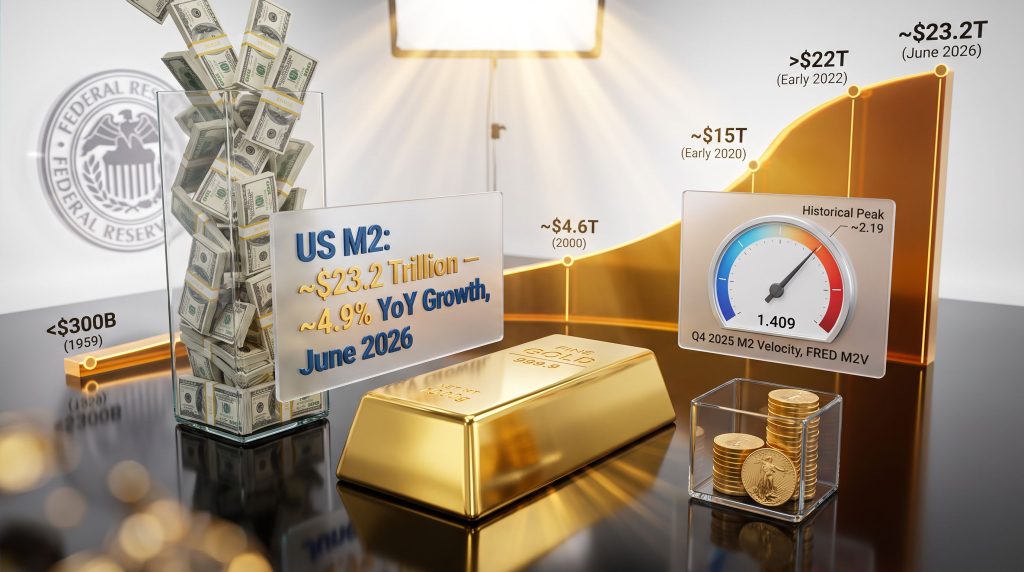
| 2000 | ~$4.6 trillion | Four decades of steady growth |
| Early 2020 | ~$15 trillion | Pre-pandemic baseline |
| Early 2022 | Over $22 trillion | COVID-era fiscal and monetary stimulus |
| 2022–2023 | Modest contraction | Federal Reserve rate tightening cycle |
| June 2026 | ~$23.2 trillion | Post-contraction recovery; ~4.9% year-over-year growth |
Sources: Federal Reserve H.6 Money Stock Measures; Federal Reserve Economic Data (FRED) M2SL series
The historical progression reveals something that isolated data points obscure. US M2 in mid-2026 stands at more than five times its year-2000 level, representing a structural expansion of the money supply that has substantially outpaced real economic growth over the same 26-year period [Federal Reserve/FRED].
The 2020–2022 Expansion: An Unprecedented Compression of Money Creation
To appreciate the scale of recent monetary expansion, the 2020–2022 episode requires specific examination. Congressional authorisation of approximately $2.2 trillion in emergency fiscal spending through the CARES Act in March 2020 combined with Federal Reserve near-zero interest rate policy and large-scale asset purchases. Those bond purchases created new bank reserves that multiplied through the commercial banking system into new deposits, expanding the available monetary pool at a pace without modern precedent.
The result: roughly $7 trillion was added to M2 in approximately 24 months [Federal Reserve/FRED]. For historical context, M2 grew from under $300 billion to $4.6 trillion across the entire 40-year span from 1959 to 2000. The 2020–2022 period consequently compressed what had previously taken multiple generations into two years.
Notable Data Point: The 2022–2023 M2 contraction represented the first year-over-year decline since the Great Depression of the 1930s [FRED M2SL]. Yet even this notable reversal left the monetary system structurally elevated, as the contraction remained modest relative to the preceding expansion.
By June 2026, M2 had recovered to approximately $23.2 trillion, posting roughly 4.9% year-over-year growth according to the Federal Reserve's H.6 release dated July 28, 2026 [Federal Reserve/FRED]. Cumulative M2 growth from early 2020 to mid-2026 stands at approximately 55%, far outpacing real economic output over the same period.
Velocity of Money: The Variable That Explains the Lag
Defining Velocity and Why It Complicates the Simple M2 Narrative
M2 growth does not translate mechanically into immediate consumer price inflation. The relationship requires a second variable: velocity of money, calculated as nominal GDP divided by M2. Velocity measures how frequently each dollar turns over through economic transactions annually. A dollar circulating six times generates six times the economic activity of a dollar held idle in a money market account.
| Period | Approximate M2 Velocity | Context |
|---|---|---|
| Late 1990s (peak) | ~2.19 | Dot-com economic boom; high money circulation |
| Pre-2008 range | ~1.9–2.0 | Pre-financial crisis baseline |
| Post-2008 trend | Declining steadily | Quantitative easing era; money pooling in reserves |
| Q4 2025 | 1.409 | Post-pandemic recovery; well below historical norms |
Source: Federal Reserve Economic Data (FRED) M2V series
US M2 velocity has declined persistently from its historical peak of approximately 2.19 during the late 1990s to 1.409 in the fourth quarter of 2025 [FRED M2V]. This structural decline explains why large M2 expansions following both the 2008 financial crisis and the 2020 pandemic did not immediately produce proportional consumer price increases. Much of the new money accumulated in savings vehicles and bank reserves rather than actively circulating through the economy.
Deferred Risk, Not Eliminated Risk
The critical insight that velocity data can obscure is this: money created during expansionary periods does not disappear when velocity falls. It remains embedded in the monetary system, representing latent purchasing pressure. For instance, the gold safe-haven investment case strengthens considerably when this deferred monetary risk is factored in.
Analytical Framework: M2 growth sets the ceiling of potential inflationary pressure. Velocity determines how quickly that pressure is realised. A low-velocity environment delays the effect; it does not cancel it.
The 2020–2022 dynamic illustrated this precisely. Much of the emergency stimulus money initially pooled in savings rather than circulating. When velocity began recovering through 2021, consumer price inflation accelerated sharply, reaching 9.1% by June 2022, the highest reading in more than four decades [Bureau of Labor Statistics CPI-U]. The money had been in the system the entire time, waiting for the right conditions to express itself as price pressure.
With M2 velocity standing at 1.409 against a pre-2008 historical range of 1.9 to 2.0, the potential for velocity recovery toward historical norms represents a scenario that long-horizon investors would be prudent to consider. If velocity normalises against today's $23.2 trillion M2 base, inflationary pressure could reassert itself with meaningful force in subsequent years.
The M2 and Gold Price Relationship: Empirical Evidence and Structural Logic
The Supply Asymmetry at the Core of Gold's Monetary Role
The relationship between M2 money supply and gold prices rests on a straightforward arithmetic reality rooted in supply growth rates.
-
Gold's above-ground stock grows at approximately 1.8% per year through new mining production [World Gold Council]
-
Geological and operational constraints make rapid supply acceleration structurally impossible: discovery-to-production timelines span 7 to 15 years from initial deposit identification through permitting and construction
-
The US monetary base grew at a compound annual rate of approximately 7.17% between 1917 and 2013 [Federal Reserve Bank of St. Louis historical data]
-
Gold supply grew at approximately 1.52% per year over the same period
The arithmetic implication is direct. When the supply of the measurement unit grows at roughly 7% annually while the measured asset grows at roughly 1.5% annually, the asset's nominal price in that currency should trend structurally higher over time. Gold does not gain intrinsic value in this framework; rather, the dollar progressively loses relative value, and gold's price reflects the dilution of the measuring stick. You can explore this gold vs money supply relationship in greater detail through further analysis.
What the Academic Research Confirms
Engle-Granger cointegration analysis applied to 53 years of data spanning 1970 through 2023 identifies a statistically significant long-run dependency between US M2 and gold prices. Gold prices demonstrate systematic responsiveness to sustained M2 changes across multi-year cycles, confirming a structural rather than coincidental relationship [European Financial and Accounting Journal].
A critical nuance from the same research deserves emphasis: short-run monthly M2 changes explain gold price movements very weakly. Semiannual and annual observation windows are substantially more informative than month-to-month comparisons. This has a direct implication for how investors should interpret M2 data in relation to gold positioning. M2 is a long-horizon structural indicator, not a short-term trading signal.
Multiple Variables Influence Gold Beyond M2 Alone
| Variable | Direction of Influence on Gold | Mechanism |
|---|---|---|
| Real interest rates (rising) | Negative | Increases opportunity cost of holding non-yielding gold |
| US dollar strength | Negative | Gold priced in USD becomes more expensive for foreign buyers |
| M2 growth exceeding real GDP | Positive | Purchasing power erosion drives monetary hedge demand |
| Inflation expectations (rising) | Positive | Forward-looking demand for inflation protection |
| Geopolitical risk | Positive | Safe-haven demand independent of monetary conditions |
| Investment and ETF demand | Amplifying | Institutional flows accelerate price discovery in both directions |
M2 expansion can be partially offset by rising real interest rates or a strengthening dollar in the short run, which is precisely why gold does not respond mechanically to every M2 data release. The long-run cointegrated relationship holds across cycles; however, the short-run relationship is genuinely multi-causal and noisy.
Purchasing Power Erosion: The Mechanism in Detail
How Monetary Debasement Works Step by Step
-
Money supply expands beyond the rate of real goods and services production
-
More dollars compete for the same volume of real economic output
-
Sellers adjust prices upward to equilibrate demand with available supply
-
Each existing dollar represents a smaller proportional claim on real wealth
-
Nominal portfolio values may rise while real purchasing power quietly contracts
Bureau of Labor Statistics CPI-U data documents approximately 97% erosion in the US dollar's purchasing power since the Federal Reserve's establishment in 1913 [BLS CPI-U]. Goods priced at $1.00 in 1913 require approximately $30.00 today. This transformation does not reflect goods becoming more expensive to produce. It reflects the progressive dilution of the monetary unit itself through sustained expansion of money supply across more than a century.
Nominal Returns vs. Real Returns: The M2 Adjustment Framework
Most portfolio monitoring tools display nominal dollar values — an incomplete picture when the dollar itself is being diluted. A complete portfolio assessment requires comparing nominal returns against the rate of monetary expansion, not merely against consumer price indexes. In addition, reviewing a current gold price forecast can help investors contextualise where gold stands relative to these monetary dynamics.
Scenario Analysis: A portfolio generating 8% nominal returns in a year when M2 expanded 10% produced a gain of dollars but a loss of real purchasing power. The account balance denominator increased while the value of each unit in that balance decreased by more. The scoreboard showed a win; the monetary system recorded a loss.
M2 growth rate functions as an implicit hurdle rate for any savings or investment strategy targeting real wealth preservation. Generating nominal returns below the prevailing rate of monetary expansion means running to stand still in real terms, regardless of what the account balance appears to show.
The next major ASX story will hit our subscribers first
The Gold-to-M2 Ratio as a Long-Horizon Valuation Tool
Why Ratio Analysis Matters More Than Nominal Price
The gold-to-M2 ratio compares gold's nominal price against the total M2 money supply, providing a measure of gold's valuation relative to monetary expansion rather than in isolation. Alternatively expressed as M2 per ounce, the metric divides total M2 by estimated above-ground gold supply to derive an implied monetary value per ounce. For a deeper look at historical gold-to-monetary base ratios, long-run charting tools offer valuable perspective.
When the ratio falls — meaning M2 grows faster than gold's nominal price appreciates — gold may be considered undervalued relative to monetary expansion. When the ratio rises, gold's price has outpaced M2 growth and may reflect relative overvaluation against the monetary base.
Historically, extended periods where gold's nominal price lagged M2 growth have preceded significant gold appreciation cycles. The ratio provides a structural valuation lens that nominal price charts cannot offer on their own, grounding gold's price in the monetary context rather than treating it as an isolated commodity. Furthermore, understanding the role of central banks and gold purchasing adds another dimension to this valuation framework.
Frequently Asked Questions: M2 Money Supply and Gold Prices
What is M2 money supply in plain terms?
M2 is the Federal Reserve's broadest practical measure of dollars available for spending in the US economy. It encompasses physical currency, checking and savings deposits, small certificates of deposit under $100,000, and retail money market fund balances. As of June 2026, US M2 totals approximately $23.2 trillion [Federal Reserve H.6; FRED M2SL].
Does M2 growth automatically push gold prices higher?
Not automatically and not immediately. The long-run cointegrated relationship between M2 money supply and gold prices is statistically robust across multi-decade data sets, but short-run monthly correlations are weak. Real interest rates, dollar strength, and investment demand flows can offset M2's upward pressure on gold in the near term. Over multi-year cycles, however, sustained M2 expansion above real GDP growth has historically preceded gold price appreciation [European Financial and Accounting Journal; FRED].
Why did M2 expand so dramatically in 2020 and 2021?
The Federal Reserve's emergency policy response to the COVID-19 pandemic combined near-zero interest rates with large-scale bond purchases, creating new bank reserves that multiplied through the commercial banking system. Simultaneously, approximately $2.2 trillion in congressional fiscal stimulus injected new spending capacity directly into the economy. Combined, these mechanisms expanded M2 by roughly $7 trillion in approximately 24 months [Federal Reserve/FRED].
What is the velocity of money and how does it affect gold?
Velocity measures how frequently each dollar circulates through the economy annually, calculated as nominal GDP divided by M2. US M2 velocity stood at 1.409 in Q4 2025, well below its pre-2008 range of approximately 1.9 to 2.0 [FRED M2V]. Low velocity partially delays M2's inflationary effect. If velocity recovers toward historical norms against today's elevated M2 base, the inflationary pressure embedded in the system could reassert itself — historically a constructive environment for gold.
Has M2 ever contracted in US history?
Yes, but extremely rarely. The 2022–2023 period marked the first year-over-year M2 contraction since the 1930s Great Depression, driven by aggressive Federal Reserve interest rate increases responding to 9.1% CPI inflation in June 2022 [BLS CPI-U]. The contraction was modest relative to the preceding expansion, and M2 resumed growth by mid-2023.
Why does gold supply grow so slowly compared to M2?
Gold's annual supply growth is constrained by geology and operational timelines. New mine production adds approximately 1.8% to the existing above-ground stock each year [World Gold Council]. Bringing a new gold deposit into production requires 7 to 15 years from discovery through permitting and construction. No policy decision can accelerate that timeline. Dollar supply, by contrast, can be expanded through central bank decisions measured in days, creating the structural asymmetry that underpins gold's long-term monetary role.
What the M2-Gold Relationship Means for Long-Horizon Portfolio Strategy
Reframing the Portfolio Question
The most common portfolio assessment question is: how much has my account grown? The more structurally complete question is: has my account grown faster than the monetary unit itself has been diluted?
M2 growth rate functions as a supplementary hurdle rate alongside conventional inflation measures. A strategy targeting real wealth preservation over multi-decade horizons must generate returns that exceed both consumer price inflation and the underlying rate of monetary expansion. Generating strong nominal returns in periods of significant M2 growth can mask real purchasing power losses that only become apparent in retrospect.
The Structural Case for Supply-Constrained Assets
Assets whose supply grows slowly relative to money supply expansion have historically outperformed purely dollar-denominated savings vehicles over multi-decade horizons. Gold's approximately 1.8% annual supply growth against M2's multi-decade average expansion rate creates a persistent supply-demand imbalance measured in dollar terms. Investors weighing their options may also find it useful to compare physical gold vs ETFs as a starting point for practical allocation decisions.
The empirical cointegration research spanning more than half a century confirms this is not a speculative thesis [European Financial and Accounting Journal]. It is a structural observation grounded in the arithmetic of supply growth differentials between a currency capable of rapid policy-driven expansion and a geological resource constrained by decades-long production cycles.
Understanding where M2 money supply and gold prices intersect is not the beginning of a trading strategy. It is, however, the beginning of a fundamentally more complete framework for measuring whether a portfolio is genuinely building real wealth, or simply accumulating a larger number of progressively smaller units.
Disclaimer: This article is for informational and educational purposes only and does not constitute financial or investment advice. All investments, including precious metals, involve risk. Past performance does not guarantee future results. Always consult a qualified financial adviser before making investment decisions.
Want to Know When the Next Major Gold Discovery Hits the ASX?
Discovery Alert's proprietary Discovery IQ model scans ASX announcements in real time, instantly identifying significant mineral discoveries — including gold — and translating complex data into actionable insights for investors at every level. Start your 14-day free trial today, or visit Discovery Alert's dedicated discoveries page to explore how historic mineral discoveries have generated substantial long-run returns.