July 30, 2026
When War Pushes Oil Up but Pulls Gold Down: Understanding the Monetary Transmission Chain
Most investors carry a mental model of gold as a reflex safe-haven asset, one that automatically rises whenever geopolitical tensions flare. That model is incomplete, and the events of July 29, 2026 illustrate precisely why. Understanding why is gold falling when oil rises after the Iran missile attack requires stepping back from the headline and examining the less visible chain of monetary consequences that geopolitical events can set in motion.
The counterintuitive price action that day was not an anomaly or a market malfunction. It was a textbook example of how modern financial markets process conflict through a monetary lens rather than a purely emotional one.
When big ASX news breaks, our subscribers know first
How Geopolitical Events Become Monetary Events
Not every military escalation moves markets the same way. The critical variable is which transmission channel dominates in the hours after the event. A conflict that directly threatens the global banking system activates the systemic risk channel, pushing capital toward gold as a safe haven outside the financial system. A conflict that primarily threatens energy supply activates a different pathway entirely, one that runs through inflation expectations and, ultimately, through interest rate policy.
The Iran situation on July 29, 2026 fell firmly into the second category. Iran's Islamic Revolutionary Guard Corps launched a ballistic missile attack targeting U.S. forces stationed in the Middle East during the overnight hours. U.S. Central Command confirmed the strike and reported that all incoming missiles were successfully intercepted. President Trump subsequently confirmed that a U.S. retaliatory response was coming, publicly stating that Iran would receive a significant military response.
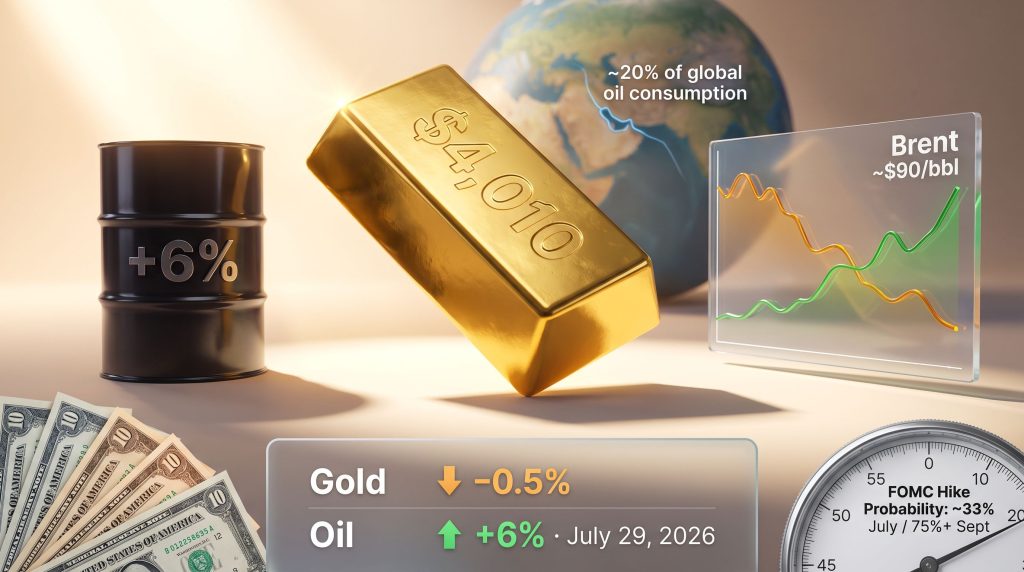
The attack ended a fragile four-day de-escalation period that had already pulled oil prices down by more than 14%. With that ceasefire effectively collapsed, Brent crude surged more than 6% on July 29, 2026, reaching levels near $90 per barrel. Gold, by contrast, was trading near $4,010 and had slipped approximately 0.5% on the day, despite an active and escalating military exchange.
The market's dominant response was not fear. It was inflation arithmetic.
The Three-Stage Transmission Chain Connecting Oil to Gold Weakness
Stage One: Energy Chokepoint Risk and the Hormuz Premium
The Strait of Hormuz is the single most consequential maritime chokepoint in the global energy system. Approximately 20% of all global oil consumption and roughly 25% of all seaborne oil trade passes through this narrow passage between Iran and the Arabian Peninsula. When credible threats emerge against stability in that corridor, crude markets reprice almost immediately.
This instantaneous repricing is what traders call a "geopolitical risk premium," a forward-looking adjustment to crude prices that reflects the probability of supply disruption rather than actual disruption. Even with all missiles intercepted and no infrastructure physically damaged, the mere credibility of further escalation was sufficient to add a meaningful risk premium to every barrel of Brent crude priced on July 29.
Stage Two: Oil as an Inflation Accelerant
The energy sector carries significant weight within the major inflation indexes that central banks monitor. When crude prices spike sharply, the effect flows through to headline CPI and PCE readings within weeks. This transmission effect is amplified by the fact that energy costs are embedded not just in gasoline prices but in transportation, manufacturing, food production, and utilities across the broader economy.
The timing of this particular oil spike made it especially consequential. June CPI had already printed at 3.5% year-over-year, softer than expectations, which had temporarily offered the Federal Reserve some breathing room. A sustained crude rally threatened to reverse that progress and reintroduce upside inflation risk at precisely the moment policymakers were deliberating over their next move.
Stage Three: Rate Expectations as Gold's Real Suppressant
This is where the chain completes itself, and where most casual observers lose the thread. Gold generates no yield. It pays no coupon, no dividend, and no interest. Its appeal as a portfolio holding is therefore highly sensitive to the relative attractiveness of yield-bearing alternatives, particularly U.S. Treasuries. Understanding why rate hike expectations suppress gold is essential to interpreting this kind of market behaviour.
When rate-hike expectations increase, the opportunity cost of holding gold rises in direct proportion. Investors who might otherwise hold physical metal or gold ETFs can instead earn a meaningful return in short-duration government bonds. That reallocation pressure suppresses gold prices even during active geopolitical crises.
As of July 29, 2026, approximately one-in-three market participants were pricing in a 25-basis-point rate hike at that same day's FOMC decision, according to CME FedWatch data. Looking further out, more than three-in-four traders were pricing in at least one hike by September 2026. That forward expectation represented the real and dominant weight on gold.
| Transmission Stage | Market Variable | Direction | Gold Impact |
|---|---|---|---|
| Geopolitical shock | Oil price | Up +6% | Indirect |
| Oil to inflation expectations | CPI/PCE outlook | Higher | Negative |
| Inflation to rate expectations | FOMC hike probability | ~33% July / 75%+ Sept | Negative |
| Higher rates to opportunity cost | Real yield differential | Rising | Directly bearish |
The Dollar's Role: A Second Layer of Suppression
Why Safe-Haven Capital Does Not Always Choose Gold
There is a common assumption that fear-driven capital automatically flows to gold. In practice, during geopolitical escalations that do not threaten the financial system directly, a large portion of safe-haven demand flows first to U.S. dollars and short-duration Treasury securities rather than to gold itself.
This creates a compounding effect on gold prices during military escalation events. A stronger U.S. dollar exerts its own independent downward pressure on gold, because gold is priced globally in USD. When the dollar strengthens, gold becomes more expensive in other currencies, which compresses demand from international buyers and reduces the volume of purchasing that supports the price.
The result is a dynamic that can be described as a double suppression: rising rate expectations reduce gold's yield appeal simultaneously with a stronger dollar reducing its international accessibility. Both forces operated in the same direction on July 29, which explains the scale of gold's weakness relative to what many observers expected from a major military event.
The Historical Weakness of the Gold-Oil Correlation
One of the less-discussed facts in precious metals analysis is that the statistical correlation between gold and oil prices is historically both weak and unstable. The two assets share a broad association with inflation, but their price relationship in any given period depends far more on the monetary policy environment than on the magnitude of any single oil move.
During periods of loose monetary policy and negative real yields, oil and gold can rise together because inflation fears dominate the narrative. During tightening cycles, however, an oil spike can produce the opposite effect on gold, precisely as seen in July 2026, because the rate-hike signal overpowers the inflation-hedge signal.
Reading the FOMC Meeting: Why the Vote Tally Matters More Than the Decision
The July 29, 2026 FOMC meeting carried an unusual degree of market sensitivity. As a non-SEP meeting, no updated Summary of Economic Projections or dot plot was released, making the Fed Chair's press conference the only available mechanism for forward guidance.
For gold holders specifically, the vote tally inside the decision carried more information than the decision itself. A unanimous hold would have communicated committee-wide comfort with the current rate posture. A split decision, particularly with dissents from hawkish regional Fed presidents such as Cleveland's Beth Hammack or Dallas's Lorie Logan, would have signalled that the internal balance of opinion was shifting toward additional tightening, making September a genuinely live meeting.
In Federal Reserve institutional dynamics, dissents function as leading indicators. A dissenting vote at a hold meeting tells the market that at least one committee member judged that conditions already warranted tightening. If that view gains a second or third vote at the next meeting, it becomes policy.
The June PCE Print as the Next Key Catalyst
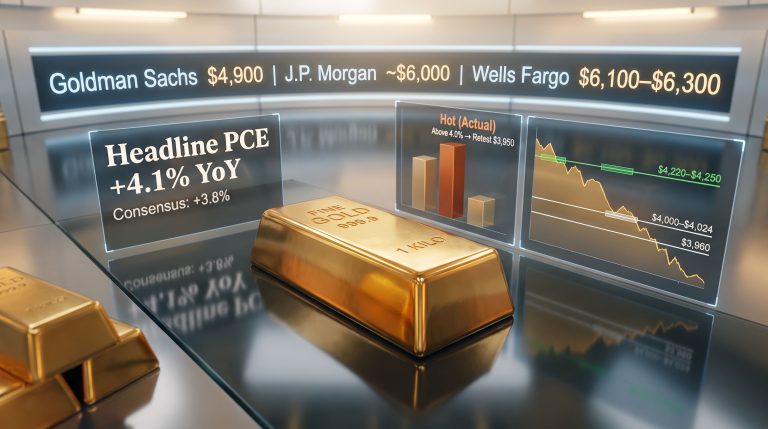
The Bureau of Economic Analysis was scheduled to release June Personal Consumption Expenditures inflation data on July 30, 2026 at 8:30 a.m. ET. PCE is the Federal Reserve's preferred inflation benchmark and carries more direct policy weight than CPI, despite typically running slightly lower due to its broader expenditure coverage and different weighting methodology.
Two scenarios framed gold's immediate directional path:
- Soft PCE print: Reduces near-term rate-hike pressure, compresses the opportunity cost burden on gold, supports a short-term recovery in the price
- Hot PCE print: Validates the oil-driven inflation concern, reinforces September hike expectations, extends gold's near-term weakness and potentially opens another leg lower
The Structural Case for Gold Remains Architecturally Intact
Why Tactical Weakness Does Not Signal a Structural Reversal
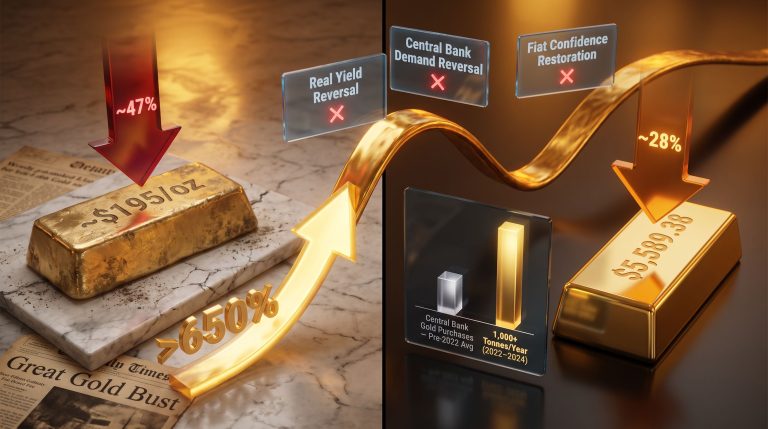
The near-term pressure on gold is real and measurable. However, it is analytically distinct from a change in the structural foundations that drove gold from below $2,000 in early 2024 to a January 2026 high of $5,589.38. That multi-year move was built on sovereign accumulation, reserve diversification mandates, and persistent real yield suppression, none of which respond to a single FOMC vote.
The distinction between tactical and structural demand is critical for investors who misread short-term price weakness as fundamental deterioration.
Central Bank Accumulation as a Rate-Insensitive Demand Floor
The People's Bank of China added to its gold reserves in June 2026, completing its 20th consecutive month of purchases according to World Gold Council data released in July 2026. Central bank gold buying has remained at historically elevated levels since 2022, driven primarily by sovereign institutions seeking to reduce concentration risk in U.S. dollar-denominated reserve assets. This demand layer is structurally durable in a way that speculative futures positioning is not.
Silver's Supply Deficit as a Parallel Structural Signal
Silver's fundamental situation provides an instructive parallel. According to the Silver Institute's World Silver Survey 2026, silver supply deficits are deepening, with the market heading toward its sixth consecutive annual shortfall and demand forecast to exceed supply by 46.3 million ounces in 2026. That cumulative structural imbalance is not resolved by a single rate meeting outcome.
Silver's demand base is architecturally different from gold's, being heavily anchored in industrial applications including solar photovoltaics, electric vehicle components, and advanced electronics manufacturing. This industrial demand floor creates a structural support level that operates independently of monetary policy sentiment.
The next major ASX story will hit our subscribers first
What History Reveals About Gold During Rate Tightening Cycles
The Pattern That Mid-Cycle Corrections Consistently Produce
Examining gold's behavior across previous Federal Reserve tightening cycles reveals a consistent pattern:
- Gold typically experiences tactical weakness during the early-to-mid phase of tightening as real yields rise
- The weakness tends to be most pronounced when rate-hike expectations are accelerating but before they have been fully priced in
- Once markets begin pricing peak rates, gold historically recovers, often sharply, as real yield expectations compress
The most dramatic historical illustration is the 1970s cycle. During the middle of that decade's gold bull market, the metal fell approximately 47% from its interim peak. The investors who sold at that correction point missed a subsequent rally of nearly 8 times from that trough to the January 1980 peak.
Mid-cycle corrections in structural gold bull markets have historically been among the most psychologically demanding periods for investors to navigate, and among the most consequential entry points for those who maintained their conviction.
The Real Yield Formula Every Gold Investor Should Monitor
The relationship between real yields and gold explains price behaviour far more reliably than oil price movements or geopolitical headlines in isolation. Real yield is calculated as follows:
Real Yield = 10-Year Treasury Yield minus Breakeven Inflation Rate
When this figure rises, gold faces structural headwinds because yield-bearing assets become more competitive. When it falls, gold's lack of yield becomes less relevant as a deterrent, and the metal tends to appreciate. Monitoring this single indicator provides more actionable guidance on gold's near-term direction than tracking any individual geopolitical event.
Key Indicators to Watch After an Oil-Driven Geopolitical Shock
| Indicator | Source | Gold Signal |
|---|---|---|
| CME FedWatch hike probability | CME Group | Rising probability = near-term headwind |
| 10-Year Treasury real yield | U.S. Treasury / FRED | Rising real yield = bearish pressure |
| U.S. Dollar Index (DXY) | ICE | Stronger dollar = additional suppression |
| PCE inflation print | Bureau of Economic Analysis | Hot = extends weakness; soft = relief |
| FOMC vote tally | Federal Reserve | Dissents signal hawkish momentum |
| Central bank purchase data | World Gold Council | Structural demand confirmation |
| Brent crude price trend | ICE / Reuters | Sustained high oil = sustained inflation risk |
Frequently Asked Questions: Gold, Oil, and Geopolitical Risk
Why doesn't gold always rise during wars or military conflicts?
Gold's response to conflict depends entirely on which transmission channel dominates. When conflict triggers fears of systemic financial instability, capital flows into gold as an outside-the-system store of value. When conflict primarily raises energy prices and therefore inflation expectations, the resulting rate-hike pressure can outweigh any safe-haven demand and push gold lower. The monetary channel and the safe-haven channel can consequently move in opposite directions, and the dominant one determines gold's price outcome.
What is the Strait of Hormuz and why does it affect oil so sharply?
The Strait of Hormuz is a narrow waterway connecting the Persian Gulf to the Gulf of Oman and the broader global shipping network. Approximately 20% of global oil consumption and 25% of all seaborne oil trade passes through this single passage. Because there is no practical alternative route for most Gulf oil producers, any credible threat to the Strait's navigability commands an immediate risk premium in crude markets, regardless of whether actual disruption has occurred. Furthermore, analysts at CNBC noted that renewed U.S.-Iran hostilities amplified this effect considerably.
How do rate hike expectations suppress gold prices?
The mechanism runs as follows:
- Gold generates no yield, no coupon, and no dividend
- When rate-hike expectations increase, Treasury bonds and money market instruments offer higher returns
- The relative attractiveness of gold decreases as the opportunity cost of holding it rises
- Investors and institutions reallocate away from gold toward yield-bearing alternatives
- Reduced demand puts downward pressure on the gold price
What is PCE and why does the Federal Reserve prefer it over CPI?
Personal Consumption Expenditures is a price index produced by the Bureau of Economic Analysis that measures the prices paid by consumers for goods and services across the broader U.S. economy. The Fed prefers PCE over CPI primarily because it uses a broader expenditure base, adjusts its weights dynamically as consumer behaviour changes, and captures a wider range of healthcare costs. PCE typically runs slightly lower than CPI, but its methodological advantages make it a more accurate representation of consumption-based inflation in the Fed's assessment.
Can gold and oil rise simultaneously?
Yes, and it happens most reliably in stagflationary environments where inflation is rising but economic growth is decelerating. In that scenario, the central bank's ability to hike rates aggressively is constrained by the growth slowdown, which means real yields remain suppressed even as nominal inflation rises. Under those conditions, both gold and oil can appreciate together because the rate-hike signal is weaker than the inflation signal. The July 2026 scenario differed because rate-hike expectations were strong enough to overwhelm the inflation-hedge argument for gold.
The Strategic Takeaway for Precious Metals Investors
The question of why is gold falling when oil rises after the Iran missile attack resolves clearly once the monetary transmission chain is understood. Geopolitical events do not move gold directly. They move oil, oil moves inflation expectations, and inflation expectations move rate policy assumptions, which ultimately determine the opportunity cost of holding a non-yielding asset like gold.
The near-term pressure this creates is real and may persist through the next PCE print and FOMC decision cycle. However, the structural architecture beneath gold — built on sovereign accumulation, reserve diversification, historically elevated central bank buying, and silver's persistent supply deficits — operates on a timeframe that individual rate meetings cannot dismantle.
The same monetary mechanism suppressing gold today has historically been the precondition for gold's most powerful recoveries once the tightening cycle reaches its peak. Tactical weakness and structural bull markets are not mutually exclusive. For investors who understand that distinction, rate-driven corrections represent a different kind of risk than they appear to on the surface.
Readers seeking ongoing analysis of precious metals market dynamics, Federal Reserve policy developments, and global macroeconomic trends can find regular coverage at GoldSilver.com.
Disclaimer: This article is for informational and educational purposes only and does not constitute financial or investment advice. Precious metals investing involves risk, including the potential loss of principal. All forecasts, projections, and scenario analyses represent possible outcomes only and should not be relied upon as predictions of actual results. Always consult a qualified financial adviser before making any investment decisions.
Want to Identify the Next Major ASX Mineral Discovery Before the Broader Market?
Whilst precious metals investors navigate complex monetary transmission chains, Discovery Alert's proprietary Discovery IQ model cuts through the noise by delivering real-time alerts on significant ASX mineral discoveries the moment they are announced — explore historic discoveries and their returns to see what's possible, and begin your 14-day free trial at Discovery Alert to position yourself ahead of the market.