July 30, 2026
June PCE and Gold Price Prediction: Why One Inflation Print Can Matter More Than a Fed Meeting
Markets often obsess over the Federal Reserve's headline decision while missing the transmission mechanism that actually moves gold. For short-term pricing, the more important variable is not always whether policymakers hold or hike on a given day. It is the inflation data that changes the market's expectations for what comes next.
That is the right framework for understanding June PCE and gold price prediction. The Personal Consumption Expenditures price index, or PCE, is the Fed's preferred inflation measure. When it surprises to the upside or downside, traders rapidly recalculate future rate odds, Treasury real yields, and the opportunity cost of owning non-yielding bullion.
In late July 2026, this mechanism mattered more than the already well-telegraphed July Federal Open Market Committee outcome. A hold had largely been reflected in market pricing. The higher-stakes variable was the June PCE release from the Bureau of Economic Analysis, because it had the power to reshape September expectations instead of merely confirming July consensus.
This article is for informational and educational purposes only. It is not financial advice, investment advice, or a recommendation to buy or sell gold, ETFs, futures, or mining equities. Forecasts, scenario analysis, and price ranges are inherently uncertain and may prove wrong.
When big ASX news breaks, our subscribers know first
Why PCE Matters More Than CPI for Gold
The Fed targets inflation using PCE, not the Consumer Price Index. That distinction matters because gold tends to respond most strongly to the data series that policymakers themselves treat as central. Furthermore, understanding this distinction helps investors better interpret how each data release feeds into the broader gold price forecast.
PCE vs CPI: What Are the Key Differences?
PCE and CPI both track inflation, but they are built differently.
- PCE adjusts for substitution effects, meaning it better reflects how consumers shift spending when prices change.
- CPI uses a more fixed basket, so it can be less adaptive in fast-changing spending environments.
- PCE covers a broader spending base, including categories such as employer-paid healthcare that CPI does not fully capture.
- The Federal Reserve's formal 2 percent inflation framework is tied to PCE, making it more relevant for rate expectations.
For gold investors, the practical takeaway is simple: a CPI surprise may get attention, but a PCE surprise often has a more direct path into policy repricing.
The Real Yield Link That Drives Bullion
Gold does not generate income, so its relative appeal changes when real yields move. Real yield is commonly understood as the nominal Treasury yield minus inflation expectations.
Here is the step-by-step chain:
- The PCE number is released.
- Markets update assumptions about future inflation and Fed policy.
- Treasury yields and inflation expectations move, changing real yields.
- Higher real yields raise the opportunity cost of holding gold.
- Lower real yields reduce that cost and can support higher gold prices.
According to analysis derived from World Gold Council data cited in market research, a 25-basis-point shift in real yields has historically corresponded to roughly a $40 to $60 per ounce move in gold in the near term. That is not a law of nature, but it is a useful rule of thumb when modelling tactical price reactions.
What the June 2026 PCE Report Showed
The June 2026 PCE reading came in hotter than many market participants had hoped. However, to understand its full significance, it helps to compare the forecasts against the actual print.
Forecasts vs. Actual PCE Print
| Metric | Consensus Forecast | Bank of America Forecast | Actual |
|---|---|---|---|
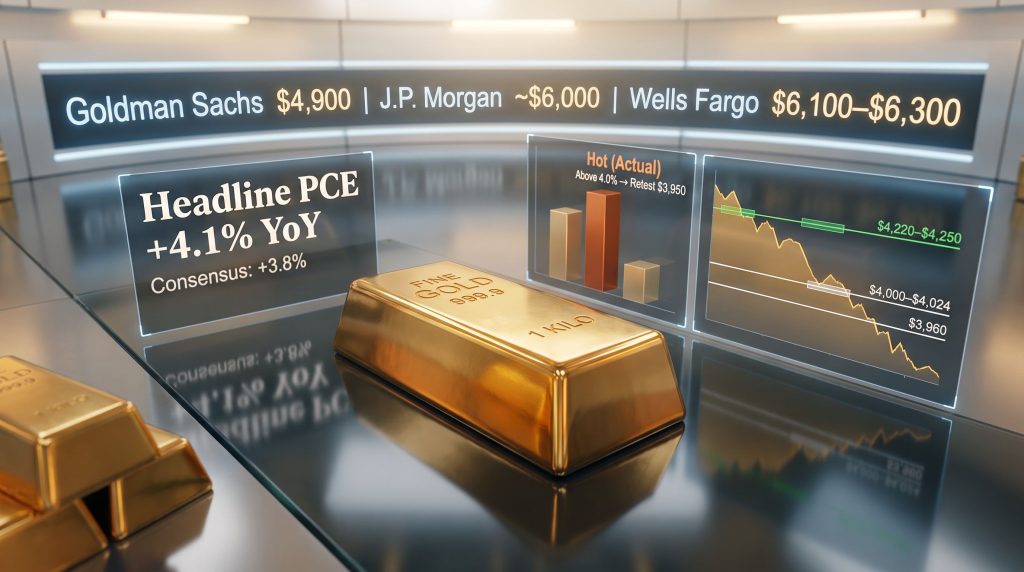
| Headline PCE YoY | 3.8% | 3.70% | 4.1% |
| Headline PCE MoM | 0.04% | -0.05% | Above consensus |
| Core PCE YoY | Around 3.4% | 3.30% | 3.4% |
| Core PCE MoM | Not broadly cited | 0.16% | Not specified here |
The key messages from the release were straightforward:
- Headline PCE at 4.1% year over year was above consensus and above the cited large-bank forecast.
- Core PCE at 3.4% year over year remained materially above the Fed's 2% target.
- The result supported a higher-for-longer interpretation for interest rates.
Interestingly, historical data shows that when PCE has previously printed at 4.1%, gold has not always declined — context around rate expectations and real yields ultimately determines the directional response.
Why the Earlier CPI Reading Did Not Settle the Matter
June CPI had previously shown softer inflation dynamics. The Bureau of Labor Statistics reported 3.5% year-over-year CPI and negative 0.4% month-over-month for June 2026, softer than consensus and the largest monthly CPI decline since April 2020.
That encouraged some traders to expect a softer PCE print. However, CPI and PCE do not move in lockstep. Important differences include:
- weighting methodology
- category coverage
- healthcare treatment
- timing and revision patterns
So while softer CPI increased the probability of a softer PCE print, it did not guarantee one. The hotter June PCE result was a reminder that gold traders need to watch the Fed's preferred gauge, not just the most popular inflation headline.
Why the July Fed Decision Was Secondary
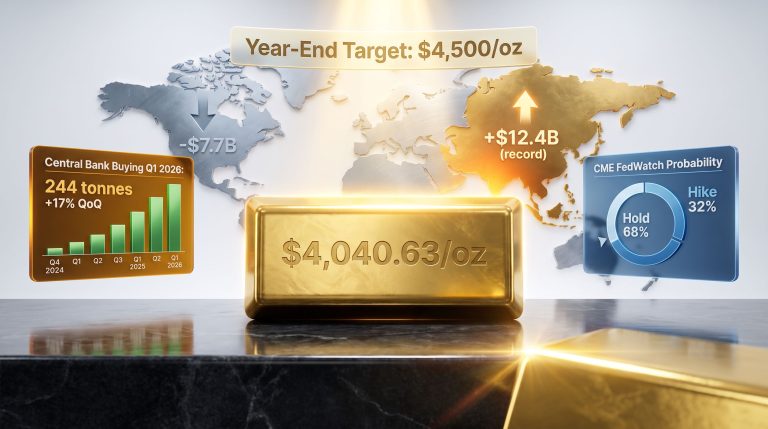
Ahead of the July 29, 2026 FOMC decision, markets assigned roughly a 70% probability to a hold, according to CME FedWatch data cited for that date. Gold, trading near $4,013, had already spent weeks around the $4,000 area.
That tells you something important about market psychology:
- a widely expected hold offers limited incremental information
- a surprise data point can create the larger repricing event
- what matters most is often the next meeting, not the current one
The more consequential question was September. CME FedWatch probabilities cited in the research showed a 76% chance of a September hike before the June PCE release. At the June 2026 FOMC meeting, 9 of 18 officials who submitted projections still expected at least one additional increase by year-end, according to the Federal Reserve's Summary of Economic Projections dated June 17, 2026.
A further wrinkle added uncertainty. The research cited that Fed Chair Warsh did not submit a rate projection, described as the first such omission by a Fed chair since the dot plot framework began in 2012. In a narrowly divided committee, one inflation data point can carry extra weight because it may influence internal voting balance rather than just public messaging.
When the committee is close to split, markets stop focusing on the headline decision and start focusing on the data most likely to shift the next vote count.
Three Scenarios for June PCE and Gold Price Prediction
Scenario modelling is useful because it separates narrative from mechanism. Instead of guessing direction emotionally, it links inflation outcomes to rate odds, then to real yields, and finally to gold price zones.
Scenario Table
| Scenario | PCE Headline Outcome | September Hike Odds | Real Yield Effect | Likely Gold Reaction | Price Zone |
|---|---|---|---|---|---|
| Soft | Below 3.6% or negative monthly reading | Falls below 60% | Compresses 15 to 25 bps | Relief rally | $4,100 to $4,160 |
| In-line | 3.7% to 3.9% | Holds near 76% | Range-bound | Continued consolidation | $3,960 to $4,080 |
| Hot | Above 4.0% or monthly above 0.20% | Rises toward 85%+ | Increases | Downside pressure | Retest $3,950 or lower |
Scenario 1: Soft Print
A softer-than-expected inflation number would likely have reduced September hike expectations and eased real yields. In that setting, gold could have rebounded by $60 to $150 per ounce, with $4,100 to $4,160 as a plausible recovery band. This would have been the cleanest upside breakout case for gold bulls.
Scenario 2: In-Line Print
If PCE had landed close to consensus, the market would have learned very little new information. September odds likely would have stayed around current pricing, keeping real yields in a holding pattern and gold inside a broad $3,960 to $4,080 range.
Scenario 3: Hot Print
This is the scenario that materialised. With headline PCE at 4.1%, the inflation data reinforced the possibility of a further hike and kept pressure on real yields. In that backdrop, gold faced increased risk of testing $3,950 or below in the near term.
Key Technical Levels for Gold After the PCE Release
For traders and long-term allocators alike, technical price zones help frame risk. In addition, these levels become increasingly relevant when combined with the broader considerations around gold as a safe haven during periods of elevated inflation uncertainty.
Support and Resistance Levels
| Level Type | Zone |
|---|---|
| Immediate support | $4,000 to $4,024 |
| Broader support | $3,960 to $4,050 |
| Near-term resistance | $4,220 to $4,250 |
| Secondary resistance | $4,370 to $4,460 |
| Institutional marker | $4,400 |
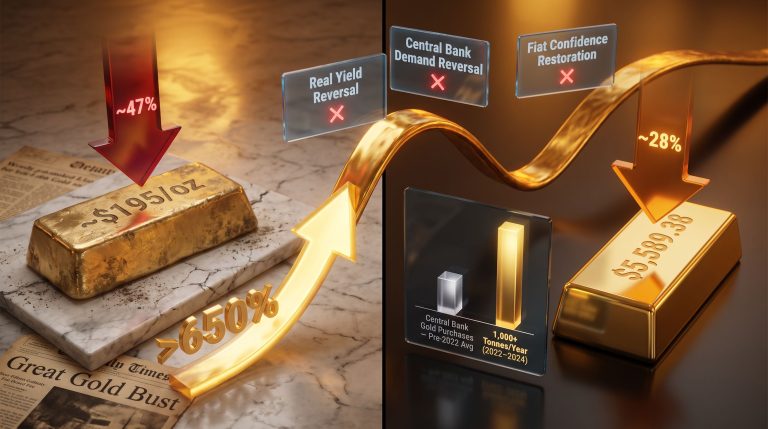
Gold near $4,013 also represented a substantial decline from its reported all-time high of $5,589.38 on January 28, 2026, a drawdown of roughly 28% based on cited World Gold Council data and market price references.
That sounds dramatic, but context matters. Gold has historically experienced sizable corrections during aggressive tightening phases because higher real yields reduce speculative urgency and increase the attractiveness of yield-bearing assets. For tactical investors, the $3,960 to $4,050 corridor remains especially important because it sits at the intersection of psychological support and scenario-based valuation pressure.
The next major ASX story will hit our subscribers first
Bull, Base, and Bear Cases Across Time Horizons
One-Week Outlook
- Bear case: Hot PCE keeps September hike odds elevated and gold probes $3,950 to $3,960.
- Base case: The market absorbs the inflation surprise without panic and gold churns between $3,960 and $4,050.
- Bull case: Subsequent Fed communication softens the hawkish interpretation and gold stabilises above $4,000.
One-Month Outlook
- Bear case: September hike odds remain near 85%, capping gold below $4,100.
- Base case: Mixed macro data tempers the inflation scare, allowing trade between $4,000 and $4,150.
- Bull case: Follow-up disinflation data begins to reverse the rate narrative, opening room toward $4,220.
Three-Month Outlook
- Bear case: A September hike is delivered and real yields jump, pulling gold toward $3,800 to $3,900.
- Base case: The Fed holds in September but stays hawkish, leaving gold oscillating between $4,000 and $4,250.
- Bull case: Inflation clearly rolls over, hike expectations fade, and gold challenges $4,400 to $4,460.
These are scenario ranges, not certainties. Market pricing can also be influenced by geopolitical shocks, currency volatility, ETF flows, options positioning, and central bank activity. Notably, the gold-silver ratio can also shift meaningfully during these repricing episodes, offering additional signals about broader precious metals sentiment.
The Structural Gold Thesis Has Not Been Invalidated
Short-term pressure from PCE does not automatically break the long-term case for gold. Several structural drivers remain relevant:
- US federal debt above $39 trillion
- Annual US interest costs above $1 trillion
- Global central bank gold purchases of 244 tonnes in Q1 2026 alone, according to World Gold Council Gold Demand Trends
- Ongoing reserve diversification by official sector buyers
That last point is particularly important. Central bank gold demand is not driven by the same motivations as retail momentum trading. It reflects reserve management, currency allocation strategy, and long-duration confidence in gold as a monetary asset.
One inflation release can alter the timing of a trade, but it does not resolve fiscal burden, sovereign debt risk, or reserve diversification trends.
For physical metal holders, this means the June PCE print changed the near-term pressure profile, not necessarily the broader thesis. Furthermore, for investors weighing their options, understanding the distinction between physical gold vs ETFs can meaningfully affect how short-term volatility is experienced in a portfolio.
Institutional Gold Targets for 2026
Despite near-term rate pressure, some major institutions maintained significantly higher year-end forecasts.
| Institution | 2026 Year-End Gold Target |
|---|---|
| Goldman Sachs | $4,900 |
| J.P. Morgan | Around $6,000 |
| Wells Fargo | $6,100 to $6,300 |
These targets should not be treated as promises. They reflect long-range assumptions about inflation, policy, macro instability, and investor demand. Consequently, the gap between spot near $4,013 and these projections shows that many long-horizon views remained constructive even after a hot PCE print. J.P. Morgan's commodity research provides additional context on the structural factors underpinning such elevated institutional targets.
Frequently Asked Questions About June PCE and Gold Price Prediction
What Was the June 2026 PCE Inflation Rate?
Headline PCE printed at 4.1% year over year, above the 3.8% consensus and above the cited 3.70% Bank of America forecast. Core PCE was 3.4% year over year.
Why Does PCE Matter So Much for Gold?
Because the Fed uses PCE as its preferred inflation benchmark. That makes it more influential for future rate expectations, which affect real yields and therefore gold pricing.
What Does a Hot PCE Print Usually Mean for Gold?
A hotter PCE reading tends to push rate-hike expectations up, lift real yields, and create near-term downside pressure for non-yielding assets like gold.
What Levels Matter Most After This Release?
The main support zones are $4,000 to $4,024 and then $3,960. Resistance sits around $4,220 to $4,250, with a broader ceiling at $4,370 to $4,460.
Is the Long-Term Gold Thesis Broken?
Not necessarily. A strong inflation print can hurt gold tactically, but structural support from debt dynamics, central bank accumulation, and long-term currency concerns remains relevant.
Final Takeaway
The clearest conclusion from June PCE and gold price prediction is that inflation data can matter more than a well-anticipated Fed announcement when it changes the expected path of future policy.
June 2026 headline PCE at 4.1% came in hotter than expected, reinforcing the case for elevated September hike odds and sustained real yield pressure. That helps explain why gold remained vulnerable near the $4,000 level despite a broader long-term bullish narrative.
In the short run, markets should focus on whether incoming data keeps September tightening risk elevated or begins to unwind it. In the bigger picture, gold remains tied not only to inflation and rates, but also to sovereign debt, official-sector demand, and investor confidence in fiat stability.
For now, the tactical battleground appears clear: monitor inflation, watch real yields, and keep a close eye on the $3,960 to $4,050 support band as the next major test of conviction.
Want to Know When the Next Major Mineral Discovery Hits the ASX?
While macro forces like PCE and real yields shape gold's short-term price action, some of the most significant wealth-creation opportunities in precious and base metals come from ground-level discoveries — and Discovery Alert's proprietary Discovery IQ model delivers real-time alerts the moment significant ASX mineral discoveries are announced, turning complex data across 30+ commodities into clear, actionable insights. Explore why historic discoveries have generated extraordinary returns and begin your 14-day free trial today to position yourself ahead of the broader market.