May 16, 2026
Gold Falls Toward $4,550 as Fed-Cut Hopes Fade: Four Forces Behind the Selloff
Precious metals markets have always operated at the intersection of competing forces: inflation expectations, monetary policy trajectories, geopolitical volatility, and institutional flow dynamics. When those forces align in the same direction, the result is rarely subtle. The week ending May 16, 2026 offered a textbook example of multi-variable convergence working against bullion, with gold falls toward 4550 as fed-cut hopes fade across trading desks globally. Understanding why this happened, and what it means for the weeks ahead, requires looking beyond the surface-level price action to the underlying mechanisms driving each wave of selling.
When big ASX news breaks, our subscribers know first
The Architecture of Gold's Decline: Why $4,550 Matters
Not all price levels carry equal weight in financial markets. Round numbers and recently contested zones function as psychological anchors, drawing institutional order clustering and triggering algorithmic responses when breached. The $4,550/oz level is not arbitrary. It represents a zone where prior buying pressure has materialised and where short-term traders expect to find support after a week of sustained deterioration.
The table below maps the key price zones that defined this week's trading landscape:
| Price Level | Strategic Significance |
|---|---|
| $4,725/oz | Prior consolidation ceiling, failed to hold entering the week |
| $4,650/oz | Mid-week intraday support, briefly tested before giving way |
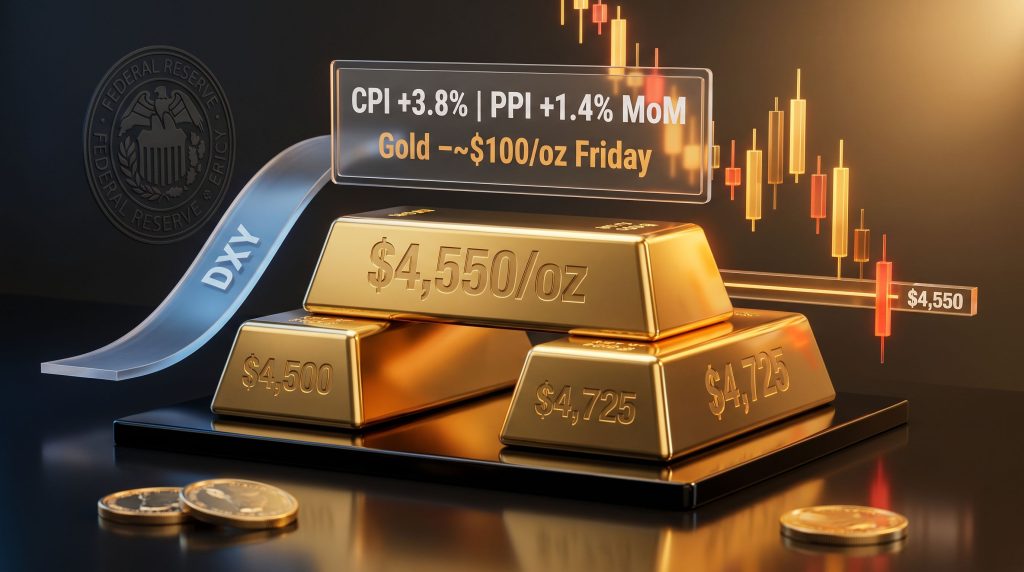
| $4,550/oz | Weekly close target, current psychological floor |
| $4,500/oz | Major structural support, defended by buyers in prior weeks |
The roughly $175/oz decline across the week, including a dramatic $100/oz single-session drop on Friday, is jarring in isolation. However, context matters enormously. Gold has appreciated approximately 47 to 48% on an annual basis heading into mid-May 2026, meaning the current corrective phase represents a consolidation within a still-dominant longer-term uptrend rather than a structural breakdown. Whether it remains a correction or evolves into something more serious depends entirely on the forces described below.
A weekly decline of this magnitude, while sharp, does not automatically signal that gold's multi-year bull market has ended. The relevant question is whether the macro forces driving this selloff represent a temporary repricing or a durable regime shift in monetary policy expectations.
Force One: Inflation Data That Inverted Gold's Traditional Logic
Why Hotter Prices Are Currently Bearish for Bullion
Gold's reputation as an inflation hedge is one of the most widely cited arguments for owning the metal. The paradox playing out in 2026, however, is that hotter inflation readings are actually triggering gold selling, not buying. To understand why, it is essential to grasp the transmission mechanism that dominates current market psychology.
The sequence works as follows:
- Above-consensus inflation data is published
- Markets reduce the probability of near-term Federal Reserve rate cuts
- The US Dollar Index strengthens as rate differentials favour dollar-denominated assets
- Treasury yields rise, increasing the opportunity cost of holding non-yielding gold
- Institutional and algorithmic selling pressure intensifies across gold markets
This week's CPI release on Tuesday confirmed the pattern. Consumer prices rose at an annualised rate of +3.8%, exceeding consensus expectations, while core CPI, which strips out volatile food and energy components, came in at +2.8% year-over-year, also above projections. The elevated headline reading partly reflects the upward pressure on energy costs stemming from the ongoing US-Israel conflict with Iran and disruptions to shipping through the Strait of Hormuz, now in its third month of closure-related complications.
The following morning delivered an even more jarring shock through the Producer Price Index. Manufacturing cost inflation, which historically leads consumer price trends by several months due to supply chain pass-through dynamics, came in at levels that significantly exceeded Wall Street forecasts. Furthermore, as gold falls on firm dollar pressures intensify, the combined effect on bullion valuations becomes increasingly difficult to absorb:
| Indicator | Actual | Consensus Estimate | Variance |
|---|---|---|---|
| Headline CPI (YoY) | +3.8% | Below 3.8% | Upside surprise |
| Core CPI (YoY) | +2.8% | Below 2.8% | Upside surprise |
| Overall PPI (MoM) | +1.4% | +0.5% | +0.9 percentage points above forecast |
| Core PPI (MoM) | +1.0% | +0.3% | +0.7 percentage points above forecast |
The PPI reading is particularly significant from a forward-looking perspective. When producers face cost inflation running at nearly triple consensus estimates on a month-over-month basis, those pressures tend to filter through to consumer prices over the subsequent two to three quarters. Markets absorbed this as a signal that inflation is not cooling on a trajectory consistent with near-term rate cuts, and repriced accordingly.
The Rate-Cut Repricing in Practice
Prior to these inflation prints, market positioning reflected expectations of one to two Federal Reserve rate cuts in 2026, with some probability assigned to a first reduction arriving in the first half of the year. The post-data repricing has been significant. In addition, the broader gold market outlook now points to a more prolonged period of monetary tightening than many investors had anticipated:
| Prior Expectation | Revised Expectation Post-Data |
|---|---|
| Two cuts in 2026 | Repriced to one cut |
| One cut in 2026 | Repriced to zero cuts |
| First cut in H1 2026 | Pushed to H2 2026 at the earliest |
This repricing compressed gold valuations directly while simultaneously amplifying dollar strength and yield appreciation, creating a compounding headwind that overwhelmed safe-haven buying interest for most of the week.
Force Two: The Warsh Confirmation and What It Signals for Monetary Policy
A Hawkish Leadership Transition at the Fed
The inflationary data shock was significant on its own. What elevated it into a more structurally consequential event was the US Senate's confirmation of Kevin Warsh as the incoming Federal Reserve Chair, effective Friday, May 16, 2026. Warsh is broadly perceived by markets as a more hawkish monetary policy leader, meaning one who is less inclined to ease financial conditions prematurely and more attentive to inflation persistence as a primary risk.
The political paradox here is notable. An administration that has publicly and repeatedly advocated for lower interest rates nominated a central banker widely regarded as resistant to rushing rate cuts. For gold traders, the implication is straightforward: the probability of near-term monetary easing has declined, and the optionality for rate increases has returned to the analytical framework, even if it remains a tail scenario.
What is particularly instructive about market behaviour this week is the timing of the price response. Rather than reacting to the Senate confirmation vote earlier in the week, gold's sharpest single-day decline of approximately $100/oz occurred on Friday, the actual date of Warsh's formal installation. This pattern of delayed price discovery, where markets wait for an event's operational trigger rather than its announcement, reflects a form of institutional discipline in pricing certainty rather than probability.
Upcoming Fed speaker appearances and Q&A sessions where Warsh is expected to be a central topic will be closely parsed for signals about the new Chair's policy priorities and rate path preferences. Consequently, understanding gold and bonds dynamics through shifting economic cycles becomes ever more relevant to interpreting these policy signals accurately.
Force Three: Geopolitical Risk Premium Erosion
When Wars Become Background Noise
One of the more psychologically complex dynamics in financial markets involves how investors price geopolitical risk over time. When a conflict first erupts, the uncertainty premium is high because outcomes are genuinely unknown. As a conflict persists and its market impacts become semi-predictable, that premium tends to compress systematically, regardless of whether the underlying situation has improved.
The US-Israel conflict with Iran entered its third month during the week of May 12 to 16, 2026. The Strait of Hormuz disruption continues to exert upward pressure on energy prices, which is visible in the headline CPI overshoot. Yet despite these ongoing impacts on global trade and commodity markets, gold's sensitivity to the conflict as a safe-haven trigger appears to have diminished materially compared to the first month of hostilities.
When geopolitical events evolve from acute, high-uncertainty shocks into prolonged, semi-predictable conflicts, financial markets systematically reduce the risk premium embedded in safe-haven assets. This is not a rational judgment about the conflict's severity, but rather a function of how uncertainty, rather than danger itself, drives safe-haven demand.
This erosion of geopolitical risk premium removes a structural support layer that had previously cushioned gold against macro headwinds. For the near term, only a significant and unexpected escalation in the Iran conflict would likely restore that premium at levels sufficient to offset the rate-policy headwinds. Furthermore, gold as a safe haven continues to face evolving pressures as market dynamics shift throughout 2026.
Force Four: Institutional Flow Divergence and the Central Bank Tug-of-War
Structural Buyers vs. Tactical Sellers
The demand picture for gold in 2026 is more nuanced than a simple bullish or bearish narrative suggests. Q1 2026 central bank reserve reporting confirmed an aggressive acceleration in gold accumulation by developing-world central banks, continuing a multi-year trend of reserve diversification away from US dollar-denominated assets. This structural demand provides a persistent floor under the gold market and remains one of the most credible long-term bullish arguments for the metal.
However, this foundational buying is being partially countered by a countervailing trend at the institutional level. In addition, central bank demand has been a key driver boosting gold performance, yet the current environment is testing even that structural support:
| Flow Category | Direction | Near-Term Price Impact |
|---|---|---|
| Developing-world central bank reserves | Increasing aggressively | Structural support |
| Institutional physical gold holdings | Decreasing via liquidation | Near-term headwind |
| Retail safe-haven demand | Moderating | Neutral to slightly negative |
| ETF flows | Mixed | Directionally uncertain |
The institutional liquidation dynamic is particularly interesting. As Treasury yields rise and short-duration fixed income becomes more attractive on a risk-adjusted basis, institutions that built gold positions as a yield-environment hedge are rotating back into cash and fixed income instruments. This is not a panic-driven selloff but rather a rational portfolio reallocation in response to a shifting opportunity cost calculus.
The net effect is that central bank buying provides a structural demand floor that prevents a disorderly collapse, but the ceiling on near-term price recovery is being actively compressed by institutional outflows. Gold is consequently caught between two powerful forces operating on different time horizons.
The next major ASX story will hit our subscribers first
Scenario Modelling: What Happens Next?
Four Pathways for Gold in the Weeks Ahead
Given the confluence of forces described above, four distinct scenarios are worth modelling for the period following the week of May 16, 2026:
-
Scenario A (Bullish Recovery): Subsequent CPI and PPI readings cool materially over the next two to three months, rate-cut expectations recover, and the dollar weakens. Gold rebounds from $4,500 to $4,550 support and resumes its uptrend.
-
Scenario B (Sustained Pressure): Inflation remains sticky above 3%, the Fed holds or discusses tightening, and the dollar continues to strengthen. Gold faces persistent downward pressure with $4,500 at risk of being tested decisively.
-
Scenario C (Geopolitical Spike): A significant and unexpected escalation in the Iran conflict triggers a genuine risk-off event. Gold rallies sharply on safe-haven demand regardless of the monetary policy backdrop.
-
Scenario D (Stagflation Ambiguity): The labour market weakens sharply while inflation remains elevated, creating a stagflationary backdrop. Gold's response to stagflation is historically supportive, but the near-term transmission is ambiguous given current market psychology.
The most probable near-term outcome, given the balance of forces, is a consolidation range between $4,500 and $4,650, with directional resolution dependent on the next round of inflation data and any policy signals from Warsh's initial public appearances as Fed Chair. For broader context on how analysts are positioning, expert gold price forecasts for 2025 and beyond offer valuable analytical frameworks worth considering.
Key Variables to Monitor Through Late May 2026
For traders and investors navigating this environment, the following data points and events carry the highest signal value:
- Fed speaker appearances: Any hawkish commentary amplifies selling pressure; unexpectedly dovish language could provide short-term relief
- Kevin Warsh's initial policy communications: Markets will be highly sensitive to any concrete signals about his rate path preferences
- US Dollar Index (DXY) trajectory: Sustained strength above recent highs confirms a continued headwind for gold
- 10-year Treasury yield: Functions as a real-time gauge of rate expectations and gold's opportunity cost
- Iran conflict developments: Escalation or de-escalation could rapidly shift the geopolitical risk premium
- ETF flow data and institutional liquidation signals: Accelerating outflows would compound the bearish pressure from monetary policy repricing
Quick Reference FAQ
Why is gold falling when inflation is rising?
In the current cycle, the dominant market force is not inflation itself but the expectation that persistent inflation will prevent the Fed from cutting rates. Rising rate expectations strengthen the dollar and Treasury yields, both of which create mechanical headwinds for non-yielding assets like gold. As hawkish Fed comments continue to influence market sentiment, this dynamic is likely to persist in the near term.
What makes $4,500 significant?
It represents a major psychological support threshold that buyers have defended in prior weeks. A decisive and sustained break below this level would signal a potentially more serious corrective phase and could trigger further algorithmic selling responses.
Are central banks still buying gold?
Yes, and aggressively. Q1 2026 central bank data confirmed accelerating gold reserve accumulation among developing-world central banks. This structural demand provides a floor, even as institutional liquidation creates near-term selling pressure from the other direction.
What would signal that the pullback has ended?
Watch for softer CPI and PPI readings in subsequent months, a reversal in the US Dollar Index, declining Treasury yields, or a significant geopolitical escalation that triggers fresh safe-haven demand at scale. These remain the four clearest indicators that gold falls toward 4550 as fed-cut hopes fade may represent the bottom of this corrective phase.
Disclaimer: This article is for informational purposes only and does not constitute financial advice. All price levels, scenario projections, and analytical frameworks represent forward-looking assessments subject to significant uncertainty. Past performance of gold or any asset class does not guarantee future results. Readers should conduct independent research and consult qualified financial advisors before making investment decisions. Live spot prices, historical closes, and multi-currency gold benchmarks are available at GoldPrice.org.
Want To Stay Ahead of the Next Major ASX Mineral Discovery?
Discovery Alert's proprietary Discovery IQ model delivers real-time alerts on significant ASX mineral discoveries, transforming complex mineral data into clear, actionable insights for traders and investors at every level. Explore how historic discoveries have generated substantial returns on Discovery Alert's dedicated discoveries page, and begin your 14-day free trial today to position yourself ahead of the broader market.