June 19, 2026
The Mechanics Behind Gold's Vulnerability to a Rising Dollar
Commodity markets operate within a web of interconnected forces, and few relationships are as structurally reliable as the inverse correlation between the US dollar and gold prices. When the dollar strengthens against a basket of major currencies, the purchasing power of international buyers effectively shrinks in real terms. A Chinese importer, an Indian jeweller, or a European central bank all face the same arithmetic: a stronger dollar means their local currency buys less gold per ounce. This is not a sentiment-driven dynamic. It is a mechanical repricing event that plays out across every major physical gold market simultaneously.
Understanding this mechanism is essential context for what is unfolding in mid-2026. The phrase gold falls as dollar hits 13-month high has become the defining headline of a corrective phase that began in late February and has since erased nearly a quarter of gold's value from its peak. The forces behind this move are not new, but their persistence and convergence have created an unusually difficult environment for bullion investors. For further context on where prices may be headed, the current gold price forecast from analysts offers valuable perspective.
When big ASX news breaks, our subscribers know first
Gold Price Performance: Mapping the 2026 Correction
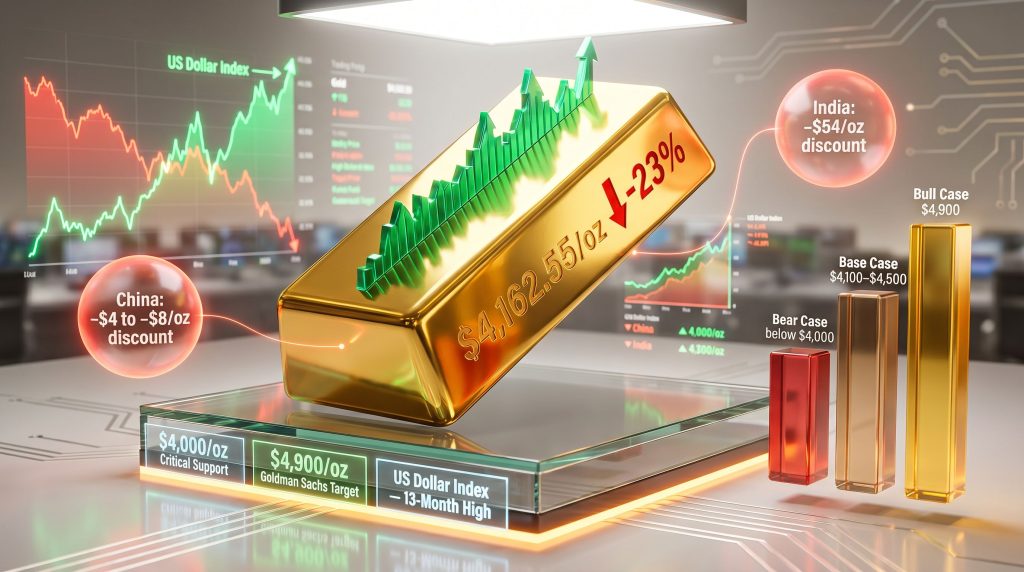
The scale of gold's decline becomes clearer when the data is laid out directly. As of June 19, 2026, spot gold was trading at $4,162.55 per ounce, representing a daily decline of 1.13%. US gold futures settled at $4,192.80/oz, reflecting a slightly higher level due to time-value adjustments in the futures market.
| Metric | Value |
|---|---|
| Spot Gold Price (June 19, 2026) | $4,162.55/oz |
| Daily Decline (June 19) | -1.13% |
| Daily Decline (June 18) | -0.97% |
| US Gold Futures (June 19) | $4,192.80/oz |
| Peak-to-Trough Decline Since February | -23% |
| 200-Day Moving Average Status | Below (since June 5) |
| Goldman Sachs December 2026 Target | $4,900/oz (revised down from $5,400/oz) |
| Key Technical Support Level | $4,000/oz |
This is the third consecutive weekly decline, and gold has remained below its 200-day moving average since June 5. Among institutional traders, the 200-day moving average carries significant weight as a long-term trend filter. Its failure to recapture this level is not interpreted as a short-term blip but as confirmation that selling momentum has a structural character to it.
What the 200-Day Moving Average Failure Signals
- A sustained breach below the 200-day moving average typically triggers algorithmic selling programmes designed to exit long positions in downtrending assets
- Institutional risk models often use this level to reduce exposure, amplifying rather than absorbing the directional move
- The longer gold remains below this level, the harder it becomes to attract fresh institutional capital on the long side
- Three consecutive weekly declines since the breach reinforce the validity of the downtrend signal
A confirmed close below $4,000/oz would represent a further approximate 4% decline from current levels and would likely activate additional stop-loss selling across futures and ETF markets.
Three Structural Forces Weighing on Gold in 2026
1. A 13-Month Dollar High Compresses International Demand
The US Dollar Index reaching its highest level in 13 months is the primary mechanical driver of gold's current weakness. For buyers in Asia, which collectively represent the largest source of physical gold consumption globally, a stronger dollar translates directly into higher local-currency prices even when the dollar-denominated spot price is falling. This creates a peculiar trap: gold can be declining in USD terms and still feel expensive to the buyers who matter most.
China and India together account for the majority of the world's annual physical gold consumption. When dollar strength simultaneously raises effective import costs in both markets, the global demand floor weakens significantly. Furthermore, central bank gold demand has also shown signs of moderation, removing another traditional source of price support during such corrections.
2. Federal Reserve Policy and the Opportunity Cost Equation
Monetary policy is functioning as an amplifier of the dollar's strength. Currently, 9 of 19 Federal Reserve policymakers have projected at least one rate hike from the existing 3.50% to 3.75% target range during 2026. The market has translated this into a 70% probability of a September rate hike, based on CME FedWatch data.
Fed Chair Kevin Warsh has made it clear that containing inflation remains the priority over supporting near-term economic growth. Rising policy rates have two compounding effects on gold:
- They strengthen the dollar by attracting yield-seeking capital into US assets
- They raise the opportunity cost of holding gold, since bullion generates no income whatsoever
Market analysts at Tradu.com have highlighted that assets producing zero income become structurally less competitive when Treasury bills are yielding between 5.0% and 5.5% on a risk-free basis. An investor choosing between a three-month T-bill and an ounce of gold must believe gold will appreciate by at least that amount just to break even on a relative basis. According to live gold price data, this divergence in return profiles has been a persistent theme throughout the current corrective period.
3. Geopolitical Risk Premium Collapse
Perhaps the most revealing aspect of this correction is what has not happened. The cancellation of US-Iran peace talks in Switzerland, following the withdrawal of Vice President JD Vance from the negotiations, produced no meaningful safe-haven buying response in gold markets. This is a notable behavioural shift.
Historically, a collapse in diplomatic talks during a period of Middle East tension would reliably push gold higher as investors sought refuge in hard assets. However, the absence of that response in June 2026 signals that macro monetary forces are currently overriding the geopolitical risk premium. The diminishing gold safe-haven appeal during this episode reflects just how dominant the monetary headwinds have become. When monetary headwinds are strong enough, even genuine geopolitical deterioration fails to produce a lasting bid in bullion.
The 2026 gold correction illustrates a critical market dynamic: monetary policy transmission mechanisms can overwhelm geopolitical risk premiums when those monetary forces are sufficiently dominant and persistent.
Physical Gold Demand Collapse: China and India in Focus
China's Market Pivots From Premium to Discount
The shift in China's gold market structure within a single week illustrates just how quickly sentiment can deteriorate. Chinese buyers moved from paying a $1 to $5 per ounce premium over the global benchmark to accepting a $4 to $8 per ounce discount. This reversal is not a minor pricing fluctuation. It reflects a fundamental withdrawal of buying interest from the world's largest physical gold consumer.
Peter Fung, Head of Dealing at Wing Fung Precious Metals, has characterised the Shanghai gold market as being in a cautious holding pattern, with participants waiting for geopolitical and monetary clarity before recommitting capital. This wait-and-see dynamic among professional dealers is significant because it removes a layer of natural price support that would normally absorb selling pressure.
India: Discounts Widen and ETF Flows Reverse
India's physical gold market is sending equally bearish signals. Dealer discounts widened to $54 per ounce as domestic gold prices fell to 146,252 rupees per 10 grams. More significantly, physically-backed gold ETFs in India recorded their first monthly outflow in over 12 months, marking a meaningful shift in retail and institutional sentiment.
For investors weighing their options, the ongoing debate between physical gold vs ETFs has become increasingly relevant as outflows from both categories accelerate. Feedback from the Ahmedabad jewellery trade suggests a paradoxical situation: while lower absolute prices are attracting some buyers, the sheer magnitude and velocity of price swings is causing a larger cohort of price-sensitive consumers to defer purchases entirely.
The Self-Reinforcing Demand Vacuum
This buyer psychology creates a feedback loop that is poorly understood outside physical commodity markets:
- Sharp price declines do not automatically stimulate physical buying
- Buyers interpret rapid price falls as a signal that lower prices may still be ahead
- Purchase deferrals remove the natural demand floor that would otherwise stabilise prices
- The absence of buying allows prices to fall further, reinforcing the deferral decision
- Recovery in physical demand requires price stabilisation, not just lower prices
This counter-intuitive behaviour is one reason commodity analysts distinguish between price-elastic demand (which increases as prices fall) and trend-following demand (which requires directional clarity before engaging). Physical gold buyers in Asia, particularly retail jewellery consumers, behave more like trend-followers during periods of high volatility.
Goldman Sachs Revises Its Gold Outlook
Goldman Sachs reduced its December 2026 gold price target by approximately 9%, lowering the forecast from $5,400 per ounce to $4,900 per ounce. The revision acknowledges that the near-term macro headwinds from dollar strength and elevated rate expectations are more persistent than the bank's previous model assumed.
Crucially, the $4,900 target still implies approximately 17.7% upside from current levels around $4,162/oz. Goldman has not abandoned its structurally bullish long-term thesis. Instead, it has recalibrated the timeline and entry point, recognising that the path to recovery is likely to be longer and more turbulent than previously anticipated. Consequently, understanding broader recession and gold prices dynamics will be equally important as macro conditions continue to evolve.
Gold Price Scenario Framework to December 2026
| Scenario | Trigger Conditions | Likely Price Outcome |
|---|---|---|
| Bear Case | Fed hikes in September; dollar holds elevated; Asian demand stays weak | Break below $4,000/oz by Q3 2026 |
| Base Case | Inflation softens; hike probability drops below 50%; dollar stabilises | Range-bound between $4,100 and $4,500/oz |
| Bull Case | Rate expectations reverse; dollar weakens; Asian physical demand recovers | Recovery toward $4,900/oz by December 2026 |
The Historical Comparison: How Does This Stack Up?
The 23% peak-to-trough decline from February 2026 is substantial but not without precedent in dollar-driven commodity selloffs. During the aggressive Fed tightening cycle of 2022, gold fell approximately 20% from its March peak as the dollar surged higher through the second and third quarters. The key distinction in 2026 is that gold entered this correction from historically elevated levels above $5,000 per ounce. In absolute dollar terms, the drawdown is therefore larger, even if the percentage move is broadly comparable to prior tightening episodes. For a broader view of gold's historical highs and lows, context from prior cycles remains instructive.
The $4,000/oz Level: Technical and Psychological Significance
Round-number price levels carry disproportionate weight in financial markets for reasons that span both technical analysis and behavioural finance. At $4,000/oz, multiple factors converge:
- Algorithmic triggers: Many systematic trading strategies use round-number thresholds as stop-loss and re-entry levels
- ETF redemption pressure: A confirmed break below $4,000 would likely accelerate outflows from gold ETFs as retail investors react to psychological boundary violations
- Dealer discount amplification: Asian dealers already operating at discounts would widen those discounts further, removing another layer of structural support
- Media amplification: A break below $4,000 generates widespread financial media coverage, which itself can accelerate retail selling
Conversely, a successful technical defence of this level would provide the foundation for a stabilisation narrative, potentially encouraging physical buyers who have been sitting on the sidelines to re-engage.
The next major ASX story will hit our subscribers first
What Conditions Would Trigger a Recovery?
The Inflation Data Catalyst
The single most important near-term variable for gold price direction is upcoming US Consumer Price Index data. The logic is direct: a softer-than-expected CPI reading reduces the probability of a September rate hike, which weakens the dollar and lowers Treasury yields, both of which are mechanically positive for gold. A hotter reading does the opposite.
Traders should monitor CME FedWatch September hike probabilities in real time. The current 70% hike probability represents a level of hawkish conviction that is suppressing gold. A decline below 50% would signal a material shift in the rate outlook and could provide the catalyst for short-covering and renewed physical buying.
The Four Conditions Required for Physical Market Recovery
- Price volatility must stabilise before Asian buyers will commit capital at scale
- Fed rate hike expectations must moderate to reduce gold's opportunity cost disadvantage
- The US dollar must weaken to restore purchasing power in yuan and rupee terms
- Geopolitical risk must re-escalate in a way that overrides the monetary headwinds, though this remains the least reliable of the four conditions
Opportunity Cost Comparison: Gold vs. Yielding Assets
| Asset | Current Yield Profile | Relative Appeal vs. Gold |
|---|---|---|
| US Treasury Bills (3-month) | ~5.0 to 5.5% | High – risk-free income dominates zero-yield bullion |
| US 10-Year Treasury | ~4.5 to 5.0% | High – duration risk offset by income |
| Investment-Grade Bonds | ~5.0 to 6.0% | Moderate-High |
| Gold (Spot, no price appreciation) | 0% | Low – maximum opportunity cost in current environment |
| Gold (with price appreciation to $4,900) | ~17.7% implied upside | Conditional on macro reversal materialising |
Frequently Asked Questions
Why does gold fall when the US dollar strengthens?
Gold is priced in US dollars across global markets. When the dollar appreciates against other major currencies, international buyers must spend proportionally more in their home currency to purchase the same quantity of gold. This compression in purchasing power reduces demand from the largest physical gold markets, particularly China and India, which exerts downward pressure on the global benchmark price.
What is the critical support level for gold in mid-2026?
The $4,000 per ounce level functions as both a psychological reference point and a technical trigger for institutional and algorithmic trading. A sustained close below this threshold would signal accelerated downside risk, potentially widening dealer discounts across Asia and increasing ETF redemption pressure.
How do Federal Reserve rate expectations affect gold prices?
Rate hike expectations affect gold through two channels. First, they strengthen the dollar by attracting yield-seeking capital into US assets. Second, rising yields increase the opportunity cost of holding gold, since bonds and cash alternatives generate income that bullion cannot match. Both channels are currently working against gold simultaneously.
Why is lower-priced gold failing to stimulate physical buying in Asia?
Physical gold buyers in Asia tend to behave as trend-followers during periods of high volatility rather than bargain hunters. When prices are falling rapidly and the direction is uncertain, buyers delay purchases to avoid acquiring inventory that continues to decline in value. This dynamic was visible in both China, where the market shifted to an $8/oz discount, and in India, where dealer discounts reached $54/oz during the current correction period.
What would need to happen for gold to recover toward $4,900/oz by year-end?
A recovery toward Goldman Sachs' revised December 2026 target would most likely require a combination of softer US inflation data reducing the September rate hike probability, a consequent weakening of the US dollar index, stabilisation of price volatility sufficient to re-engage Asian physical buyers, and a recovery in ETF inflows across both Indian and Chinese markets.
Disclaimer: This article is for informational purposes only and does not constitute financial advice. Gold price forecasts, including those cited from Goldman Sachs, represent analyst projections that are subject to revision. Past price performance does not predict future returns. Investors should conduct independent research before making any investment decisions. For additional commodity market analysis and resources, visit cruxinvestor.com.
Want to Capitalise on the Next Major Mineral Discovery Before the Broader Market?
While gold navigates complex macroeconomic headwinds, significant ASX mineral discoveries continue to emerge across multiple commodities — and Discovery Alert's proprietary Discovery IQ model delivers real-time alerts the moment they hit the exchange, turning complex data into actionable opportunities for both short-term traders and long-term investors. Explore historic discoveries and their exceptional returns, then begin your 14-day free trial to ensure you're positioned ahead of the market when the next major find is announced.