July 14, 2026
When Energy Markets Break the Rules of Gold Investing
Every generation of gold investors eventually encounters a moment when the metal refuses to follow its own playbook. The 2026 commodity shock is proving to be one of those defining episodes. Conventional wisdom holds that geopolitical instability and rising energy prices should send gold higher, feeding demand for the world's oldest safe-haven asset. Instead, gold falls as oil spike and Strait of Hormuz closure raise Fed rate hike bets, creating a dynamic that has puzzled many retail investors while presenting a clearly legible framework to those who understand monetary policy transmission mechanics.
Understanding why this inversion is happening requires examining the architecture beneath the headlines rather than the headlines themselves.
When big ASX news breaks, our subscribers know first
The Three-Step Chain That Connects Crude Oil to Gold Prices
The mechanism linking an energy supply disruption to a declining gold price is not intuitive, but it is precise. It operates in three distinct stages that build on each other sequentially.
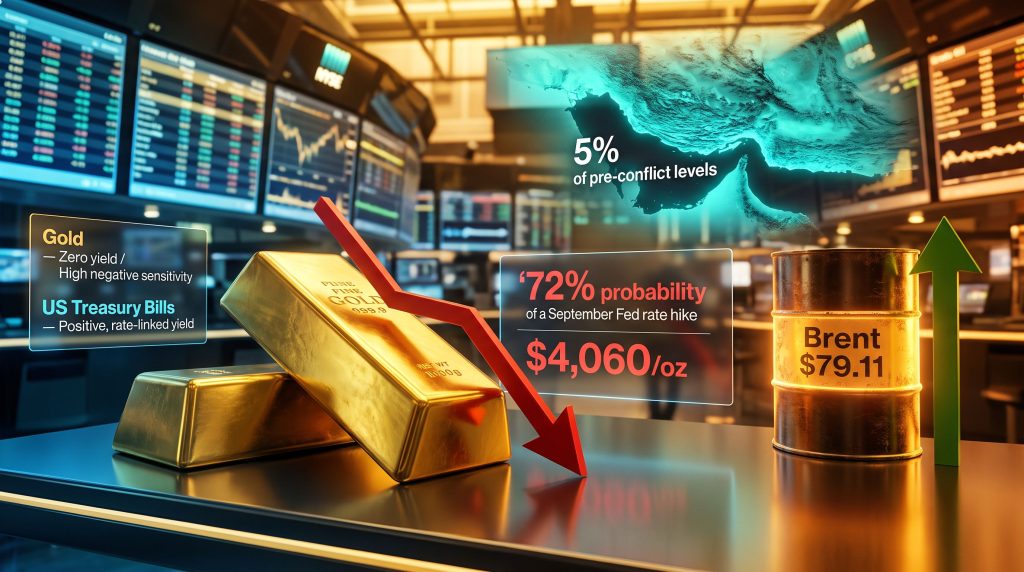
The first stage is the supply shock itself. The Strait of Hormuz, the narrow passage between Iran and Oman that handles roughly 20% of global crude oil trade under normal conditions, has seen effective shipping volumes collapse to approximately 5% of pre-conflict levels since hostilities escalated in late February 2026. When a corridor that moves one-fifth of the world's crude operates at near-zero capacity, oil markets price in sustained scarcity. Brent crude surged by approximately 4.1% to $79.11 per barrel following the most recent escalation, injecting fresh inflationary momentum into an already sensitive macro environment.
The second stage involves the repricing of inflation expectations. Bond markets and Fed funds futures do not wait for inflation to materialise in official data before adjusting. The probability of a Federal Reserve rate hike at the September FOMC meeting moved from approximately 63% to 72% in the wake of the latest oil spike, with markets also pricing a 50.9% probability of two or more hikes by year-end.
The third stage is where gold bears the cost. As a zero-yield asset, gold becomes progressively less attractive every time rate hike expectations rise. The opportunity cost calculation is straightforward: when US Treasury Bills offer a positive, rate-linked return and that return is expected to increase, institutional portfolio models mechanically reduce allocations to non-yielding assets. Gold, priced at approximately $4,060 per ounce at the time of writing, has declined by more than one-fifth from its pre-conflict highs. Furthermore, the gold price drivers at play in this cycle differ markedly from those that defined previous bull runs.
The critical insight here is that the Fed's response to oil-driven inflation becomes the dominant pricing variable for gold, overriding the traditional commodity correlation entirely.
Why the Inflation Hedge Assumption No Longer Applies
Gold's reputation as an inflation hedge was built across decades in which inflation was primarily a demand-pull phenomenon. When consumer spending or wage growth drives prices higher, gold benefits because the same forces that erode purchasing power tend to coincide with periods of dollar weakness and negative real rates. The 2026 environment is structurally different.
| Market Condition | Traditional Gold Response | 2026 Observed Response |
|---|---|---|
| Rising oil prices | Gold rises as inflation hedge | Gold falls on rate hike fears |
| Geopolitical escalation | Gold surges as safe haven | Gold declines on macro pressure |
| Weak employment data | Neutral to mildly negative | Gold rallies on rate cut expectations |
| Dollar strengthens | Gold falls | Gold falls, amplified by rate bets |
When inflation originates from an energy supply disruption rather than demand-pull dynamics, central banks face a genuine dilemma: they cannot resolve the supply problem, but they must respond to the inflationary signal it generates. That response, in the current cycle, has been unambiguously hawkish. The result is a feedback loop in which the same conflict that might historically generate safe-haven gold demand simultaneously produces the oil price signal that triggers the Fed response that makes gold less attractive.
In addition, understanding gold and bond dynamics helps clarify why rising rate expectations weigh so heavily on precious metals even when geopolitical tensions appear supportive. The conflict is, in effect, working against gold from both directions simultaneously.
The Dollar's Role as the Competing Safe Haven
One factor that rarely receives sufficient attention in retail-focused analysis is the role of the US Dollar Index in absorbing safe-haven capital that historically flowed to gold. Throughout the 2026 escalation period, the DXY has held above the psychologically significant 100 level, acting as a technical confirmation of dollar strength.
This matters for several compounding reasons:
- A stronger dollar makes dollar-denominated gold more expensive for international buyers, suppressing demand from a significant portion of the global gold market
- Institutional safe-haven flows that might have entered gold in a lower-rate environment are being captured by dollar-denominated assets offering positive yields
- The dollar's ability to hold its breakout above 100 without needing to rally further is itself a signal of the persistent macro headwind facing precious metals
- Every failed gold rally while the dollar holds this level serves as additional confirmation of the prevailing trend
The interplay between dollar strength, rate expectations, and gold pricing represents a more sophisticated framework than the simple inflation-hedge narrative that dominates popular discourse. Furthermore, central banks influencing gold through their rate decisions remain a primary structural force that retail investors frequently underweight in their analysis.
The Payrolls Report That Changed Everything Temporarily
The single most illuminating episode in gold's 2026 trajectory was the response to the most recent US nonfarm payrolls release. Job creation came in at approximately 57,000, falling sharply below market expectations that had been concentrated above 100,000. The data point triggered an immediate repricing of September rate hike probabilities, pulling them back toward the 50% threshold and generating a short-lived gold recovery off its lows.
The rally was instructive for what it revealed: gold's underlying sensitivity to rate expectations remains fully intact. The metal is not broken as a rate-sensitive asset. What has changed is the macro environment surrounding it.
Within days, the Strait of Hormuz disruption intensified, oil prices moved higher, and rate hike probabilities reasserted themselves above 70%. The brief reprieve was revoked. This sequence has significant implications for investors:
- Rate expectations are the primary driver, not geopolitical sentiment or inflation headline figures
- Each employment report now functions as a potential gold inflection point, with outsized influence relative to other data releases
- The current gold outlook is highly path-dependent, contingent on whether employment data deteriorates fast enough to offset the inflationary signal from energy markets
- The interplay between payrolls and oil creates a binary environment where gold either benefits from a Fed pivot narrative or suffers from a sustained tightening bias
According to recent reporting on commodity markets, inflation fears triggered by the Iran strikes have added further complexity to an already uncertain rate outlook, reinforcing the bearish case for gold in the near term.
Technical Structure and the Race Toward 2026 Lows
From a technical standpoint, gold futures are currently testing a rising support line anchored to the July 2026 price lows. Market analysts tracking price structure note that a sustained break below this support level is expected to accelerate the pace of decline. A move to new 2026 lows is considered a plausible near-term outcome given the macro configuration described above.
Silver is exhibiting parallel deterioration, with the industrial metals complex showing coordinated selling pressure. This synchronisation across precious metals is itself a technical confirmation that the selling is macro-driven rather than idiosyncratic to any single metal.
The scenario matrix for gold through the remainder of Q3 2026 can be structured as follows:
| Scenario | Trigger Conditions | Gold Price Implication |
|---|---|---|
| Bearish continuation | Oil stays elevated, CPI re-accelerates, Fed hikes in September | Decline toward and below 2026 lows |
| Neutral consolidation | Oil stabilises, employment data mixed, Fed holds in September | Range-bound trading near current levels |
| Bullish reversal | Diplomatic resolution reduces oil, payrolls weaken further, Fed signals dovish pivot | Recovery rally possible but structural headwinds remain |
The next major ASX story will hit our subscribers first
The Rerouting Cost Mechanism: How Hormuz Closure Reaches Consumer Prices
A dimension of the Strait of Hormuz disruption that receives less coverage than the headline oil price move is the structural cost increase embedded in global shipping logistics. The inflationary transmission from a closed strait to consumer prices operates through several distinct channels:
- Voyage duration increases: Tankers diverting around the strait add weeks to journey times, increasing fuel consumption and crew costs that flow directly into freight pricing
- War-risk insurance surcharges: Insurers apply conflict-zone surcharges to vessels operating anywhere near Gulf waters, raising the landed cost of crude for importing nations regardless of their proximity to the conflict
- Refinery input cost compression: Refineries configured to process specific Gulf crude grades face a constrained supply pool that pushes input costs higher, with downstream fuel price increases following with a lag of two to four weeks
- CPI feedback mechanics: Energy's weighting in consumer price indices means that sustained crude price elevation mechanically lifts headline inflation readings even before secondary price effects propagate through the economy
However, the broader trade war oil markets dynamic adds another layer of complexity, as existing geopolitical trade tensions have already strained energy supply chains before the Strait of Hormuz situation escalated further.
When a single chokepoint responsible for one-fifth of global crude supply operates at 5% of normal capacity, the inflationary signal it transmits to central banks is not classified as a transitory disruption. It becomes a sustained policy input with direct consequences for interest rate trajectories.
Portfolio Construction Implications: Rethinking Gold's Role
The 2026 experience is forcing a meaningful reassessment of how gold functions within a diversified portfolio during commodity supply shocks. The standard allocation model treats gold as a reliable inflation hedge, but that model was not stress-tested against a scenario in which inflation originates from a geopolitical energy disruption that simultaneously triggers a central bank tightening response.
Investors and allocators should consider incorporating several additional variables into any gold thesis:
- The Fed's reaction function must be assessed alongside the inflationary trigger, not separately from it. Oil-driven inflation invites a different Fed response than wage-driven inflation, and that difference is material for gold.
- Safe-haven capital flow destination matters. In cycles where the dollar is absorbing geopolitical risk premium, gold's safe-haven bid is structurally diminished regardless of the severity of the underlying conflict.
- The opportunity cost calculus shifts nonlinearly as rate hike probabilities move above 65-70%. At those levels, institutional rebalancing models apply meaningful pressure to zero-yield allocations.
- Silver's behaviour provides a coincident signal. When silver leads gold lower, the selling pressure reflects a macro institutional rotation rather than a precious metals-specific event, suggesting the move has further to run.
Consequently, the gold safe-haven demand narrative that proved so resilient in prior cycles is being tested in ways that require a more nuanced, rate-aware analytical framework. Moreover, analysis from CNBC highlights how oil surging on Hormuz closure fears has directly contributed to gold sliding more than 1% in a single session, underscoring the severity of the current macro headwind.
Disclaimer: This article is intended for informational and educational purposes only. It does not constitute financial advice, investment recommendations, or a solicitation to buy or sell any financial instrument. All market data, price levels, and probability figures referenced reflect publicly available information as of mid-July 2026. Past market behaviour is not indicative of future results. Readers should conduct their own due diligence and consult a licensed financial adviser before making any investment decisions.
Key Monitoring Variables for the Path Ahead
For investors seeking to track the variables most likely to shift the current gold price trajectory, the following indicators carry the highest signal value in the current macro environment:
- Strait of Hormuz shipping volume data: Any recovery from the current 5% of normal capacity would reduce oil price support and ease the inflationary signal reaching Fed policymakers
- Monthly US nonfarm payrolls releases: As demonstrated by the 57,000-print episode, single employment reports carry sufficient weight to materially shift September rate hike probabilities and generate meaningful gold price moves in either direction
- Federal Reserve communication: FOMC minutes, press conferences, and governor speeches between now and September will signal whether a rate hike is genuinely on the table or is being used as a market management tool
- US Dollar Index relative to the 100 level: The DXY's ability to maintain its breakout above this threshold is the clearest real-time indicator of whether the structural headwind for precious metals remains in place
- Brent crude price trajectory: Oil above $80 per barrel is the approximate threshold at which inflation expectations consistently price September rate hike probabilities above 65%, maintaining maximum pressure on gold
The 2026 episode is a case study in how monetary policy transmission mechanics can invert the intuitive relationships between asset classes. Gold falls as oil spike and Strait of Hormuz closure raise Fed rate hike bets, not because gold has lost its fundamental properties, but because the specific configuration of this cycle places the Federal Reserve's reaction function between the geopolitical catalyst and the precious metals market. Until that configuration changes, the analytical framework described here will continue to explain what the headlines cannot.
Want to Stay Ahead of the Next Major Mineral Discovery on the ASX?
While gold navigates complex macro headwinds driven by rate expectations and energy supply shocks, Discovery Alert's proprietary Discovery IQ model scans ASX announcements in real time, delivering instant alerts on significant mineral discoveries and turning complex data across 30-plus commodities into clear, actionable insights — explore historic discoveries and their extraordinary returns, then begin your 14-day free trial at Discovery Alert to position yourself ahead of the broader market.