June 23, 2026
The Dollar's Stranglehold on Gold and Why Sovereign Buyers Are Unbothered
Commodity markets have a well-documented tendency to punish short-term holders during periods of monetary policy repricing. When central banks shift their posture, speculative capital moves fast, liquidity contracts, and prices reset before the underlying fundamentals have time to reassert themselves. This is precisely the environment gold investors found themselves navigating in late June 2026, as a single FOMC meeting reshaped rate expectations dramatically enough to send the precious metal sliding through a psychologically significant threshold.
Understanding why gold below $4,100 on Fed hike expectations became the defining headline requires separating two very different conversations: what speculators are doing today, and what sovereign institutions are doing over the next several years. These two groups are currently moving in opposite directions, and that divergence is the defining tension of the current gold market.
When big ASX news breaks, our subscribers know first
Two Forces Pulling Gold in Opposite Directions
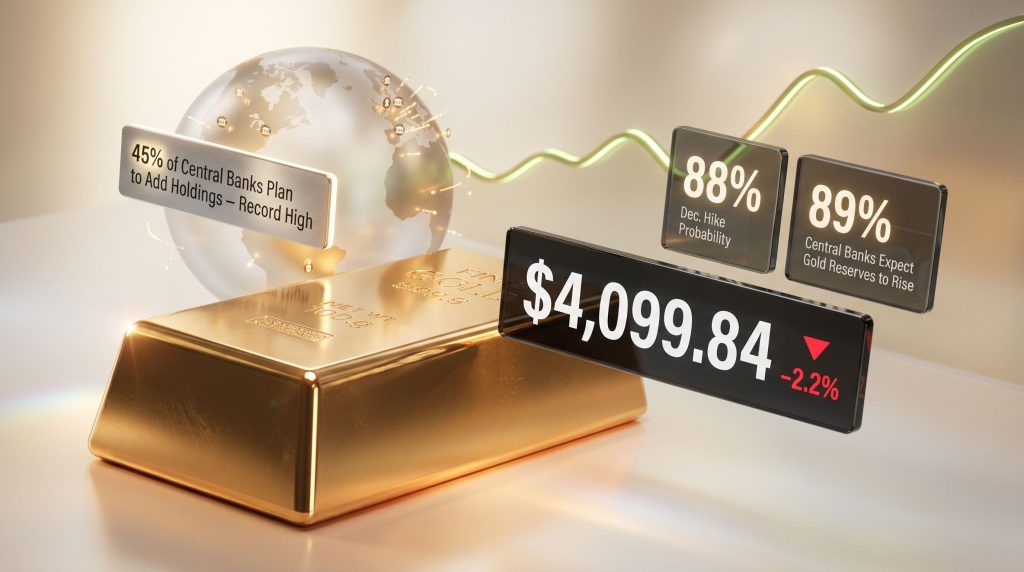
The immediate catalyst for gold's retreat was unambiguous. Spot gold declined 2.2% to $4,099.84 per ounce, while August gold futures fell 2.0% to $4,117.70, as the U.S. dollar index climbed to 101.13, its highest reading since May 2025. That dollar strength did not emerge in isolation. It was the direct consequence of a rapid and significant repricing of Federal Reserve rate expectations.
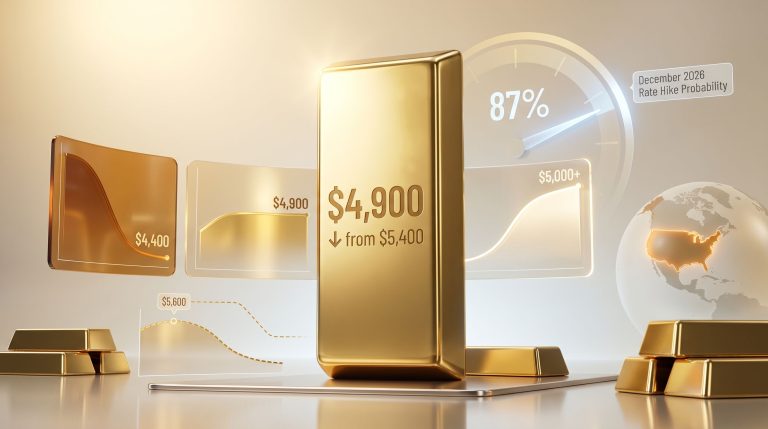
Before the most recent FOMC meeting, markets assigned a 61% probability to a December Fed rate hike. Following the meeting, that figure surged to 88%. Fed funds futures simultaneously priced more than an 80% probability of a rate hike as early as September, representing a notably aggressive shift in market positioning over an extremely compressed timeframe.
Both BofA Global Research and Deutsche Bank reversed their prior forecasts of unchanged policy rates, now projecting at least one rate hike in 2026. Their reasoning centres on persistent economic resilience that has reduced the justification for accommodative monetary conditions. Fed Chair Kevin Warsh's hawkish positioning has further reinforced the dollar's elevation near the 101 level.
How the Dollar Mechanically Compresses Gold Prices
The relationship between dollar strength and gold and bond dynamics is one of the most consistent patterns in financial markets, yet its mechanics are frequently misunderstood by retail investors. Because gold is priced globally in U.S. dollars, a stronger greenback raises the effective cost for buyers transacting in other currencies. A Japanese or European investor purchasing gold today faces a higher local-currency price than they did before the dollar's recent appreciation, which suppresses demand at the margin.
Simultaneously, rising rate expectations increase the opportunity cost of holding gold. Unlike Treasury bonds or interest-bearing deposits, gold generates no yield. As the probability of higher rates increases, the relative attractiveness of dollar-denominated yield-bearing instruments rises, drawing capital away from non-yielding assets. These two effects — higher effective prices for international buyers and elevated opportunity costs for all holders — compound each other during periods of hawkish monetary repricing.
Currency Markets Amplified the Selloff
The yen's weakness added another layer of complexity. The Japanese currency weakened to 161.48 against the dollar following US-Japan currency talks that produced no concrete commitment to intervention. For gold markets, this matters because unambiguous yen weakness signals that dollar strength is broad-based rather than idiosyncratic, confirming that the repricing has durability. Until credible signals of currency intervention emerge from Japanese authorities, this structural dollar dominance is likely to persist.
The South African rand also slipped 0.3% to 16.4525 per dollar, reflecting the wide-reaching nature of dollar appreciation across emerging market currency pairs. Furthermore, gold safe-haven dynamics were notably suppressed during this session, as risk sentiment was driven almost entirely by monetary policy repricing rather than geopolitical uncertainty.
The Precious Metals Selloff Was Broad, Not Isolated
One of the most instructive features of this episode is that the decline was not confined to gold. The entire precious metals complex moved lower, confirming that macroeconomic forces rather than gold-specific factors drove the session. Market participants seeking context on recent gold price movements will note that this pattern of broad precious metals weakness during dollar-strengthening episodes is well-documented.
| Metal | Price | Single-Session Decline |
|---|---|---|
| Gold (Spot) | $4,099.84/oz | -2.2% |
| Gold (Aug Futures) | $4,117.70/oz | -2.0% |
| Silver | $61.90/oz | -5.0% |
| Platinum | $1,628.55/oz | -3.0% |
| Palladium | $1,229.28/oz | -2.9% |
Silver's outsized 5.0% decline deserves particular attention. As both a monetary metal and an industrial commodity, silver carries dual exposure to macro repricing and growth expectations. Its larger percentage fall relative to gold reflects this sensitivity and is consistent with historical patterns during dollar-strengthening episodes. Platinum and palladium declines confirm the same macro narrative.
89% of Central Banks Are Still Planning to Add Gold Reserves
While speculative traders were reducing gold exposure, a very different group of market participants was reinforcing their long-term commitment to the metal. The World Gold Council's Central Bank Gold Reserves Survey 2026 delivered findings that stand in sharp contrast to the short-term price action. Indeed, central bank gold demand continues to act as a powerful counterweight to speculative selling pressure.
Survey Finding: According to the World Gold Council's Central Bank Gold Reserves Survey 2026, 89% of central banks anticipate global gold reserves will grow over the following 12 months, while a record 45% indicated active plans to increase their own holdings.
The directional shift in reserve composition expectations is equally significant. The proportion of central banks expecting gold to represent a larger share of total reserves within five years rose from 76% in the prior year's survey to 84% in 2026 — an 8-percentage-point increase that reflects deepening institutional conviction rather than opportunistic positioning.
| Survey Metric | 2025 Reading | 2026 Reading | Change |
|---|---|---|---|
| CBs expecting global gold reserves to rise | Not disclosed | 89% | – |
| CBs planning to add to own holdings | – | 45% (record) | Up year-on-year |
| CBs expecting gold's reserve share to grow | 76% | 84% | +8 pts |
| CBs expecting USD reserve share to decline | – | 74% | – |
The figure that carries perhaps the most long-term significance is the 74% of respondents who expect the U.S. dollar's share of global reserves to decline over the same five-year horizon. This is not a speculative view held by a minority of unconventional thinkers. It is now the mainstream expectation among the world's central bank reserve managers, and it has direct implications for structural gold demand. Understanding how central banks and gold prices interact over longer cycles helps clarify why these institutions remain unmoved by short-term volatility.
Why Central Banks Ignore Short-Term Price Dips
Central banks operate on reserve management timelines that typically span years or decades, not days or weeks. Their allocation decisions are driven by considerations of portfolio diversification, currency risk mitigation, and long-term store-of-value properties rather than short-term price momentum. A 2.2% single-session decline in spot gold is statistically irrelevant to an institution with a five-year reallocation horizon.
The record 45% planning active additions to their own holdings is particularly meaningful because it represents a commitment to deployment, not merely a directional view. These institutions are in the market, and their buying provides a structural demand floor that limits downside even during macro-driven selloffs.
Key Insight: The divergence between speculative short-term selling and sovereign long-term accumulation is not a contradiction. It is the mechanism by which gold market bottoms are established during monetary policy transitions.
What the $4,100 Level Means for Gold Mining Producers
The immediate financial consequences of gold below $4,100 on Fed hike expectations vary substantially across the producer landscape, and understanding this variation requires familiarity with one of the mining sector's most important metrics: all-in sustaining cost, or AISC.
AISC captures the full cost of maintaining and sustaining gold production, including mining costs, processing, site general and administrative expenses, sustaining capital, and corporate overhead. A producer with an AISC of $1,400 per ounce operates with a margin of approximately $2,700 per ounce at current spot prices. A higher-cost operation with an AISC of $2,800 per ounce is working with a margin roughly half that size, and is therefore far more exposed to further price compression.
The South African Producer Equation
For South African gold miners, the arithmetic is more complex. The rand's 0.3% depreciation to 16.4525 per dollar provides a partial natural hedge. When a South African producer converts U.S. dollar gold revenues back into rand, a weaker local currency means each dollar buys more rand, partially offsetting the impact of a lower dollar gold price.
However, this benefit is not without a corresponding cost. Dollar-denominated debt and imported mining equipment become more expensive in rand terms when the local currency weakens. The South Africa 2035 government bond yield rose 4 basis points to 8.32%, signalling tightening financing conditions that further challenge capital-intensive mining operations.
An underappreciated dynamic in South African gold mining is the role of cut-off grade economics and flexibility. During periods of price compression, mines with geologically diverse ore bodies can adjust their cut-off grade upward, effectively mining only the highest-grade ore and deferring lower-grade material. This approach reduces throughput but preserves margin by concentrating processing on economically superior material. Mines with rigid, single-grade ore bodies lack this operational lever and are disproportionately exposed.
Operational Advantage: Producers with flexible mine plans and the ability to dynamically adjust cut-off grades are structurally better positioned to absorb spot price declines than those locked into fixed production schedules near their AISC breakeven.
Three Scenarios That Could Shift Gold's Near-Term Trajectory
Identifying where gold trades over the coming weeks depends heavily on which of three potential catalysts materialises first.
Scenario 1: Japanese Currency Intervention
- Japanese authorities have so far declined to commit to yen support despite US-Japan currency discussions
- Any credible intervention would weaken the dollar index from its current 101.13 reading
- A softer dollar directly reduces the effective cost of gold for international buyers, supporting a price recovery above $4,100
- The risk of intervention remains live and represents the most immediate potential catalyst for a gold rebound
Scenario 2: Geopolitical Demand Resurgence
- Uncertainty surrounding US-Iran negotiations continues to sustain a geopolitical risk premium embedded in gold prices
- A breakdown in diplomatic talks could reignite safe-haven flows, providing a partial offset to rate-driven selling pressure
- Conversely, a durable peace agreement would remove a meaningful geopolitical support layer, increasing downside risk beyond the current correction
Scenario 3: PCE Inflation Data Surprise
- The U.S. Personal Consumption Expenditures (PCE) inflation report is the Federal Reserve's preferred inflation gauge and carries the most direct influence over rate expectations
- A softer-than-expected reading could reduce the probability of September and December hikes, weakening the dollar and supporting gold
- A hotter reading would validate the current hawkish consensus, sustaining dollar strength and maintaining pressure on the $4,100 level. Analysts tracking hawkish Fed rhetoric and gold note this scenario has historically produced the sharpest near-term corrections
| Scenario | Key Assumption | Implied Gold Direction |
|---|---|---|
| Base Case | 88% December hike probability holds; CB buying continues | Gold trades near $4,100, supported by institutional demand |
| Bear Case | US-Iran peace deal reduces geopolitical premium; dollar stays elevated | Further downside beyond current 2.2% decline |
| Bull Case | PCE softens; yen intervention materialises; dollar weakens | Recovery above $4,100 as rate expectations reprice lower |
The next major ASX story will hit our subscribers first
Frequently Asked Questions: Gold Below $4,100 and Fed Rate Hike Expectations
Why did gold fall below $4,100?
Gold declined 2.2% to $4,099.84 per ounce after market-implied probability of a December Federal Reserve rate hike jumped from 61% to 88% following the most recent FOMC meeting. This repricing strengthened the U.S. dollar to its highest level since May 2025, increasing the effective cost of gold for buyers outside the United States and reducing demand at the margin.
What is the relationship between Fed rate hikes and gold prices?
When rate hike expectations rise, the U.S. dollar tends to appreciate and the opportunity cost of holding non-yielding assets like gold increases. Capital rotates toward yield-bearing dollar instruments, creating downward pressure on gold. This inverse relationship between monetary tightening expectations and gold prices is one of the most reliable dynamics in commodity markets.
Are central banks still buying gold despite the price decline?
According to the World Gold Council's Central Bank Gold Reserves Survey 2026, 89% of central banks expect global gold reserves to increase over the next 12 months, and a record 45% plan to add to their own holdings. Central banks manage reserves on multi-year horizons and generally do not alter strategic allocations based on short-term price volatility.
What data releases could move gold prices next?
The U.S. PCE inflation report represents the single most consequential near-term data release for gold prices, given its direct influence over Fed rate expectations. South Africa's producer inflation data provides a secondary indicator relevant to rand-exposed mining producers assessing input cost trajectories.
What is the significance of the $4,100 level?
The $4,100 zone functions as both a technical and psychological threshold. A sustained break below this level could signal additional downside if dollar strength persists. However, the structural demand floor created by central bank accumulation and residual geopolitical uncertainty provides meaningful support that limits the extent of any further decline.
The Long-Term Thesis Remains Structurally Intact
The current pullback reflects a specific and cyclical macro configuration: elevated rate expectations, a strong dollar, and a temporarily reduced geopolitical risk premium. Each of these factors is reversible. PCE data can undershoot. Currency intervention can materialise. Diplomatic situations can deteriorate. None of these drivers carry the permanence of the structural forces that have been building beneath the gold market for years.
The shift from 76% to 84% of central banks expecting gold to represent a larger share of reserves within five years is not a trading signal. It is a policy commitment. The 74% expecting the dollar's reserve share to decline over the same horizon represents a generational reorientation of sovereign reserve strategy that a single Fed rate cycle is unlikely to reverse.
Short-term price action will always generate noise. What the 2026 central bank survey makes clear is that the institutions with the largest and most durable gold buying capacity are not deterred by that noise. For long-term investors, the divergence between speculative selling and sovereign accumulation is less a source of concern and more a structural feature of how gold markets absorb macro turbulence — including episodes of gold below $4,100 on Fed hike expectations — while preserving their long-term upward trajectory.
This article is intended for informational purposes only and does not constitute financial advice. All price data, survey findings, and market probability figures referenced reflect conditions as reported in June 2026. Forecasts, scenarios, and projections involve inherent uncertainty and should not be relied upon as predictions of future market performance. Investors should conduct their own research and consult qualified financial advisers before making investment decisions.
Want to Capitalise on the Next Major Mineral Discovery Before the Broader Market Catches On?
While sovereign institutions quietly accumulate gold reserves over multi-year horizons, Discovery Alert's proprietary Discovery IQ model delivers real-time alerts the moment significant ASX mineral discoveries are announced — instantly turning complex data across 30+ commodities into actionable insights for both short-term traders and long-term investors. Explore historic discoveries and the exceptional returns they generated, then begin your 14-day free trial at Discovery Alert to position yourself ahead of the market.