July 17, 2026
The Monetary Trap Gold Cannot Escape in 2026
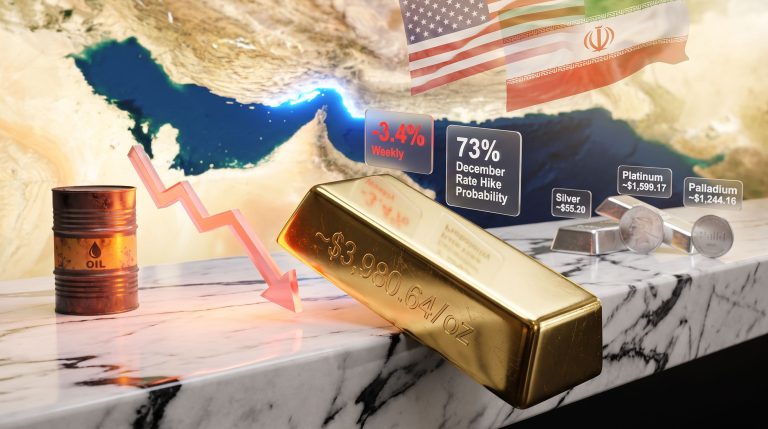
Gold pressured by Fed rate expectations and Iran conflict dynamics has exposed a critical flaw in how most investors think about bullion. There is a long-standing assumption that uncertainty is gold's friend — that wars, sanctions, and political instability drive capital toward the metal. However, mid-2026 has revealed that gold is not simply a fear trade. It is, at its core, a yield-avoidance trade.
When the cost of avoiding yield rises sharply enough, even genuine geopolitical terror cannot save it. Understanding the current environment requires dismantling the simplified gold safe-haven dynamics narrative and replacing it with a more precise framework — one that accounts for the competing forces pulling at the metal from opposite directions simultaneously.
When big ASX news breaks, our subscribers know first
The Mechanism Behind Gold's Counterintuitive Decline
Gold is being pressured by Fed rate expectations and the Iran conflict in a way that reveals a deeper structural dynamic: the same geopolitical event driving safe-haven demand is simultaneously generating the inflation signal that justifies monetary tightening.
The chain of causation operates as follows:
- Washington reimposed a naval blockade on Iranian ports, followed by US strikes on Iran's coastal defence infrastructure and missile sites.
- Iranian forces retaliated against US military installations, escalating the conflict.
- Strait of Hormuz supply risk pushed crude oil geopolitical tensions toward a one-month high, given that roughly 20% of global oil supply transits this chokepoint.
- Elevated energy prices fed directly into headline consumer price index expectations — the metric Federal Reserve policymakers weight most heavily.
- Inflation risk rising → Fed rate-hike expectations firmed → opportunity cost of holding non-yielding gold increased → gold sold off.
This transmission mechanism explains how an active military conflict can produce a gold price decline. The conflict is not failing to register with markets — it is registering through the wrong channel for gold bulls.
Critical Framing: The Iran conflict is simultaneously the argument for owning gold (geopolitical disruption) and the argument against it (oil-driven inflation reinforces Fed hawkishness). This creates a structural trap that geopolitical risk alone cannot resolve.
What the Price Data Reveals About Dual-Force Pressure
The numbers from mid-July 2026 paint a clear picture of how this dynamic has materialised across the entire precious metals complex.
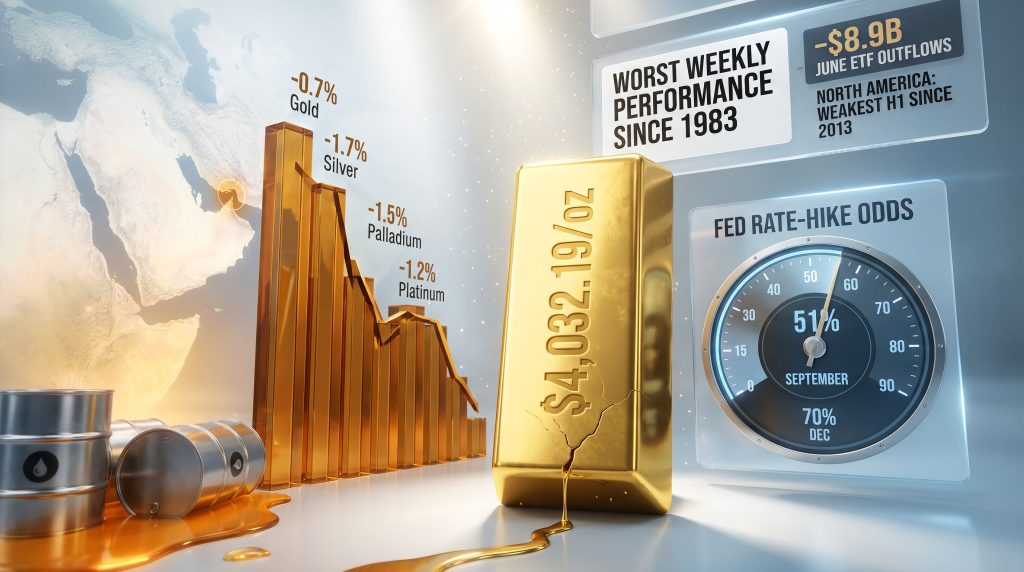
Spot gold declined 0.7% to $4,032.19 per ounce, while US gold futures fell 0.4% to $4,037.20. The $4,000 per ounce level was briefly breached on 24 June 2026 — a threshold not tested in the prior seven months. Furthermore, gold recorded its worst weekly performance since 1983 during the height of conflict escalation. Earlier, on 4 May 2026, prices dropped more than 1% to settle near $4,553 per ounce as US-Iran tensions intensified alongside a strengthening dollar.
The selloff was not isolated to gold. Every major precious metal declined in the same period:
| Metal | Price Decline | Primary Pressure Driver |
|---|---|---|
| Gold | -0.7% | Rate sensitivity and institutional ETF outflows |
| Silver | -1.7% | Monetary headwinds compounded by industrial demand concerns |
| Platinum | -1.2% | Broad risk-off selling across the complex |
| Palladium | -1.5% | Liquidity-driven exits from precious metals exposure |
The breadth of this selloff is analytically important. When all four major precious metals decline simultaneously, the cause is macro-level rather than metal-specific. The common denominator is rising rate expectations and a firming US dollar, not any fundamental deterioration in supply-demand for individual metals.
A brief but meaningful counterpoint emerged on 3 July 2026, when gold posted its first weekly gain in five weeks. The trigger was softer-than-expected US jobs data, which temporarily reduced rate-hike bets. This episode confirmed that rate expectations, not conflict headlines, are the primary variable driving gold's near-term price action. According to Reuters, a weaker dollar environment can briefly support gold even amid ongoing geopolitical tensions.
How Fed Rate-Hike Probabilities Are Repricing Gold in Real Time
The two most important numbers for gold investors are not the oil price or the conflict casualty count. They are the September and December Federal Reserve rate-hike probabilities derived from derivatives markets.
| Rate-Hike Probability Indicator | Current Reading | Prior Reading | Signal |
|---|---|---|---|
| CME FedWatch: September hike probability | 51% | Below 50% | Markets now lean toward a hike as the base case |
| LSEG: December hike probability | 70% | ~80% | Elevated despite marginal easing on softer CPI and PPI data |
A September probability above 51% represents a psychological and mathematical threshold. Markets are no longer treating a rate hike as a tail risk — they are treating it as the modal outcome. This matters because gold's return is purely price appreciation. Consequently, when short-duration Treasuries and money market instruments offer meaningful real returns, the opportunity cost of holding gold rises in direct proportion to rate expectations.
How Do Central Bank Signals Shape Gold's Trajectory?
The central banks influencing gold via hawkish communications remain a dominant force. Fed Chair Kevin Warsh has reinforced this dynamic by making clear that the Federal Reserve will not accommodate above-target inflation, anchoring hawkish expectations regardless of near-term data softness.
Two Fed officials carry particular weight for repositioning ahead of upcoming meetings:
- Dallas Fed President Lorie Logan — her commentary on inflation persistence and terminal rate expectations carries significant market-moving potential.
- Fed Vice Chair Philip Jefferson — his signals on the pace and duration of restrictive policy will shape market pricing ahead of both the September and December decisions.
Any meaningful shift in their communication posture could rapidly reprice rate-hike odds, with direct consequences for gold positioning.
Iran's Conflict Architecture and Its Inflationary Feedback Loop
The specific military and economic dimensions of the Iran conflict matter because they determine how long the inflationary feedback loop remains active.
Washington's reimposition of a naval blockade on Iranian ports, followed by strikes on coastal defence systems and missile infrastructure, was not a surgical strike designed for rapid resolution. Iranian retaliation against US military installations escalated the conflict into a two-way exchange that markets are now pricing as a sustained confrontation rather than a contained incident.
The Strait of Hormuz dimension is particularly significant. Approximately 20% of global oil supply transits this waterway. Even partial disruption to Iranian export capacity tightens global crude supply and pushes energy prices higher. Elevated energy costs flow directly into headline CPI through transportation, manufacturing, and household energy expenditure — reinforcing precisely the inflation signal that keeps the Fed's hawkish posture intact.
The Strategic Trap: Conflict de-escalation would simultaneously reduce oil prices, ease inflation expectations, lower rate-hike probabilities, and remove the geopolitical uncertainty premium. In other words, peace is more bullish for gold than war in this specific configuration.
The absence of a confirmed diplomatic backchannel between Washington and Tehran leaves the situation structurally unresolved. Without a visible pathway to de-escalation, both the geopolitical risk premium and the oil-driven inflation signal remain priced into markets concurrently, maintaining the dual-pressure environment. As CNBC reports, new US-Iran strikes have continued to boost oil prices while simultaneously weighing on gold through firming rate-hike bets.
Gold ETF Flows: Institutional Capital Is Voting Against the Metal
Price action tells part of the story. However, fund flows tell the rest, and the ETF data for mid-2026 reflects a deliberate institutional repositioning rather than a tactical pause.
| Region | H1 2026 Net ETF Flow | Notable Context |
|---|---|---|
| North America | -$7.7 billion | Weakest first-half performance since 2013 |
| Global (June alone) | -$8.9 billion | Every region recorded net withdrawals |
| India | Positive inflows | Retail investors added to ETFs during June's price decline |
North America's $7.7 billion H1 outflow is not a single-month anomaly. It represents six months of sustained net withdrawals, indicating that institutional allocators made a considered decision to reduce gold exposure as rate-hike expectations firmed. The comparison to 2013 is instructive — that year's ETF outflows coincided with the Federal Reserve's first signals of tapering quantitative easing, a period when rising rate expectations similarly repriced gold's opportunity cost.
Furthermore, June's $8.9 billion in global outflows is particularly telling because it preceded the latest spot price decline, suggesting institutional investors were reducing positions ahead of the move rather than reacting to it. The contrast with Indian investor behaviour, where retail investors were adding to positions during price weakness, reflects different investment frameworks altogether.
The next major ASX story will hit our subscribers first
Scenario Framework: Four Pathways for Gold in H2 2026
Given the dual-variable nature of the current setup, single-point gold price targets are analytically insufficient. The more useful framework, as outlined in the broader gold investment outlook for 2025–2026, maps outcomes against combinations of rate expectations and geopolitical developments.
| Scenario | Required Conditions | Gold Outlook |
|---|---|---|
| Base Case: Continued Pressure | September odds stay at or above 51%; crude near one-month highs; no de-escalation | Gold remains range-bound or declines; cash and short-duration bonds outperform |
| Bull Case: Catalyst-Driven Recovery | September odds fall sustainably below 51%; confirmed Iran de-escalation | ETF buying resumes; gold recovers toward prior price levels |
| Bear Case: Escalation Deepens | December odds rise back toward 80%; Strait of Hormuz risk materialises fully | Gold tests $3,900–$3,950 support; precious metals complex remains under broad pressure |
| Tail Risk Bull Case | Geopolitical shock triggers liquidity event; Fed forced to pivot | 5–10% risk premium materialises; gold outperforms across asset classes |
The J.P. Morgan scenario flagging a potential 5–10% geopolitical risk premium addition to gold warrants attention precisely because it requires conditions that are currently absent. Current market structure does not support this scenario, but it represents the most significant upside tail risk for gold exposure.
How to Position When Rate Odds Range Between 51% and 70%
The gap between the September probability at 51% and the December probability at 70% is not just a numerical range. It is a measure of how much uncertainty remains embedded in the Fed's policy trajectory. In addition, this range is wide enough that binary positioning on a single gold price outcome is inappropriate.
Two indicators deserve priority monitoring before any adjustment to gold exposure:
- CME FedWatch September rate-hike probability — a sustained decline below 51% is the first signal that the primary monetary headwind is easing. A single data-driven softening is insufficient; the trend needs to confirm.
- Iran diplomatic developments — confirmed de-escalation, a ceasefire agreement, or the resumption of formal negotiations removes both the oil price inflation channel and the geopolitical uncertainty premium in a single catalyst event.
The $4,000 per ounce level functions as the critical psychological and technical floor. A sustained breach below this level would signal deterioration beyond what current positioning reflects, potentially accelerating institutional ETF outflows that are already running at their weakest pace since 2013.
Key Variables to Monitor Before Increasing Gold Exposure
Gold pressured by Fed rate expectations and Iran conflict dynamics will not resolve through a single data point or headline. The structural configuration that produced this environment — where geopolitical risk feeds inflation and inflation feeds rate expectations — requires a multi-variable shift before the pressure abates meaningfully. In addition to the gold and bond dynamics that underpin longer-term allocation decisions, the following variables provide the clearest near-term signal set:
- CME FedWatch September hike probability — watch for sustained movement below 51%, not single-day fluctuations driven by one data print.
- LSEG December hike probability — a decline from the current 70% toward 60% or below would signal markets are pricing a less restrictive Fed trajectory.
- Iran diplomatic status — any confirmed backchannel, ceasefire negotiation, or peace talk resumption represents the single highest-impact catalyst for a gold recovery.
- Global gold ETF weekly flow data — a return to net inflows across North America after six months of outflows would signal that institutional sentiment has shifted.
- Fed commentary from Lorie Logan and Philip Jefferson — their language on terminal rates and the duration of restrictive policy will anchor or reprice rate-hike odds ahead of key meetings.
The most important analytical conclusion from mid-2026 is not that gold has failed as an asset. It is that the conditions under which gold performs are more specific than conventional safe-haven narratives suggest. When the path from geopolitical risk to inflation to rate hikes is as direct as it is in the current Iran-oil-Fed configuration, monetary policy expectations will dominate until that transmission mechanism breaks down.
Want to Know Which ASX Mineral Discoveries Could Deliver Outsized Returns?
While gold navigates complex monetary headwinds, Discovery Alert's proprietary Discovery IQ model scans ASX announcements in real time, instantly identifying significant mineral discoveries and translating complex data into actionable investment insights — explore the historic returns major discoveries have generated and begin your 14-day free trial at Discovery Alert to position yourself ahead of the broader market.