July 17, 2026
The Hierarchy Problem in Precious Metals: When Central Banks Outrank Conflict
The conventional wisdom around gold investing rests on a simple premise: when the world becomes dangerous, investors flock to safety. War, political instability, and financial uncertainty are supposed to send gold higher. However, this framework carries a critical blind spot that mid-2026 has exposed with unusual clarity. Monetary policy expectations, when sufficiently hawkish, can functionally override even active military conflict as a gold price driver. Understanding why this happens, and when it happens, is arguably the most valuable skill a gold investor can develop.
The mechanics of this override are rooted in gold's fundamental characteristic: it generates no yield. Every basis point that risk-free interest rates rise makes the comparative cost of holding bullion incrementally more expensive. When that repricing happens rapidly, the market effect is sharp and directional, regardless of what is happening in geopolitical headlines. Furthermore, the gold price forecast for 2025 had already begun signalling the upward momentum that would eventually reverse under these conditions.
When big ASX news breaks, our subscribers know first
Gold Below $4,000 on Fed Rate Hike Bets: What the Numbers Actually Reveal
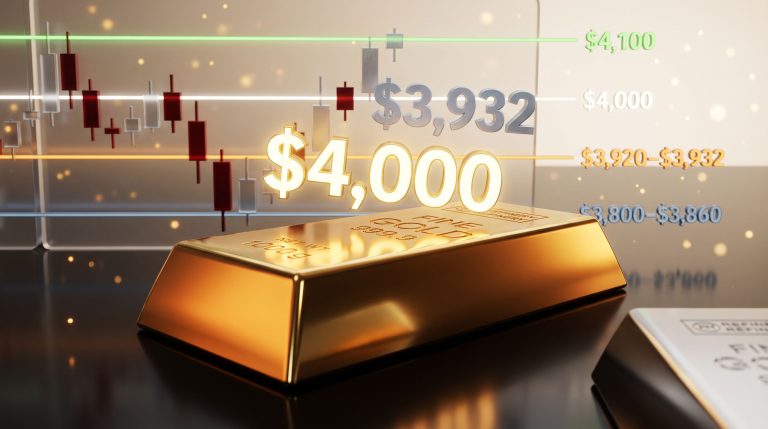
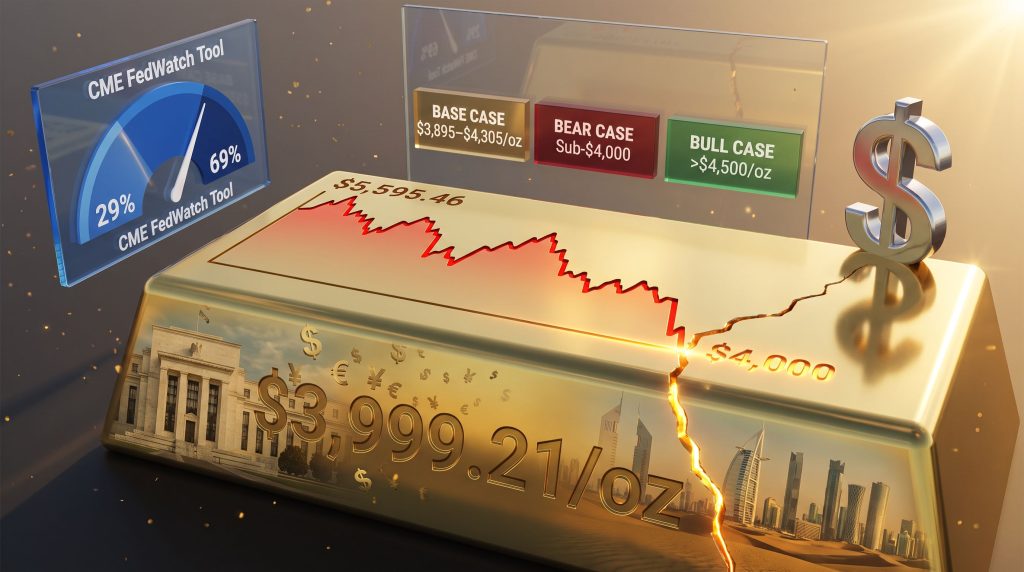
The breach of the $4,000/oz psychological threshold in mid-July 2026 was not a quiet slip. Spot gold settled at $3,999.21/oz, marking the first close below that level since November 7, 2025, and the weekly decline exceeded 3% during a period when Iran was conducting its sixth consecutive night of strikes on U.S. facilities in the Middle East. That combination, a deepening military conflict alongside a falling gold price, is the kind of market contradiction that demands explanation.
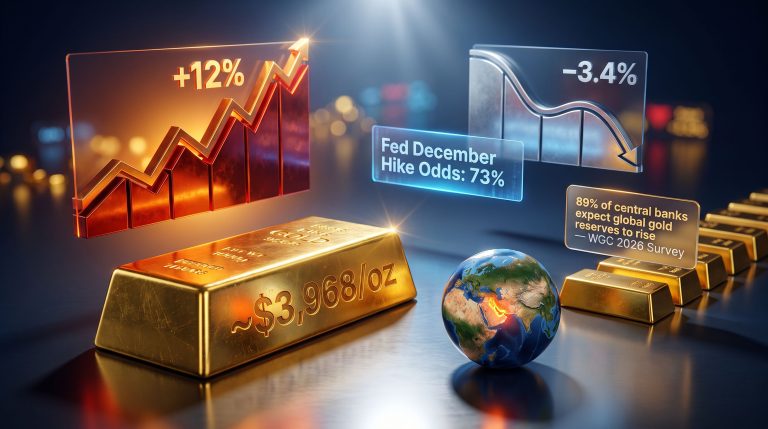
The answer sits squarely in the interest rate probability curve. Within a matter of days, the market-implied probability of a September 2026 Federal Reserve rate hike shifted from approximately 29% to roughly 69% as tracked through the CME FedWatch Tool, before settling near 50% by mid-July. That is a repricing of more than 40 percentage points in an extraordinarily compressed timeframe. Gold in volatile markets has historically demonstrated resilience, yet this episode underscores how rapidly conditions can shift.
The Fed Officials Who Moved the Market
Two senior Federal Reserve voices were central to this repricing:
- Dallas Fed President Lorie Logan publicly advocated for additional monetary tightening, representing a notably hawkish stance from a regional Fed president with historical influence over market expectations.
- Fed Vice Chair Philip Jefferson signalled conditional support for further rate increases, contingent on inflation data remaining elevated, which reinforced the tightening narrative.
The combined weight of these two signals, coming from a Fed Vice Chair and a prominent regional president simultaneously, compressed the timeline for market repricing in ways that individual speeches rarely achieve. Gold, as a non-yielding asset, absorbed the full force of that adjustment. According to Yahoo Finance, the metal's sharp decline below the $4,000 mark sent ripples through both commodity and equity markets alike.
The Opportunity Cost Architecture: Why Rate Expectations Hit Gold Hardest
To understand why gold fell below $4,000 on Fed rate hike bets specifically, it helps to map the transmission mechanism in detail:
- Rate hike expectations rise following hawkish Fed commentary.
- U.S. Treasury yields increase in anticipation of tighter monetary policy.
- The U.S. dollar strengthens, as higher yields attract global capital into dollar-denominated assets.
- Gold's opportunity cost rises because holding bullion means forgoing the now-higher returns available from risk-free instruments.
- Non-USD buyers face additional headwinds, as a stronger dollar makes gold more expensive in local currency terms, suppressing physical demand across Asia and emerging markets.
- Selling pressure accumulates from algorithmic systems, ETF outflows, and momentum traders responding to technical breaks.
This chain reaction is well-understood in theory, but its speed in mid-2026 caught many participants off guard. The repricing was not gradual — it was concentrated, which amplified the price impact. In addition, the relationship between gold and bonds dynamics through economic cycles helps explain why rising yield expectations consistently create such pronounced headwinds for bullion.
| Market Driver | Direction | Effect on Gold |
|---|---|---|
| Fed rate-hike probability (29% to 69% surge) | Hawkish shift | Strongly bearish |
| U.S. dollar appreciation | Strengthening | Bearish |
| Rising real yield expectations | Higher | Bearish |
| Iran-U.S. strikes (sixth consecutive night) | Escalating conflict | Bullish offset (insufficient) |
| Indian physical gold discounts | At one-month high | Bearish |
| 30-day realized volatility (gold equities/ETFs) | ~30% | Neutral to bearish |
From Record Highs to a 30% Drawdown: Contextualising the $4,000 Break
The significance of the $4,000 breach is better appreciated when measured against gold's recent trajectory. The metal reached an all-time high of $5,595.46/oz in January 2026, a peak that reflected peak safe-haven accumulation, central bank buying, and dollar debasement fears. The retreat to approximately $3,999/oz by mid-July 2026 represents a drawdown of roughly 30% from that historic ceiling.
Why Round Numbers Matter More Than They Should
Veteran traders sometimes dismiss psychological price levels as arbitrary, but the data consistently validates their structural importance:
- Concentrated stop-loss placement: Retail and institutional participants alike cluster stop-loss orders around round numbers. When $4,000 breaks, those stops execute automatically, adding selling volume to an already pressured market.
- Algorithmic trigger zones: Systematic trading strategies frequently use round-number thresholds as entry and exit parameters. A confirmed close below $4,000 can activate multiple algorithmic selling programmes simultaneously.
- Media and sentiment amplification: Coverage of a break below $4,000 reaches audiences far beyond active traders, potentially altering retail investor behaviour and gold-backed ETF redemption patterns.
- 30-day realised volatility: Gold mining equities and gold-backed ETFs recorded average 30-day realised volatility of 30% through late June 2026, indicating the market was already on edge ahead of the break.
Physical demand signals reinforced the bearish picture. Indian gold buyers, typically one of the world's most price-sensitive consumer bases, widened discounts to a one-month high in mid-July, signalling that consumers anticipated further price declines and were deliberately deferring purchases. When physical demand fails to provide a floor, the absence of that fundamental support becomes its own bearish signal.
The Counterintuitive Feedback Loop: How Conflict Can Pressure Gold
One of the more sophisticated dynamics at work in mid-2026 involves a feedback loop that inverts conventional safe-haven logic. MUFG analyst Derek Halpenny identified the mechanism: sustained Middle East conflict simultaneously supported the U.S. dollar as a safe-haven currency while generating inflationary pressure through higher oil prices. Rather than pushing capital into gold, this dynamic reinforced the argument for Federal Reserve tightening.
The chain runs as follows:
- Strait of Hormuz disruptions restrict oil shipping traffic, pushing crude prices higher.
- Higher oil prices feed directly into headline inflation readings, keeping CPI elevated.
- Elevated inflation strengthens the Fed's justification for additional rate increases.
- Higher rate expectations increase gold's opportunity cost and pressure the dollar price of bullion.
- A stronger dollar attracts safe-haven flows that might otherwise have supported gold.
This is the counterintuitive reality of gold in a tightening cycle: geopolitical risk that generates inflation can be net bearish for gold if it simultaneously strengthens the case for monetary tightening and dollar appreciation.
Consequently, those who view gold as a safe haven must recognise that its protective qualities are conditional, not absolute, particularly when monetary tightening accelerates simultaneously.
Three Scenarios for Gold's Second-Half 2026 Trajectory
The World Gold Council's analytical framework for the remainder of 2026 centres on a base case that assumes at least one Fed rate hike by October, with concurrent tightening from the Bank of England, Bank of Japan, and European Central Bank maintaining a globally restrictive monetary backdrop. Under this scenario, gold is expected to trade within plus or minus 5% of $4,100/oz, corresponding to a range of approximately $3,895 to $4,305/oz.
The divergence between this base case and more extreme outcomes is substantial:
| Scenario | Primary Trigger | Projected Gold Range |
|---|---|---|
| Base Case | At least one Fed hike by October; coordinated global tightening | $3,895 to $4,305/oz |
| Bear Case | Sustained sub-$4,000 closes; ETF outflows accelerate; technical selling | More than 10% additional downside |
| Bull Case | Global growth deceleration; U.S. contraction evidence; Fed pivot signal | Above $4,500/oz |
The bear case merits particular attention. Historical precedent in gold markets suggests that drawdowns exceeding 10% from key support levels tend to precede structural re-entry by long-term buyers, but the journey to that re-entry point can be extended and painful for near-term holders. Gold mining equities face compressing margins at sub-$4,000 spot prices, and ETF outflows tend to accelerate once a round-number support level is convincingly broken.
The bull case hinges on a clear deterioration in global economic data. MetLife analyst Tani Fukui has maintained a forecast of zero Fed rate hikes in 2026, a position that diverges meaningfully from consensus market pricing. If Fukui's forecast is validated, the repricing event in gold futures would be rapid and directional, with $4,500/oz representing the next meaningful resistance zone. Moreover, central bank gold demand remains a critical underlying variable that could meaningfully shift the trajectory of any recovery scenario.
The next major ASX story will hit our subscribers first
The Forecast Divergence Signal: Reading the Gap Between Analysts and Markets
The gap between MetLife's zero-hike forecast and the market's ~50% probability of a September hike is more than an academic curiosity. In gold markets, wide divergence between institutional forecasting and market-implied probability functions as a volatility predictor. When one side is eventually proven correct by incoming data, the repricing tends to be concentrated and sharp.
Investors who monitor this spread, rather than simply tracking gold's spot price, position themselves to anticipate directional moves before they become obvious. Furthermore, as VT Markets analysis highlights, the key data releases that will resolve this divergence include:
- U.S. core PCE and CPI readings through August 2026
- Q2 GDP growth figures and any revisions to Q1 data
- Labour market reports, particularly non-farm payrolls and unemployment claims
- The September Fed meeting outcome and updated dot plot projections
A Practical Monitoring Framework for Gold's Next Move
Price Level Triggers to Watch
- $4,000/oz: Sustained closes below this threshold confirm the bear case and accelerate pressure on mining equities and ETFs. Each additional day of sub-$4,000 trading increases the probability of algorithmic and stop-loss cascade selling.
- $4,100/oz: The World Gold Council's midpoint base case. A recovery above this level on volume would signal that the monetary policy repricing has been absorbed and that physical and investment demand is stabilising.
- $4,500/oz: The bull case threshold. Reaching this level requires evidence of a meaningful reversal in global growth momentum or a clear Fed pivot signal.
Demand and Positioning Signals
- Indian physical premiums/discounts relative to the LBMA Gold Price PM serve as a real-time indicator of consumer demand appetite. A shift from discounts back to premiums would signal that price-sensitive buyers have returned to the market.
- CFTC Commitment of Traders data for net speculative positioning in gold futures reveals whether large institutional participants are accumulating or reducing exposure.
- Gold-backed ETF flows provide a daily measure of investment demand that responds quickly to both price moves and macro narrative shifts.
Key Data Summary: Gold's Mid-2026 Price Environment
| Metric | Value |
|---|---|
| Spot gold (mid-July 2026 settlement) | ~$3,999/oz |
| All-time high (January 2026) | $5,595.46/oz |
| Drawdown from all-time high | ~30% |
| Weekly loss (week of July 17, 2026) | More than 3% |
| September Fed hike probability (market) | ~50% |
| Peak CME FedWatch repricing | ~69% |
| WGC base case year-end range | $3,895 to $4,305/oz |
| Bull case threshold | Above $4,500/oz |
| Gold mining/ETF 30-day realised volatility | ~30% |
| India physical demand signal | Discounts at one-month high |
Frequently Asked Questions
Why did gold fall below $4,000 when geopolitical conflict was intensifying?
The Federal Reserve's rate-hike probability surged from approximately 29% to nearly 69% within a single week, dramatically increasing gold's opportunity cost. A stronger U.S. dollar, itself a product of higher rate expectations, simultaneously reduced gold's appeal for non-USD buyers. These monetary forces outweighed the safe-haven demand generated by escalating Iran-U.S. strikes, confirming the central premise that gold below $4,000 on Fed rate hike bets reflects a monetary override of geopolitical signals.
How much has gold fallen from its 2026 all-time high?
Gold peaked at $5,595.46/oz in January 2026. The mid-July decline to approximately $3,999/oz represents a drawdown of roughly 30% from that historic peak.
What is the World Gold Council's base case for gold through year-end 2026?
The WGC's base case assumes at least one Fed rate hike by October 2026 alongside globally coordinated tightening, projecting gold within plus or minus 5% of $4,100/oz — a range of approximately $3,895 to $4,305/oz.
What would be required to push gold back above $4,500?
Clear and sustained evidence of global economic deceleration, particularly U.S. GDP contraction or a meaningful deterioration in labour market conditions, would be required to force a significant downward repricing of Fed rate expectations and reignite the safe-haven and store-of-value demand needed to carry gold above $4,500/oz.
What does the MetLife forecast divergence mean for investors?
MetLife's analyst Tani Fukui has forecast zero Fed rate hikes in 2026, compared to a market consensus sitting near 50% probability for September. This wide divergence is itself a volatility signal. When incoming economic data resolves the disagreement, the resulting repricing in gold is likely to be sharp and concentrated, creating meaningful directional opportunity for investors tracking this spread closely.
Disclaimer: This article is for informational purposes only and does not constitute financial advice. Forecasts, scenario projections, and price targets discussed herein are analytical frameworks and not guarantees of future performance. Investors should conduct their own due diligence before making any investment decisions.
Want to Identify the Next Major Mineral Discovery Before the Market Does?
While monetary policy and gold price dynamics shape the macro landscape, significant mineral discoveries on the ASX can generate substantial returns regardless of broader market conditions — and Discovery Alert's proprietary Discovery IQ model delivers real-time alerts the moment those discoveries are announced, as demonstrated by historic outcomes on its dedicated discoveries page. Begin your 14-day free trial at Discovery Alert today and position yourself ahead of the market.