July 17, 2026
When Inflation Becomes a Headwind: Understanding the Gold-Rate-Oil Triangle
Most investors understand that gold tends to rise when inflation climbs. What far fewer appreciate is that this relationship breaks down in a very specific and damaging way when the source of that inflation is an energy shock rather than monetary expansion. The distinction between supply-side and demand-side inflation is not academic. It explains why the gold price correction after oil surge and Fed hike odds repricing produced gold's sharpest weekly decline since June 1, 2026, during a week when headline inflation risks were, paradoxically, rising.
Understanding this dynamic requires stepping back from the price move itself and examining the transmission chain that connects a crude oil surge to a gold price correction. That chain runs through inflation expectations, Federal Reserve policy signals, real yields, and the U.S. dollar. Each link reinforces the next, and together they can overwhelm short-term support for precious metals even when the long-term structural thesis remains entirely intact.
When big ASX news breaks, our subscribers know first
The Oil-to-Gold Transmission Chain: A Mechanism Few Investors Track Precisely
When crude oil price trends spike sharply over a compressed timeframe, the sequence that follows is predictable but frequently misread by retail investors. Rising energy costs push headline inflation readings higher, which shifts market expectations toward tighter monetary policy. For gold, a non-yielding asset, the opportunity cost of ownership rises in direct proportion to how aggressively traders reprice Federal Reserve rate-hike odds.
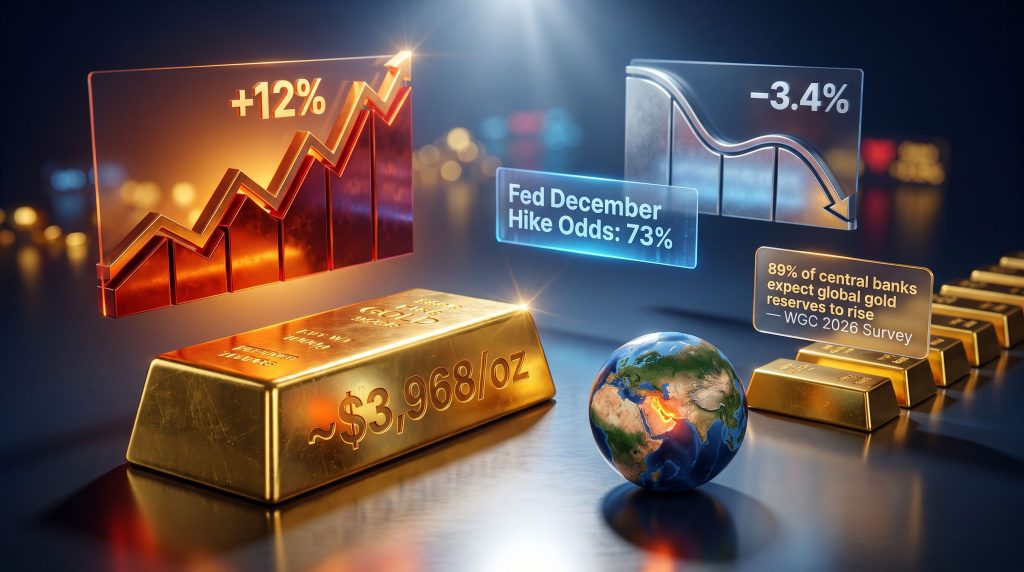
The July 2026 episode illustrates this chain with unusual clarity. Six consecutive days of U.S.-Iran escalation drove crude oil prices approximately 12% higher according to Reuters. That single development was sufficient to overwhelm the price support that had come from softer-than-expected June CPI and PPI data released earlier in the same week.
Why Supply-Side Inflation Is Uniquely Damaging to Gold in the Short Term
Not all inflation affects gold equally. The critical distinction investors must understand is between:
-
Supply-side (cost-push) inflation: Generated by an external shock such as an oil price surge. The Federal Reserve typically responds hawkishly because the inflationary signal is visible and politically sensitive, even if its root cause is beyond the Fed's control.
-
Demand-side (demand-pull) inflation: Generated by excess money creation or fiscal stimulus. The Fed often lags behind this type of inflation, allowing real interest rates to remain negative for extended periods, which is directly gold-positive.
An oil shock triggers a hawkish Fed response that simultaneously strengthens the U.S. dollar and raises real yields. This dual headwind is considerably more corrosive to spot gold prices than demand-pull inflation, where negative real rates typically provide a sustained tailwind. Furthermore, gold as an inflation hedge performs very differently depending on whether the inflation driver is monetary or energy-based.
Key Analytical Insight: The July 2026 correction illustrates a critical distinction for precious metals investors. Geopolitical energy shocks can temporarily invert gold's traditional role as an inflation hedge, because the Federal Reserve's reaction to the inflation reading matters more than the reading itself.
A Statistical Breakdown of the July 2026 Gold Price Correction
The price action during the week ending July 17, 2026, was among the most significant in the preceding twelve months for precious metals markets.
| Metric | Value | Context |
|---|---|---|
| Gold spot price (July 17, 2026) | ~$3,968/oz | Largest weekly loss since June 1, 2026 |
| Weekly gold price decline | -3.4% | Six-day U.S.-Iran escalation period |
| Single-session decline (July 13) | -3.1% (to ~$3,991) | Triggered by naval blockade fears |
| Silver spot price | ~$55.00/oz | Off 1.09% on the session |
| Gold-silver ratio | 72.15 | Up 0.88% on the session |
| Oil price surge (six-day period) | +12% | Driven by Strait of Hormuz disruption risk |
| Fed December rate-hike probability | 73% | Per CME FedWatch Tool, as of July 17 |
| Real rate movement (Q2 range) | 2.00% to 2.28% | Corresponding gold decline from ~$4,650 to ~$4,000 |
The gold-silver ratio analysis reaching 72.15 carries its own analytical significance. This ratio measures how many ounces of silver are required to purchase one ounce of gold. An elevated reading above 70 typically reflects risk-off positioning by institutional participants and reduced expectations for industrial demand. Historically, periods of elevated gold-silver ratios have preceded phases of silver outperformance as sentiment normalises.
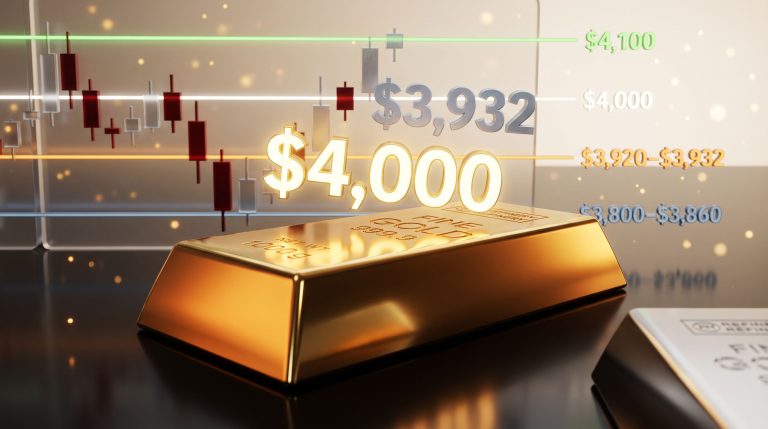
Gold's breach of the $4,000 psychological threshold was notable in its own right. The metal had not tested this level in over seven months prior to the correction, and the drawdown from recent highs represented approximately 28% from peak levels. Technical analysts identified support near $3,900, with a sustained break below that level requiring materially higher rate-hike expectations than markets had priced at the time.
Federal Reserve Policy Signals: The Statements That Repriced the Market
Two senior Federal Reserve officials made public statements during the week ending July 17, 2026, that directly shifted rate expectations in ways gold traders could not ignore.
Dallas Fed President Lorie Logan, speaking in Houston on July 16, became the first of Fed Chair Kevin Warsh's colleagues to publicly advocate for a rate increase, pointing to inflation remaining well above target. Fed Vice Chair Philip Jefferson separately indicated he would be open to raising rates if inflation failed to demonstrate a sustained cooling trajectory.
These statements landed on top of the Federal Reserve's Beige Book release on July 15, which characterised U.S. economic activity as expanding at a slight to moderate pace with prices rising moderately. That combination provided the Fed no near-term justification for easing. Consequently, the gold price and Fed rate hike relationship came sharply into focus for market participants.
What CME FedWatch Data Revealed About Trader Positioning
| Rate Hike Timeline | Probability (July 17, 2026) |
|---|---|
| September 2026 hike | ~71% |
| December 2026 hike | 73-78% |
| July FOMC (July 28-29) | Elevated but not dominant |
StoneX analyst Rhona O'Connell noted on July 15 that positioning across gold and silver was broadly subdued at this point, with physical demand, ETF flows, and speculative bets all quiet ahead of the upcoming FOMC meeting.
The dollar's appreciation as rate-hike odds rose introduced a secondary headwind. A stronger dollar makes gold more expensive for buyers transacting in other currencies, suppressing international demand and applying further downward pressure on spot prices. However, this observation carries an important structural caveat: a dollar that requires an increasingly hawkish Federal Reserve to sustain its value is a dollar facing an underlying fiscal challenge. That fiscal vulnerability, over a longer time horizon, constitutes one of the core arguments for holding gold as a reserve asset.
Bank Forecast Revisions: Why Average Cuts Don't Signal a Changed Thesis
The institutional response to the gold price correction after the oil surge was revealing in its internal logic. Multiple major financial institutions reduced their 2026 average price forecasts while leaving year-end and multi-year targets largely unchanged.
| Institution | 2026 Average Forecast Change | Year-End / Long-Term Target |
|---|---|---|
| HSBC | Cut to $4,560 (from $4,864) | Year-end held at $4,750 |
| Deutsche Bank | Near-term average lowered | Multi-year forecasts intact |
| Bank of America | Near-term average lowered | Multi-year forecasts intact |
| Business Monitor International | 2026 forecast cut | Cited dollar strength and potential de-escalation |
| Bernstein Research | Raised full-year target to $4,533 | H2 2026 target: $4,375; 2027-2030 unchanged |
The distinction between reducing an average price forecast and cutting a year-end target is analytically important. Lowering the average is a mathematical adjustment that reflects the reality of gold trading below $4,200 for longer than anticipated. Holding the year-end target reflects continued conviction in the underlying structural drivers. These are not contradictory positions. They represent acknowledgement that the path became more difficult without revising the destination.
Bernstein Research stands apart from the broader institutional consensus. On July 9, 2026, Bernstein raised its full-year 2026 gold price target to $4,533 per ounce, with an H2 2026 target of $4,375 and unchanged forecasts extending through 2030. Bernstein's core argument is that the primary headwind from rising real rates has largely played out. Real rates moved from 2.00% to 2.28% during the correction, pulling gold from approximately $4,650 to around $4,000. Bernstein's position is that this repricing is complete, and the next directional move will be driven by structural central bank gold demand rather than accelerating Fed tightening.
Central Bank Demand: The Buyer That Rate Cycles Cannot Easily Dislodge
Perhaps the most consequential piece of data underpinning the long-term gold case is the World Gold Council's 2026 Central Bank Gold Reserves Survey, published June 16, 2026. Its findings fundamentally alter the rate-sensitivity calculus for gold markets:
- 89% of central banks surveyed expect global gold reserves to increase over the next 12 months
- A record 45% of surveyed central banks plan to add to their own holdings
- Reserve managers operate on multi-year allocation mandates with institutional constraints that prevent reactive selling when short-term yields move higher
This buyer base behaves in ways that are structurally different from ETF investors or speculative futures traders. Central banks do not liquidate gold positions when the Fed raises rates by 25 basis points. Their allocation decisions are driven by reserve diversification mandates, geopolitical risk hedging, and long-run currency purchasing power concerns, none of which shift meaningfully over a single quarter's rate cycle.
The Three Structural Pillars Behind the 2024-2025 Gold Rally
-
Central bank reserve diversification: Sovereign institutions systematically reducing their exposure to U.S. dollar-denominated assets and reallocating into gold as a neutral reserve asset.
-
Fiscal expansion: Persistent government deficit spending across major economies eroding the long-run purchasing power of fiat currencies, increasing the relative appeal of hard assets.
-
De-dollarization: Bilateral trade settlement arrangements and commodity pricing mechanisms gradually reducing structural global demand for U.S. dollars, creating a long-term headwind for dollar-denominated reserve dominance.
None of these three pillars showed signs of reversal during the July 2026 correction. Furthermore, the gold and bond dynamics that underpin institutional allocation decisions remained broadly supportive of the longer-term thesis. Cutting a near-term price forecast because oil-driven Fed hawkishness has temporarily dominated is not equivalent to abandoning the investment thesis.
The next major ASX story will hit our subscribers first
Asian Physical Demand: The Market Operating in the Opposite Direction
While Western financial markets absorbed the gold price correction with subdued ETF activity and cautious speculative positioning, physical demand from Asia's two largest gold markets moved in a strikingly different direction.
| Retailer | Market | Sales Growth (Year-on-Year) | Period |
|---|---|---|---|
| Chow Tai Fook | Mainland China | +35% (weight-based jewellery) | April-May 2026 |
| Chow Tai Fook | Hong Kong and Macau | +57% (weight-based jewellery) | April-May 2026 |
| Chow Sang Sang | Mainland China | +20%+ (comparable store sales) | April-June 21, 2026 |
| China Overall Jewellery Retail | Mainland China | -3.4% (total category) | June 2026 (NBS data) |
The apparent contradiction between aggregate jewellery retail declining 3.4% year-on-year in June according to China's National Bureau of Statistics and the strong branded retailer performance is explained by the composition of demand. Weight-based gold jewellery, priced by the gram, surged as prices fell approximately 11% month-over-month, attracting value-driven buyers. Fixed-price jewellery, by contrast, lagged in both mainland China and Hong Kong markets.
Key Insight: This behaviour is structurally the inverse of what occurs in ETF markets. In paper gold, falling prices can trigger momentum-driven outflows as investors exit. In physical markets, falling prices stimulate buying. The world's two largest physical gold markets are treating sub-$4,000 gold as an accumulation opportunity rather than a warning signal.
A Four-Step Framework for Interpreting Gold Price Corrections
Not every gold price decline carries the same long-term implications. Investors who can distinguish between a cyclical headwind and a structural reversal are better positioned to respond rationally to events like the July 2026 correction. A practical four-step framework:
Step 1: Identify the inflation source
Determine whether inflation is supply-side (oil shock, supply chain disruption) or demand-side (fiscal stimulus, monetary expansion). Supply-side inflation triggers a hawkish Fed response that is typically gold-negative in the short term but does not alter the long-run structural case.
Step 2: Assess whether structural buyers have changed behaviour
If central bank accumulation is continuing and ETF outflows remain contained, the structural floor under gold prices remains intact. A change in sovereign reserve manager behaviour would be a genuinely bearish signal. A temporary increase in speculative short positioning is not.
Step 3: Evaluate the magnitude of rate repricing
Real rates moved 28 basis points from 2.00% to 2.28% during the Q2 2026 correction. According to J.P. Morgan research, the degree of repricing reflected in current prices is largely complete at these levels, limiting the incremental headwind from further modest rate adjustments.
Step 4: Monitor the FOMC meeting outcome
The July 28-29 FOMC meeting represents the next critical data point. Whether the oil-driven inflation spike sustains into that meeting will determine whether the rate-hike narrative holds or begins to unwind. If crude oil retreats materially in the two weeks prior, historical precedent suggests gold could recover sharply as rate-hike probability recedes.
What the July 2026 Correction Changes and What It Does Not
What Has Changed
- Near-term average price forecasts from major institutions have been revised lower to reflect the mathematical reality of sub-$4,200 gold for an extended period
- Short-term technical momentum is negative, with the metal trading below key psychological thresholds
- Speculative positioning is subdued ahead of the FOMC, limiting the immediate catalyst for a sharp recovery
What Has Not Changed
- The World Gold Council's survey finding that 89% of central banks expect global gold reserves to rise, with a record 45% planning to add to their own holdings
- The three structural drivers behind the 2024-2025 gold rally: de-dollarization, fiscal expansion, and reserve diversification
- Physical demand fundamentals in mainland China, Hong Kong, and Macau, where buyers are actively increasing purchases at lower price levels
- Long-term and year-end price targets from major financial institutions, including HSBC's unchanged year-end target of $4,750 and Bernstein's raised full-year 2026 target of $4,533
Closing Framework: The gold price correction after oil surge and Fed hike odds repricing represents a cyclical event layered on top of a structural trend. The decisive analytical question is not whether gold fell. It did, and sharply. The question is whether the forces that drove the preceding multi-year rally have reversed. By the metrics available as of mid-July 2026, from central bank reserve surveys to Asian physical retailer data to institutional year-end targets, the evidence suggests they have not.
Key Data Reference: July 2026 Gold Market at a Glance
| Indicator | Reading | Implication |
|---|---|---|
| Gold weekly decline | -3.4% | Largest since June 1, 2026 |
| Gold spot price | ~$3,968/oz | Below $4,000 psychological level |
| Silver spot price | ~$55.00/oz | -1.09% on session |
| Gold-silver ratio | 72.15 | Silver underperforming; historically elevated |
| Oil surge (6-day) | +12% | Primary correction catalyst |
| Fed December hike odds | 73% | CME FedWatch, July 17 |
| Central banks planning to add gold | 45% (record) | WGC 2026 Survey |
| Central banks expecting global reserves to rise | 89% | WGC 2026 Survey |
| Chow Tai Fook China sales growth | +35% YoY | Weight-based; April-May 2026 |
| Chow Tai Fook HK/Macau growth | +57% YoY | Weight-based; April-May 2026 |
| Bernstein 2026 gold target | $4,533/oz | Raised July 9, 2026 |
| HSBC 2026 average forecast | $4,560/oz | Cut from $4,864 |
| HSBC year-end target | $4,750/oz | Unchanged |
Sources: Reuters (July 17, 2026), Federal Reserve Beige Book (July 15, 2026), CME Group FedWatch Tool, Bernstein Research via Yahoo Finance (July 9, 2026), World Gold Council Central Bank Gold Reserves Survey 2026 (June 16, 2026), Citi Research via CNBC (June 12, 2026), China National Bureau of Statistics (July 2026), Reuters via Yahoo Finance (July 9, 2026). This article is for informational and educational purposes only and does not constitute financial or investment advice. All forecasts and probability estimates referenced represent third-party views and are subject to change. Precious metals investing involves risk, including possible loss of principal. Always consult a qualified financial adviser before making investment decisions.
Want to Know Which ASX Mineral Discoveries Could Deliver the Next Major Return?
While macro forces like oil shocks and Fed rate cycles dominate precious metals headlines, significant mineral discoveries on the ASX can offer compelling opportunities entirely independent of gold's short-term volatility — and Discovery Alert's proprietary Discovery IQ model delivers real-time alerts the moment those discoveries are announced, turning complex data across 30-plus commodities into clear, actionable insights. Explore historic discovery returns on Discovery Alert's dedicated discoveries page and begin a 14-day free trial to position yourself ahead of the broader market.