June 25, 2026
The Opportunity Cost Problem That's Crushing Gold Right Now
Every asset competes for capital. When the rules of that competition shift, prices move fast. In 2026, the Federal Reserve's signalling around interest rate policy has fundamentally altered the calculus for holding gold, a metal that pays no coupon, earns no dividend, and generates no cash flow. The result has been a sharp, technically meaningful correction that has pushed spot prices below a threshold most market participants considered a line in the sand.
Understanding why gold falls below $4,000 on Fed rate hike bets requires looking beyond the headline number and examining the layered mechanics of monetary policy transmission, currency dynamics, and institutional behaviour that are collectively reshaping precious metals markets in real time. Furthermore, the gold and bond dynamics at play during this cycle add another layer of complexity for investors attempting to position themselves appropriately.
When big ASX news breaks, our subscribers know first
Where Gold Prices Stand and Why the $4,000 Level Matters
Price thresholds in financial markets are not arbitrary. Round numbers attract concentrated positioning from algorithmic trading systems, options structures, and momentum-driven funds. When those levels break, the selling that follows is often disproportionate to the fundamental trigger that caused the breach.
The current snapshot across precious metals tells a clear story of broad-based weakness:
| Metal | Price | Movement | Notable Context |
|---|---|---|---|
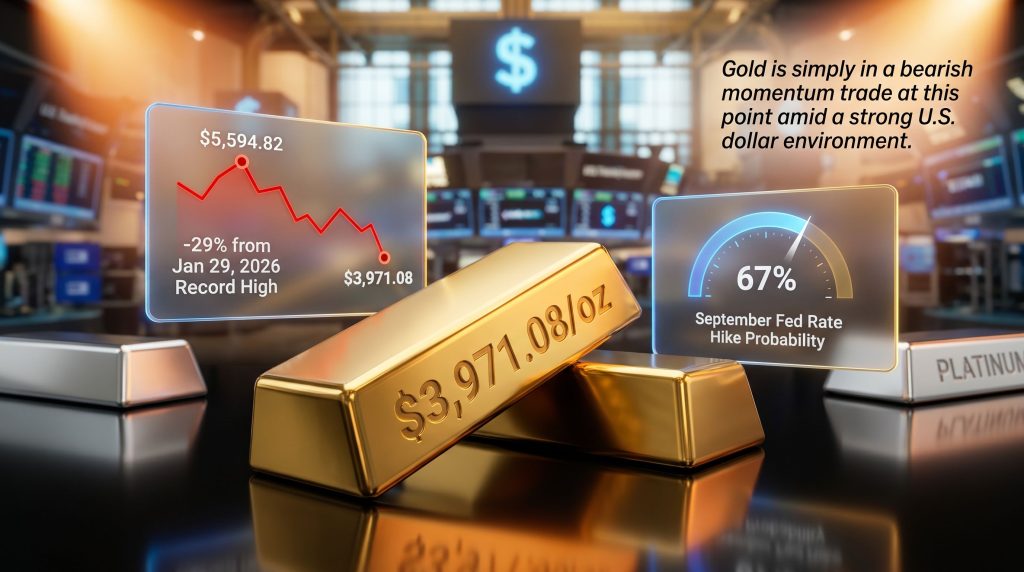
| Spot Gold | $3,971.08/oz | -0.7% | Below $4,000 for first time since Nov 2025 |
| U.S. Gold Futures (Aug) | $3,987/oz | -0.5% | Trending below key psychological level |
| Silver (Spot) | $56.61/oz | -1.4% | Near 7-month low |
| Platinum | $1,560.60/oz | -1.1% | Near 7-month low |
| Palladium | $1,165.63/oz | -0.1% | Near 9-month low |
Gold's decline from its record high of $5,594.82, reached on January 29, 2026, now stands at approximately 29%. That qualifies as a significant correction by any historical measure, particularly within what many commodity analysts still characterise as a structurally intact long-term bull cycle that originated in 2022.
The last time bullion traded below $4,000 was November 2025. The conditions that reversed that weakness involved a combination of easing rate-hike expectations and continued central bank accumulation. Whether those same forces can reassert themselves depends heavily on what incoming inflation data reveals.
The Federal Reserve as the Primary Price Driver
How Rate Expectations Move Gold Before Any Decision Is Made
It is a common misconception that gold prices respond primarily to actual Federal Reserve rate decisions. In practice, the majority of gold's price movement occurs during the expectation formation phase, weeks or months before any policy meeting concludes.
The mechanism works as follows:
- Economic data (inflation, employment, GDP) shifts the probability distribution of future rate decisions.
- Those shifting probabilities are reflected in real-time through instruments like the CME FedWatch Tool.
- Yield differentials between U.S. Treasuries and non-yielding assets like gold widen or narrow based on those probabilities.
- Currency markets reprice the U.S. dollar accordingly.
- Gold, priced in dollars, adjusts to reflect both the yield differential and the currency shift simultaneously.
At present, traders are pricing in approximately a 67% probability of a September 2026 Federal Reserve rate hike, according to the CME FedWatch Tool. Markets are now anticipating three rate increases across 2026, representing a hawkish repricing that has structurally altered gold's near-term outlook.
The 60 to 70% implied probability range for a December rate hike is the critical band that analysts are watching. If that probability rises above 70%, historical patterns suggest institutional gold positioning could deteriorate further, accelerating ETF outflows and compressing producer margins.
The Iran War Inflation Paradox
One of the more counterintuitive dynamics in 2026 is the role conflict-driven inflation is playing in suppressing, rather than supporting, gold prices. The Iran war has contributed meaningfully to elevated inflation readings. Traditionally, this would be interpreted as a gold-positive environment given the metal's long-standing reputation as an inflation hedge.
The paradox is this: the inflation generated by the conflict is accelerating Federal Reserve tightening expectations, which strengthens the U.S. dollar and raises the opportunity cost of holding non-yielding gold. The geopolitical risk premium that would ordinarily lift gold is being neutralised, and in some scenarios reversed, by the monetary policy response that the same conflict is triggering.
This dynamic exposes the conditional nature of gold's inflation hedge narrative. Gold functions effectively as an inflation hedge when central banks are behind the curve and real rates remain negative. When central banks respond aggressively and real yields turn positive, the inflation hedge argument loses traction. Consequently, the gold safe-haven role becomes far more nuanced than many investors initially appreciate.
Dollar Strength as a Structural Amplifier
The U.S. dollar is currently holding near a 13-month high, creating a compounding headwind for gold. A stronger dollar makes gold more expensive for buyers transacting in other currencies, suppressing global demand at precisely the moment institutional sellers are most active.
Matt Simpson, Senior Analyst at StoneX, has described the current environment as a bearish momentum trade driven by U.S. dollar strength rather than a fundamental reassessment of gold's long-term value proposition. That framing is important for investors trying to distinguish between cyclical price weakness and structural deterioration.
How This Rate Cycle Compares to Historical Tightening Periods
Gold's relationship with Federal Reserve tightening is more nuanced than most commentary suggests. A comparative view across cycles reveals important distinctions:
| Fed Tightening Cycle | Gold Performance | Primary Driver of Pressure |
|---|---|---|
| 2004 to 2006 | Modest gains despite hikes | Weak dollar offset rate impact |
| 2015 to 2018 | Initial decline, eventual recovery | Dollar strength, low inflation expectations |
| 2022 to 2023 | Sharp initial fall, then reversal | Inflation hedge demand re-emerged |
| 2026 (Current) | -29% from record high | Conflict-driven inflation + aggressive hike bets |
The 2022 to 2023 cycle is instructive. Gold initially fell sharply as the Fed began its most aggressive tightening campaign in decades, but then staged a significant recovery as inflation proved stickier than anticipated and central bank demand from emerging market institutions accelerated. The question for 2026 is whether that demand floor remains intact under the weight of three anticipated rate hikes.
A critical variable that receives insufficient attention is the PCE (Personal Consumption Expenditures) inflation reading, the Federal Reserve's preferred measure of price pressures. A reading that comes in below consensus expectations could meaningfully reduce the probability of aggressive near-term tightening, potentially triggering a gold recovery. A hot print would have the opposite effect.
What Institutional Investors Are Signalling Right Now
ETF Flows as a Real-Time Sentiment Barometer
Gold-backed exchange-traded funds represent one of the most transparent windows into institutional conviction. SPDR Gold Trust holdings recently declined by 0.3%, a relatively modest figure that nonetheless signals reduced confidence among larger allocators.
The more significant risk is the self-reinforcing dynamic that ETF outflows can create:
- Outflows pressure spot prices lower.
- Lower prices trigger stop-losses and further momentum selling.
- Continued price declines generate negative media coverage.
- Retail and smaller institutional investors follow institutional leads and reduce exposure.
- Additional outflows compound the original price weakness.
This feedback mechanism has historically amplified gold corrections beyond what fundamental analysis would predict, particularly during periods when rate-hike probability shifts are rapid and sentiment-driven.
Revised Bank Forecasts and the Bear vs. Bull Framework
ANZ has already adjusted its year-end gold price target downward by $400 to $5,200, reflecting a more cautious medium-term view. That revision implies the bank still sees meaningful recovery potential from current levels, but acknowledges that the path back will be slower and more volatile than previously anticipated.
The scenario framework currently being discussed among commodity analysts falls into three broad categories:
Bear Case: December rate-hike probability rises above 70%, ETF outflows accelerate, and gold risks capitulation below $3,900, compressing producer margins and triggering further technical selling.
Neutral Case: Rate-hike probability holds in the 60 to 67% range, gold consolidates between $3,900 and $4,100, and the market awaits the next major data catalyst.
Bull Case: PCE inflation surprises to the downside, rate-hike bets recede, the dollar weakens, and gold recovers toward $4,300 and above as short-sellers cover positions.
The Structural Case for Long-Term Support
Despite the severity of the current correction, several structural factors argue against interpreting sub-$4,000 gold as a fundamental breakdown rather than a cyclical dislocation.
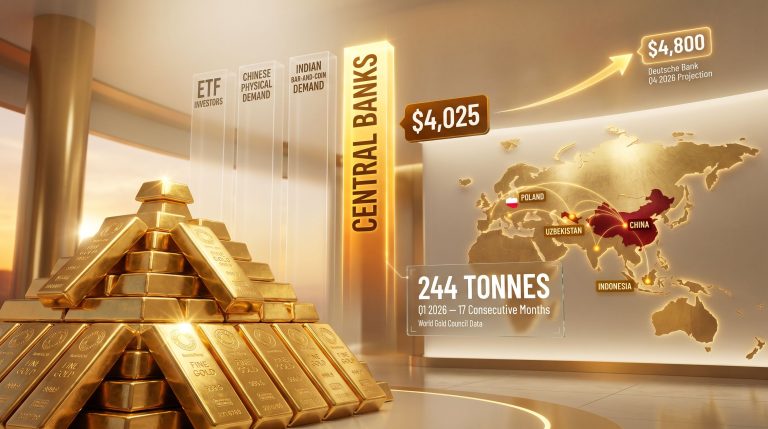
Central bank purchasing behaviour remains one of the most significant underappreciated drivers of gold demand. Emerging market central banks, particularly those in Asia and the Middle East, have been systematically diversifying away from U.S. dollar reserves and adding gold to their balance sheets. This demand is largely price-insensitive in the short term and provides a structural floor that retail and institutional selling must overwhelm before a genuine bear market can take hold.
Additionally, the geopolitical context in the Middle East remains genuinely uncertain. Lebanon and Israel are engaged in negotiations around territorial arrangements in areas affected by the conflict with Hezbollah. If those discussions produce a de-escalation, safe-haven demand for gold could soften further. If tensions re-escalate, the risk premium component of gold's price could reassert itself rapidly.
The next major ASX story will hit our subscribers first
Key Indicators Every Gold Investor Should Be Monitoring
For investors navigating this environment, the following data points represent the most actionable leading indicators:
- CME FedWatch Tool — track September and December rate-hike probabilities on a weekly basis, paying particular attention to whether the December probability crosses the 70% threshold.
- U.S. PCE Inflation Data — the Federal Reserve's preferred inflation gauge; any significant deviation from consensus forecasts in either direction will reprice gold rapidly.
- SPDR Gold Trust Holdings — a real-time proxy for institutional conviction; sustained outflows above 1% in a single reporting period would signal deteriorating sentiment.
- U.S. Dollar Index (DXY) — any extension of the 13-month high will compound gold's existing headwinds through reduced international buying power.
- World Gold Council Quarterly Reports — central bank purchase data provides the clearest picture of structural demand and whether the long-term floor is holding.
How Silver, Platinum, and Palladium Are Responding
The weakness in gold is not occurring in isolation. The entire precious metals complex is experiencing synchronised selling pressure, though for partly different reasons across individual metals. In addition, reviewing the gold-silver ratio analysis during this period offers useful context for understanding relative value shifts across the complex.
Silver's dual identity as both a monetary metal and an industrial commodity makes it particularly sensitive during macro-driven sell-offs. When risk appetite contracts and dollar strength intensifies, silver tends to underperform gold on the downside. Its current decline of 1.4% to $56.61 per ounce, near a seven-month low, is consistent with that pattern.
Platinum's weakness to $1,560.60 per ounce reflects the absence of the diversification benefit investors might expect. Despite its industrial applications, including catalytic converter production and emerging hydrogen economy demand, platinum is not decoupling from the broader precious metals selloff in a meaningful way.
Palladium's position near a nine-month low at $1,165.63 per ounce is perhaps the most telling signal. Palladium has a relatively distinct supply and demand profile compared to gold, and its synchronised weakness confirms that the selling pressure in the precious metals complex is macro-driven rather than metal-specific.
Frequently Asked Questions
Why did gold fall below $4,000 per ounce?
Gold dropped below $4,000 primarily because markets are now pricing in approximately a 67% probability of a September Federal Reserve rate hike, with three total hikes anticipated across 2026. This shift in monetary policy expectations strengthened the U.S. dollar and raised the opportunity cost of holding non-yielding assets like gold.
Does gold always fall during Fed rate hike cycles?
Not necessarily. Historical cycles show mixed results. During the 2004 to 2006 tightening cycle, gold actually rose modestly because a weakening dollar offset rate pressures. The key variable is whether real yields (nominal yields minus inflation expectations) are rising or falling. When real yields rise, gold typically underperforms regardless of the inflation environment.
How significant is the 29% decline from gold's all-time high?
A 29% correction from a record high is material but not unprecedented within a broader bull market. Gold reached $5,594.82 on January 29, 2026, and has since pulled back to near $3,971 per ounce. Whether this constitutes a normal correction within an ongoing bull cycle or the beginning of a more prolonged bear phase depends on how monetary policy expectations evolve over the next two to three quarters.
Could gold recover above $4,000 quickly?
Recovery to above $4,000 is plausible if PCE inflation data surprises to the downside, causing markets to scale back rate-hike expectations. A meaningful shift in CME FedWatch probabilities toward a more dovish outlook would likely trigger short-covering and ETF inflows that could support a rapid technical rebound. The gold price forecast among major institutions still anticipates meaningful recovery potential over the medium term.
What is the biggest risk to gold in the second half of 2026?
The most significant downside risk is a scenario where PCE inflation prints above consensus, December rate-hike probability rises above 70%, and ETF outflows accelerate simultaneously. In that environment, the self-reinforcing selling dynamic described above could push gold meaningfully below $3,900.
Navigating the Correction Without Losing the Long View
The current situation presents a genuine tension between short-term technical weakness and long-term structural support. Gold falls below $4,000 — not as a trivial event — but as a move that removes a critical psychological anchor, activates algorithmic selling programmes, and risks triggering a broader institutional de-risking process if rate-hike expectations continue to firm.
At the same time, the structural pillars that drove gold from its 2022 lows to a record high of nearly $5,600 have not disappeared. Central bank diversification demand, persistent geopolitical uncertainty, and the long-term erosion of confidence in fiat currency systems remain intact as underlying forces.
The most disciplined approach for investors is to separate monetary policy cycle dynamics from structural trend analysis. The former creates volatility and near-term pricing dislocations. The latter determines where gold trades across multi-year horizons. In the current environment, the former is firmly in control, but the latter has not changed.
This article is intended for informational purposes only and does not constitute financial advice. Precious metals markets are subject to significant volatility, and past performance is not indicative of future results. Investors should conduct independent research and consult a qualified financial adviser before making any investment decisions. All price data referenced is sourced from CNBC Metals coverage at cnbc.com/metals/.
Want to Stay Ahead of the Next Major Mineral Discovery Amid Precious Metals Volatility?
While gold navigates rate-driven headwinds, Discovery Alert's proprietary Discovery IQ model delivers real-time alerts on significant ASX mineral discoveries, turning complex market signals into actionable investment opportunities for both short-term traders and long-term investors — explore historic examples of extraordinary discovery returns and begin your 14-day free trial today.