
July 9, 2026
Gold in 2026: Caught Between the Fed's Hawkish Pivot and India's Demand Shock
Few asset classes reveal the mechanics of global monetary policy as clearly as gold. Unlike equities, which can absorb rate increases through earnings growth, or bonds, which reprice mechanically with yield changes, gold occupies a peculiar middle ground. It carries no coupon, generates no dividends, and its valuation depends entirely on the relative attractiveness of holding a non-yielding store of value versus interest-bearing alternatives. When central banks tighten aggressively, gold pays a price. Furthermore, when that tightening coincides with a structural collapse in physical demand from the world's second-largest consumer market, the headwinds compound in ways that even seasoned investors can underestimate.
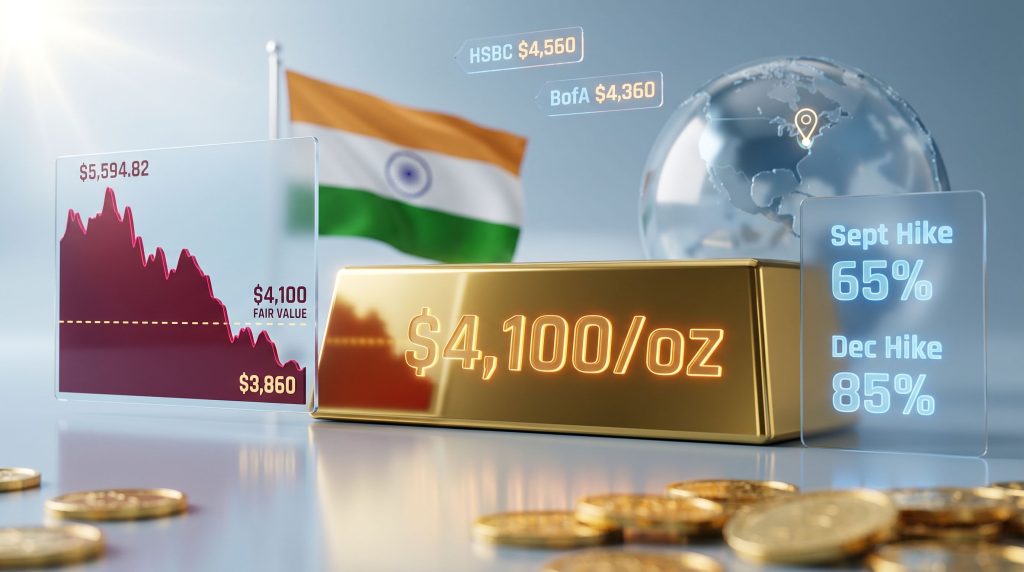
That is precisely the environment gold finds itself in during the second half of 2026. Fed rate hike odds and India's gold import duty impact on gold prices have converged to suppress gold's recovery potential at a critical juncture, leaving the metal anchored near a modelled fair value of approximately $4,100/oz while the directional resolution remains frustratingly elusive.
When big ASX news breaks, our subscribers know first
What Gold's Fair Value Actually Tells Us in 2026
The $4,100/oz Anchor and What It Represents
The World Gold Council's Gold Valuation Framework places gold's fair value at approximately $4,100/oz for H2 2026, establishing a projected trading band of ±5% that spans roughly $3,895/oz to $4,305/oz. This range is not a price target in the equity analyst sense. It is a macro-conditional estimate built on specific assumptions: global GDP growth of approximately 2.9%, US inflation peaking near 3.9%, and at least one Federal Reserve rate increase before year-end.
What makes gold valuation frameworks distinctive is their methodology. Rather than discounting future cash flows or applying earnings multiples, they integrate real yield expectations, currency dynamics, and physical demand flows from central banks, jewellery markets, and institutional investors simultaneously. This multi-variable structure means that fair value is highly sensitive to changes in any single input, particularly the Fed's rate path. Reviewing current gold price forecasts reinforces just how pivotal these inputs are to any directional view.
How Far Gold Has Fallen and What History Suggests
Gold reached an LBMA PM high of $5,594.82/oz in January 2026. At current levels near $4,100, the metal has declined more than 20% from that peak in a relatively compressed timeframe. Historical analysis of gold's correction cycles since 1971 shows that peak-to-trough drawdowns have averaged approximately 36%, which would mathematically imply a potential floor near $3,837/oz. The WGC independently identifies $3,860/oz as a key technical support level, a figure remarkably close to that long-run correction average.
This alignment between historical correction depth and current technical support is not coincidental. It reflects the self-reinforcing nature of institutional positioning: when gold approaches levels that correspond to historically significant drawdown thresholds, both systematic and discretionary sellers tend to reduce exposure simultaneously, accelerating the move toward support.
Gold's current position is not a random pullback. It reflects a convergence of macro repricing, institutional repositioning, and structural demand erosion that may persist through year-end unless key economic variables shift materially.
How Fed Rate Hike Odds Are Suppressing Gold's Recovery
The Opportunity Cost Mechanism Explained
Gold's relationship with interest rates is fundamentally an opportunity cost story. As a non-yielding asset, gold competes directly with US Treasuries, money market instruments, and dollar-denominated deposits. When the probability of rate increases rises, the real yield available on competing assets increases in parallel, reducing gold's relative attractiveness to both institutional allocators and retail investors. The gold and bond dynamics at play here underscore how tightly correlated these two asset classes remain under tightening conditions.
The WGC quantifies this relationship with notable precision. A 25 basis point decline in the 10-year US Treasury yield is estimated to lift gold by approximately 1.75%, or roughly $72/oz from the $4,100 base. The inverse also holds: rising rate expectations subtract from gold's equilibrium price in roughly proportional terms, compressing upside potential with each incremental hawkish signal from Federal Reserve officials.
What CME FedWatch Is Currently Pricing
The CME FedWatch tool, which derives rate-hike probabilities from federal funds futures pricing, currently reflects a significant hawkish shift in market expectations.
| Rate Scenario | Current Probability | Change From Earlier in 2026 | Implication for Gold |
|---|---|---|---|
| September 2026 hike | 65% | Up from ~29% | Primary near-term headwind |
| December 2026 hike | 85% | Material increase | Extended upside suppression |
| No hike through year-end | ~15% | Low probability | Would require significant data shift |
The jump in September hike probability from approximately 29% earlier in the year to 65% now represents a dramatic compression in gold's recovery window. With December odds sitting at 85%, the market is effectively pricing consecutive hikes across H2 2026. The WGC identifies this combination of rising rate expectations and dollar strength as the dominant pricing constraint on gold, outweighing even the geopolitical risk premiums that have historically provided meaningful price support.
The Dollar's Compounding Effect on Gold
Rate-hike expectations do not operate in isolation. They simultaneously reinforce US dollar strength, which creates a dual suppression mechanism on gold prices. A stronger dollar raises the local-currency cost of gold for buyers in emerging markets across Asia, the Middle East, and Africa, dampening physical demand from precisely the price-sensitive consumer segments that underpin baseline gold absorption globally.
This dynamic was illustrated sharply when the US dollar index declined 0.1% following diplomatic signals that Iran had sought negotiations. That minor dollar softening was sufficient to push spot gold to $4,107.69/oz and August futures to $4,117.30, demonstrating just how tightly gold tracks real-time dollar movements under current conditions.
Scenario Map: What Could Break Gold Out of Its Range
Upside scenario (toward $4,500/oz):
- August 2026 US CPI prints below consensus, reducing September hike probability
- Meaningful deterioration in US employment or growth data prompting Fed guidance shift
- Resumption of sustained ETF inflows from institutional allocators
- Escalation of geopolitical conflict beyond current containment
Downside scenario (toward $3,860/oz or below):
- Confirmation of both September and December rate hikes
- Continued heavy ETF outflows through Q3 2026
- No reversal of India's import duty policy
- Further US dollar index strengthening
Base case:
- Gold consolidates near $4,100/oz through Q3 2026, with the August CPI report serving as the critical near-term directional catalyst
The WGC identifies $4,500/oz as the threshold required to confirm a sustained gold recovery. Reaching that level demands either a meaningful economic slowdown, a pivot in Fed guidance, or a significant reversal in institutional outflows. None of these conditions appear imminent based on current market pricing.
India's Import Duty Hike: A Structural Demand Shock
Understanding the Scale of the Policy Change
India enacted a gold import duty increase from 6% to 15% in April 2026, a 9 percentage point rise in the landed cost of imported gold. As the world's second-largest gold consumer with annual demand of approximately 800 tonnes, India's policy decisions carry outsized influence over global physical demand flows. According to analysis from ICICI Direct, the duty hike has significant implications not only for gold prices but also for jewellery stocks across the sector.
This is not the first time India has deployed the import duty lever. The mechanism was used aggressively during the 2013 current account deficit crisis, when duties were raised to 10% to curb gold import expenditure. The historical precedent is instructive: the 2013 hike did reduce formal imports significantly, but it simultaneously incentivised a substantial expansion in gold smuggling networks, partially undermining the policy's intended effect on the current account.
Immediate Market Reaction and Consumer Behaviour
The initial market response inside India was sharp and predictable. Domestic gold prices spiked approximately 6% immediately following the duty announcement as the higher landed cost was passed through to retail jewellery pricing. The consumer response was equally swift:
- Jewellers reported a 70% collapse in consumer demand in the weeks immediately following the hike
- Buyers shifted toward lighter, lower-carat jewellery to manage higher per-gram costs
- Household demand for bars and coins declined as investment-grade gold became less accessible at elevated price points
Why the Price Impact Has Been Smaller Than the Tariff Implies
Despite a 9-percentage-point duty increase, the actual rise in domestic Indian gold prices came in at only 4-6% rather than the full theoretical pass-through. Two structural forces explain the gap:
- Weak consumer demand reduced pricing power for retailers and importers, preventing full cost pass-through
- Rising recycled gold supply as households monetised existing holdings at elevated prices, expanding secondary market supply and capping price appreciation
By mid-June 2026, Indian domestic gold prices had actually fallen below pre-duty-hike levels, driven by the sharp correction in global gold prices. This counterintuitive outcome may eventually stimulate a demand recovery as affordability improves, though that recovery remains contingent on the duty remaining at current levels.
Quantifying the Annual Demand Loss
| Demand Category | Estimated Annual Loss | Share of India's Total Demand |
|---|---|---|
| Jewellery | Primary component | ~10% of category |
| Bars and Coins | Secondary component | Included in total estimate |
| Total Estimated Loss | 50-60 tonnes | ~10% of ~800t annual demand |
The WGC estimates the duty hike will structurally remove 50-60 tonnes from India's annual gold demand, a figure that represents approximately 10% of India's total consumption base. Critically, this demand loss is policy-dependent rather than price-dependent, meaning it will not reverse through gold price declines or improvements in consumer sentiment. Only a reversal of the import duty itself would restore this demand flow.
The Smuggling Wildcard
One of the less-discussed consequences of elevated Indian import duties is the reliable emergence of informal supply channels. Historical precedent from the 2013 duty cycle and current estimates both point toward gold smuggling into India potentially exceeding 100 metric tonnes in 2026, a volume that partially offsets formal import reductions but generates no customs revenue and contributes nothing to official demand statistics.
This creates a meaningful measurement challenge. Official WGC demand figures, which rely on customs and trade data, may understate actual gold consumption in India while simultaneously overstating the duty hike's true demand destruction effect. Investors relying exclusively on official demand statistics should factor this informal supply dynamic into their interpretation of India-related gold data. Furthermore, the World Gold Council's India market update provides additional context on how import tightening is reshaping demand patterns across formal and informal channels alike.
How Major Banks Are Repositioning Their Gold Price Forecasts
Institutional Forecast Revisions: A Comparative View
| Institution | Previous 2026 Forecast | Revised 2026 Forecast | 2027 Forecast | Key Driver |
|---|---|---|---|---|
| HSBC | $4,864/oz | $4,560/oz | $4,925/oz (revised from $5,000) | Hawkish Fed, stronger USD |
| Bank of America | ~$5,070/oz implied | $4,360/oz (-14%) | Not disclosed | Durable hawkish Fed stance |
Both HSBC and Bank of America have made material downward revisions to their 2026 gold price targets, signalling institutional conviction that the Federal Reserve's hawkish pivot is not a transitory signal. Notably, both revised forecasts remain above current spot prices near $4,100/oz, implying modest upside potential from current levels, but they sit dramatically below the January 2026 peak of $5,594.82/oz.
HSBC's 2027 forecast of $4,925/oz suggests the bank anticipates a gradual recovery rather than a sharp reversal, consistent with a scenario in which the Fed eventually eases but does so slowly. Bank of America's 14% downward revision to $4,360/oz is among the more aggressive institutional cuts, reflecting a higher conviction view that consecutive 2026 hikes are probable.
ETF Flows and Central Bank Buying: Institutional Demand Under Pressure
What ETF Outflows Signal About Institutional Positioning
Gold ETFs experienced significant net outflows in H1 2026, a development that carries particular weight given the role of institutional ETF positioning in gold's price discovery. Unlike physical buyers who tend to accumulate gradually, large institutional allocators can reduce ETF positions rapidly, creating abrupt selling pressure that amplifies downside moves.
A key technical consideration is the two-year average gold price of approximately $3,520/oz. Positions in gold ETFs established above this level remain in unrealised loss territory at current prices near $4,100/oz, but those opened at higher recent prices face different dynamics. As rate-hike expectations rise and gold's opportunity cost increases, institutional managers reassessing portfolio allocations may reduce exposure incrementally, sustaining outflow pressure through H2 2026.
Central Bank Buying: Structural Support That Is Decelerating
Central bank gold buying has reached approximately 1,000 tonnes annually since 2022, a sustained pace that has provided a meaningful structural demand floor through multiple macro headwinds. This sovereign buying reflects a diversification trend away from US dollar reserves that has persisted across geopolitical cycles and rate environments.
However, Q1 2026 saw a material deceleration in central bank purchases, reducing the magnitude of this price support precisely when other demand drivers are also weakening. The simultaneous softening of sovereign buying, heavy ETF outflows, and India's structural demand reduction creates a three-way demand compression that limits gold's capacity to recover organically without a macro catalyst.
The next major ASX story will hit our subscribers first
Key Price Levels Every Gold Investor Should Monitor
A Technical and Fundamental Price Map for H2 2026
| Price Level | Significance | Required Conditions |
|---|---|---|
| $4,500/oz | WGC recovery confirmation threshold | Fed pivot, weaker economy, ETF inflows |
| $4,100/oz | Current fair value anchor | Base case stable macro assumptions |
| $3,860/oz | WGC technical support | Continued hikes, ETF outflows, demand weakness |
| $3,837/oz | Historical 36% correction floor | Full historical drawdown scenario |
| $3,800/oz | Analyst downside scenario | Three to four Fed hikes priced in |
The August CPI Report as Gold's Near-Term Catalyst
Among all the variables that could shift gold's trajectory, the August 2026 US CPI report stands out as the most immediate and binary catalyst. A print below consensus expectations would reduce the probability of a September rate hike, potentially supporting a move toward $4,500/oz. A print at or above expectations would cement September hike expectations at current levels or above, increasing the probability of a sustained test of the $3,860/oz technical support.
Fed rate hike odds and India's gold import duty impact on gold prices represent the two structural forces that will define gold's trajectory through year-end. Neither is expected to reverse imminently, but each carries a defined catalyst that could alter the picture. Understanding gold's safe-haven role within a broader portfolio context remains relevant, however, particularly as macro uncertainty persists.
Frequently Asked Questions About Gold's H2 2026 Outlook
Does a Fed Rate Hike Always Push Gold Lower?
Not universally. Gold can rally during rate-hike cycles when inflation rises faster than nominal rates, keeping real yields negative. This dynamic played out in 2022, when aggressive Fed tightening initially failed to suppress gold because inflation was accelerating faster than rate increases could contain it. In the current environment, with inflation peaking near 3.9% and real yields positive and rising, the opportunity cost of holding gold is structurally elevated in a way that differs from the 2022 episode.
How Long Will India's Import Duty Impact Last?
The demand reduction is indefinite until the policy is reversed. India has historically modified import duty regimes when smuggling volumes become economically significant enough to generate political pressure, or when current account deficit metrics improve sufficiently to reduce the fiscal rationale for the tariff. With informal imports estimated to exceed 100 metric tonnes in 2026, that pressure may build over time, though no policy reversal timeline has been communicated.
Is $4,100/oz a Buying Opportunity or a Falling Knife?
At $4,100/oz, gold trades near its WGC-modelled fair value, implying neither deep undervaluation nor significant overpricing relative to current macro assumptions. The risk-reward depends critically on the investor's rate-path view. If September and December hikes are both delivered, the $3,860/oz support level becomes the more relevant reference point. If the Fed pauses, upside toward $4,500/oz becomes plausible. Consequently, long-term structural buyers may find levels near $3,860-$3,900/oz more compelling given the alignment with historical correction averages and the WGC's technical support analysis.
What Would It Take for Gold to Reclaim $5,000/oz?
A return to $5,000/oz would require a fundamental shift in the macro regime: a Fed pivot toward rate cuts, meaningful US dollar weakening, resumption of strong ETF inflows, and a reversal of India's import duty. HSBC's 2027 forecast of $4,925/oz treats this as a plausible but not certain outcome contingent on a more accommodative Fed posture emerging over the next 12 to 18 months. For context, understanding how gold in a recession typically performs provides useful framing for what a macro reversal might look like. None of the prerequisite conditions appear imminent based on current market pricing.
The Combined Headwind Picture Through Year-End
Gold's H2 2026 outlook is defined by a structural equilibrium that is unlikely to resolve cleanly in either direction without a meaningful catalyst. The 65% probability of a September rate hike represents the single most important variable for near-term direction. India's 50-60 tonne annual demand reduction from the 15% import duty adds a policy-driven structural layer that is independent of price levels or geopolitical developments.
The muted gold response to geopolitical escalation involving US military strikes on Iran and retaliatory strikes on Kuwait and Bahrain, where spot gold recovered only 0.8% to $4,107.69/oz, confirms that monetary policy expectations are currently the dominant pricing variable. Geopolitical events create volatility floors but do not alter gold's medium-term trajectory when macro headwinds are this pronounced.
Gold is not in freefall, but it is not in a recovery either. It occupies a macro equilibrium defined by elevated rate expectations, weakening institutional demand, and a structural policy-driven demand loss in its second-largest consumer market. The path to $4,500/oz requires a change in at least two of these three variables simultaneously.
This article is intended for informational purposes only and does not constitute financial or investment advice. Gold price forecasts involve significant uncertainty, and past performance is not indicative of future results. All forecasts and price targets referenced reflect analyst estimates as of the date of publication and are subject to revision.
Want to Know When the Next Major Gold Discovery Hits the ASX?
While gold prices navigate the competing pressures of Fed rate hike expectations and India's import duty shock, Discovery Alert's proprietary Discovery IQ model scans ASX announcements in real time, instantly identifying significant mineral discoveries — including gold — and delivering actionable insights before the broader market reacts. Explore historic discovery returns on Discovery Alert's dedicated discoveries page and begin a 14-day free trial to position ahead of the next major find.