
August 26, 2026
The Compounding Power of Operating Leverage in Gold Mining
Few dynamics in resource investing are as misunderstood as operating leverage in gold mining. Unlike a utility company whose earnings grow in relatively predictable, linear steps tied to regulated tariffs, or a bank whose profitability tracks interest rate cycles, a gold producer inhabits a fundamentally different financial universe. When the gold price rises significantly, earnings do not simply increase in proportion. They accelerate.
Costs, many of which are fixed or semi-fixed, remain relatively stable while revenue per ounce surges. The result is a widening margin that compounds across every ounce produced. The Gold Fields dividend after gold price surge is a striking real-world example of this dynamic playing out at scale.
This is the structural reality underpinning one of the most striking dividend announcements to emerge from the African mining sector in recent memory. Understanding why the numbers moved as dramatically as they did requires unpacking the mechanics of how gold producers translate price environments into shareholder returns, and what the current gold price outlook means for income investors, host governments, and the broader commodity landscape.
When big ASX news breaks, our subscribers know first
Why Gold Miners Are Built Differently as Dividend Instruments
The Non-Linear Relationship Between Price and Payout
Most income investors are trained to think about dividend growth in steady, incremental terms. A mature dividend-paying company might increase its payout by 5% to 10% annually, reflecting earnings growth tied to volume, pricing power, or margin improvement. Gold miners break this mental model entirely.
The key concept is the price-to-AISC spread — the gap between the realised gold price per ounce and the all-in sustaining cost (AISC) per ounce required to maintain existing production. AISC is an industry-standard metric that encompasses mining costs, processing, site administration, sustaining capital expenditure, and royalties. It does not include growth capital, corporate overhead, or debt service, which means the spread itself is not equivalent to net profit.
However, the spread is the most powerful early signal of dividend capacity. When the gold price rises by, say, 30% while AISC rises by only 10% to 13%, the absolute dollar margin per ounce expands dramatically. Multiply that expanded margin across millions of ounces of annual production, and the free cash flow transformation becomes enormous. This is precisely the environment that shaped Gold Fields' first-half 2026 results.
What Mining Boards Weigh Before Declaring a Dividend
Dividend decisions at major gold producers are rarely straightforward. Boards must balance multiple competing considerations simultaneously:
- Realised gold price versus AISC margin: The wider the spread, the greater the dividend capacity
- Free cash flow generation: Operating cash flow minus sustaining capital expenditure is the raw material of shareholder returns
- Debt levels and balance sheet targets: Companies with covenant obligations may prioritise debt reduction over payouts during price surges
- Production trajectory and capital pipeline: Investments in new mines or expansions consume cash that might otherwise flow to shareholders
- Sovereign and regulatory risk across jurisdictions: A mine in political flux carries a risk premium that influences how conservatively boards deploy capital
When all of these variables align favourably simultaneously, as they did for Gold Fields in H1 2026, the result can be a dividend decision that shocks income investors accustomed to more modest payout cycles.
Gold Fields H1 2026: How the Numbers Stack Up
A Simultaneous Price and Volume Event
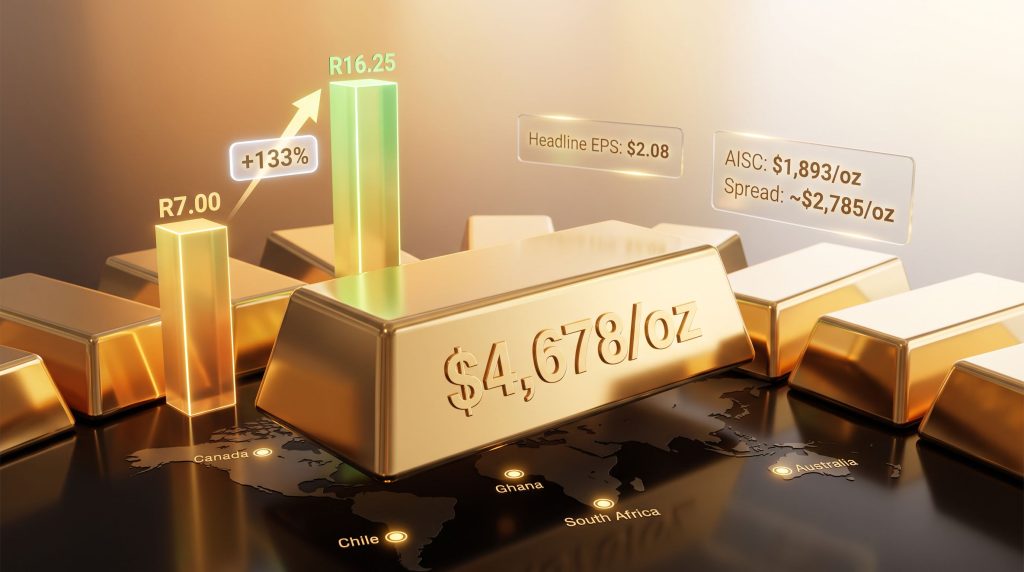
The H1 2026 result for Gold Fields was not simply a gold price story. It was the confluence of two powerful forces arriving at the same time. The company achieved an average realised gold price of $4,678 per ounce across the first six months of 2026, while simultaneously growing attributable gold-equivalent production by 12% year-on-year to 1.267 million ounces.
According to Gold Fields' official H1 2026 results, headline earnings per share climbed 81% to $2.08, up from $1.15 in the comparable prior period.
When a producer increases volume at exactly the same time the commodity price surges, the earnings outcome is multiplicative rather than additive. Each additional ounce produced is worth substantially more than it was a year earlier, meaning the volume uplift is itself worth far more in dollar terms than it would be in a lower-price environment.
The interim dividend was declared at R16.25 per share (approximately $1.01 USD), representing a 133% increase over the R7.00 paid in H1 2025.
Breaking Down the Key Metrics
| Metric | H1 2025 | H1 2026 | Change |
|---|---|---|---|
| Interim Dividend (ZAR/share) | R7.00 | R16.25 | +133% |
| Interim Dividend (USD/share) | ~$0.43 | $1.01 | +135% |
| Headline EPS (USD) | $1.15 | $2.08 | +81% |
| Average Realised Gold Price (USD/oz) | N/A | $4,678 | N/A |
| Attributable Production (Moz) | ~1.13 | 1.267 | +12% |
| All-In Sustaining Cost (USD/oz) | ~$1,676 | $1,893 | +13% |
| Price-to-AISC Spread (USD/oz) | N/A | ~$2,785 | N/A |
What the AISC Spread Actually Tells You
The approximately $2,785 per ounce gap between the realised price and AISC is a number that demands careful interpretation. It is not net profit per ounce. Corporate expenses, financing costs, taxes, royalties to host governments, and non-sustaining capital all reduce what ultimately flows through to earnings and free cash flow.
What the spread does reveal is the scale of the operating cushion available at current price levels. Even after subtracting all the costs excluded from AISC, the remaining margin is sufficient to fund elevated dividends, sustain capital investment programmes across multiple continents, and maintain a robust balance sheet.
Adjusted free cash flow for the full year 2025 reached nearly $3 billion, providing the financial platform from which 2026 distributions are being made. Full-year 2026 production guidance has been maintained at 2.4 to 2.6 million ounces, signalling management's confidence that the first-half performance is not an anomaly but a sustainable operational baseline.
A Multi-Year Capital Return Trajectory
How 2026 Fits Into the Longer Pattern
To appreciate the significance of the 133% interim dividend increase, it helps to situate it within Gold Fields' recent capital return history. The progression reveals a company that has been structurally re-rating its payout capacity as the gold price environment shifted:
| Period | Ordinary Dividend | Additional Capital Returns |
|---|---|---|
| 2024 Full Year | R10.00/share | None disclosed |
| 2025 Full Year | R25.50/share (incl. R18.50 final + R4.50 special component) | US$253M special dividend + US$100M buyback |
| 2025 Total Extra Returns | N/A | ~US$353M combined |
| 2026 H1 Interim | R16.25/share | N/A |
The trajectory from R10.00 in 2024 to R25.50 across the full year 2025 and then R16.25 in just the first half of 2026 is not incremental improvement. It represents a step-change in the company's relationship with its shareholders, driven by an equally step-change shift in the gold price environment. Furthermore, gold mining equities across the broader sector have responded similarly, reflecting just how transformative the current price cycle has been.
Reading the Dividend Signal as an Investor
A 133% interim dividend increase carries information beyond the headline number. Mining companies have historically been conservative about dividend escalation because they have also experienced painful dividend cuts when commodity cycles turn. The fact that Gold Fields' board approved a payout of this magnitude signals something specific: management views the current price environment as sufficiently durable to justify a structural uplift in the payout ratio.
Income-focused investors should assess whether the new payout level remains defensible at significantly lower gold prices. If spot gold were to retrace toward the $3,000 to $3,500 per ounce range, the AISC spread would compress substantially, and dividend moderation would likely follow. Understanding the floor price at which the current payout is sustainable is a critical component of position-sizing for long-term holders.
This article does not constitute financial advice. Past dividend performance is not indicative of future payouts. Investors should conduct their own due diligence.
Geographic Diversification and the Sovereign Risk Dimension
A Multi-Continent Portfolio With Complex Obligations
Gold Fields operates across South Africa, Ghana, Australia, Chile, Peru, and Canada, making it one of the most geographically diversified mid-to-large gold producers globally. African assets include the South Deep mine in South Africa, one of the world's deepest mechanised gold mines, and major operations in Ghana, including the Tarkwa mine.
Geographic diversification across politically and economically varied jurisdictions reduces the concentration risk that can be devastating for single-country producers. However, it also introduces a layered matrix of sovereign obligations, royalty frameworks, and regulatory relationships that become significantly more complex to manage when gold prices are at historically elevated levels.
The Ghana Dimension: Tarkwa and the Fiscal Negotiation Stakes
Ghana is Africa's largest gold producer, and its government has been conducting a review of aspects of its mining and royalty policy framework. Gold Fields has been separately engaged in discussions with Ghanaian authorities regarding the future of its Tarkwa mining lease, a negotiation whose financial stakes have grown considerably as gold prices have climbed.
The arithmetic is straightforward: at $4,678 per ounce, the royalty and tax revenue flowing to the Ghanaian government from each ounce produced is substantially larger in absolute dollar terms than it would be at $2,000 per ounce. Simultaneously, host nation governments face intensifying domestic political pressure to demonstrate that resource extraction windfalls are being captured for national benefit.
This dynamic is not unique to Ghana. Across Africa's gold-producing nations, elevated commodity prices mechanically shift the political economy of resource governance. Export earnings rise, fiscal receipts grow, and the question of how windfall profits are distributed becomes a central policy debate. Gold Fields' strong H1 2026 results illustrate precisely why these negotiations carry a different weight in 2026 than they would have in 2020.
The Macro Forces Sustaining Gold's Price Environment
Three Structural Pillars of the 2025-2026 Gold Rally
The gold price environment that produced Gold Fields' exceptional results did not materialise in isolation. Three overlapping structural forces have driven and sustained bullion prices at historically elevated levels:
-
Central Bank Accumulation: Emerging market central banks, particularly across Asia and the Middle East, have been purchasing gold at sustained elevated rates as they diversify reserve holdings away from USD-denominated instruments. Central bank gold demand has reached volumes not seen since the 1960s, according to the World Gold Council.
-
Geopolitical and Macroeconomic Uncertainty Hedging: Institutional and retail investors have both increased gold allocations as a hedge against geopolitical instability, currency debasement concerns, and the sustained uncertainty created by elevated global debt levels and shifting geopolitical alignments.
-
Investment Demand Expansion: ETF inflows, futures market positioning, and physical bullion demand have collectively amplified price momentum beyond what supply-demand fundamentals in isolation would suggest. Gold's role as a portfolio diversifier has reasserted itself strongly through this cycle.
Why Producers Capture More Upside Than Bullion Holders
A critical distinction that many investors overlook: holding physical gold vs ETFs provides direct exposure to the gold price. Holding shares in a gold producer, however, provides leveraged exposure. The same percentage increase in the gold price applies to every ounce a producer sells, while a significant portion of the cost structure remains relatively fixed.
The margin expands faster than the price, and that expanded margin is multiplied across the entire production base. When production volume increases simultaneously, as occurred for Gold Fields in H1 2026, the effect compounds further. More ounces, each worth more money, each carrying a wider margin.
This is why the Gold Fields dividend after gold price surge illustrates a fundamental truth about gold equity investing: the real returns in a bull market frequently belong to the producers, not the metal holders.
The next major ASX story will hit our subscribers first
Comparing Capital Return Strategies Across the Sector
Gold Fields has deployed multiple capital return mechanisms over the 2024-2026 period, a toolkit increasingly common among well-capitalised gold majors operating in a high-price environment. In addition, gold sector M&A activity has accelerated alongside these elevated returns, as producers with strong balance sheets pursue consolidation opportunities.
| Return Mechanism | Description | Gold Fields Application (2024-2026) |
|---|---|---|
| Ordinary Interim Dividend | Scheduled half-year payout | R7.00 (H1 2025) rising to R16.25 (H1 2026) |
| Ordinary Final Dividend | Scheduled full-year completion payout | R18.50 component of 2025 full-year total |
| Special Dividend | One-off distribution of surplus cash | US$253M declared alongside 2025 results |
| Share Buyback Programme | Capital return via equity reduction | US$100M programme executed in 2025 |
| Growth Reinvestment | Capital expenditure on project pipeline | Ongoing across multi-continent portfolio |
The combination of ordinary dividends, special distributions, and buybacks signals a management team that is actively managing capital allocation across multiple instruments rather than relying on a single mechanism. This approach also provides flexibility: if gold prices moderate, ordinary dividends can be adjusted while special distributions are simply not repeated.
Key Watchpoints for Investors and Market Observers
The Gold Fields H1 2026 result raises a set of forward-looking questions that should inform how investors assess the company's ongoing return potential. For comprehensive dividend history data, Gold Fields' dividends page provides a useful reference point when evaluating payout consistency over time.
-
Gold price sustainability: The entire dividend thesis rests on gold prices remaining materially above AISC levels. Monitoring central bank buying trends, ETF flow data, and geopolitical risk sentiment provides early signals of potential price direction.
-
Tarkwa lease resolution: The outcome of negotiations between Gold Fields and the Ghanaian government over the Tarkwa mining lease will have a material impact on the long-term earnings profile of one of the company's most significant African assets. An unfavourable outcome could alter the cost and production profile substantially.
-
H2 2026 production delivery: Maintained full-year guidance of 2.4 to 2.6 million ounces will be tested across the second half of 2026. Operational disruptions, safety stoppages, or grade underperformance at key mines could create a production shortfall.
-
Cost inflation trajectory: AISC rose 13% year-on-year to $1,893/oz in H1 2026. If cost inflation continues to accelerate, driven by energy prices, labour markets, and supply chain dynamics, the spread compression could arrive from both the cost side and the revenue side simultaneously.
-
Payout ratio evolution: The trajectory from R10.00/share in 2024 to R25.50 across 2025 and R16.25 in just H1 2026 suggests Gold Fields' dividend policy is becoming increasingly responsive to earnings cycles. This is favourable for income investors in a high-price environment but introduces meaningful downside risk if conditions deteriorate.
Consequently, the Gold Fields dividend after gold price surge serves as a compelling case study in how operating leverage, disciplined capital allocation, and a favourable macro backdrop can converge to deliver extraordinary shareholder returns — while also highlighting the risks that come with commodity-dependent income streams.
Disclaimer: This article is intended for informational purposes only and does not constitute financial or investment advice. All figures cited are drawn from Gold Fields' publicly available half-year results and related market reporting. Forecasts, dividend projections, and price assumptions involve inherent uncertainty. Readers should conduct independent research and consult qualified financial advisers before making investment decisions.
Want to Capture the Next Major Resource Discovery Before the Market Does?
Discovery Alert's proprietary Discovery IQ model scans ASX announcements in real time, instantly identifying significant mineral discoveries and turning complex data into actionable investment insights — the same kind of operating leverage that drives extraordinary returns in commodity bull markets can be found at the exploration stage too. Explore historic discoveries and their returns, then begin your 14-day free trial to position yourself ahead of the broader market.