August 6, 2026
When Record Revenue Meets Rising Costs: The Hidden Margin Trap in Gold Mining
There is a pattern that repeats itself across commodity cycles with remarkable consistency. Producers post record revenues, analysts celebrate the numbers, and investors price in continued outperformance. Then, quietly and without fanfare, the cost side of the ledger begins to erode the picture. In 2026, Gold Fields war inflation costs have taken on a distinctly geopolitical character, and for South African and African-domiciled gold producers, the pressure is arriving from multiple directions simultaneously.
The onset of US-Iran hostilities in February 2026 and the subsequent embargo on Strait of Hormuz shipping did not merely disrupt energy markets. It triggered a cascading repricing of virtually every input category that gold mining operations depend on, from diesel and liquefied natural gas through to explosives, cyanide reagents, and freight logistics. Understanding how these costs are materialising in 2026 requires examining not just the headline numbers, but the structural mechanics underneath them.
When big ASX news breaks, our subscribers know first
Why Conflict-Triggered Inflation Hits Miners Differently Than Markets Expect
Most commodity-sector cost models are built around the assumption that input prices move gradually and somewhat independently. A spike in crude oil might pressure diesel costs over several months. Freight rates might tighten seasonally. Chemical feedstocks typically lag energy moves by a quarter or two. This sequential logic allows mine operators time to implement hedging strategies, renegotiate procurement contracts, and adjust operational scheduling.
Conflict-triggered inflation operates on an entirely different timeline. When the Strait of Hormuz closes to commercial shipping, the consequences do not queue up politely. Energy costs, logistics costs, and chemical feedstock costs reprice within weeks, not quarters. For gold producers, this simultaneity creates a compounding effect that is structurally more dangerous than any single input shock.
How Energy Intensity Amplifies the Problem
Consider the mechanics involved. Gold mining is among the most energy-intensive extractive industries because it combines deep underground haulage, continuous ventilation requirements, high-temperature metallurgical processing, and remote site operations that often lack grid power connectivity. Each of these elements carries direct diesel or LNG exposure. When energy prices spike 30% to 70% within a single quarter, the effect on per-ounce production costs is far from marginal.
The additional layer that makes mining particularly vulnerable is the chemical supply chain. Cyanide, used universally in gold leaching processes, is a petrochemical derivative. Its price is therefore doubly exposed: once through the direct energy component of its manufacture, and again through the freight surcharges that apply when maritime shipping routes are disrupted. The same logic applies to ammonium nitrate-based explosives, where chemical feedstock costs and freight surcharges create a compounded inflation effect even when the headline increase appears modest at around 10%.
Breaking Down the Q1 2026 Input Cost Explosion
The granular picture of what Gold Fields war inflation costs looked like across input categories during Q1 2026 is striking for the breadth of its reach.
| Input Category | Cost Increase Since February 2026 | Primary Driver |
|---|---|---|
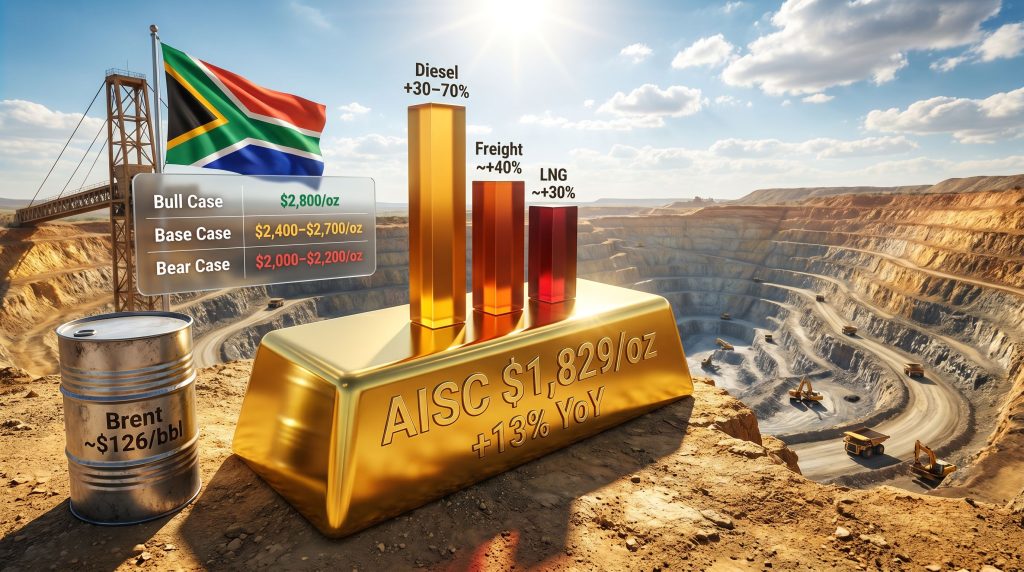
| Diesel | +30% to +70% | Oil price surge; Brent crude peaked near $126/bbl post-airstrikes |
| Freight and Logistics | Approximately +40% | Strait of Hormuz embargo; Cape of Good Hope rerouting costs |
| LNG | Approximately +30% | Broader energy market repricing; supply uncertainty |
| Explosives | Approximately +10% | Chemical feedstock inflation; freight surcharges |
| Cyanide | Approximately +10% | Supply chain ripple effects; logistics cost pass-through |
These are not abstract percentage movements. Diesel, at a 30% to 70% cost increase, directly affects every haulage truck, ventilation system, and on-site generator operating across Gold Fields' multi-continent portfolio. Reuters reporting on Gold Fields' Q1 update confirms that freight at 40% higher directly inflates the landed cost of every consumable, spare part, and reagent shipped to remote mine sites.
The practical consequence of these increases is visible in Q1 2026 reported metrics. All-In Sustaining Costs reached $1,829 per ounce, representing a 13% year-on-year increase. All-In Costs reached $2,046 per ounce, representing a 10% year-on-year increase. Both figures remain within the company's full-year guidance bands, but the buffer is narrower than it appears on the surface.
The Royalty and Currency Layers That Compound Energy Inflation
Energy inflation alone would be a manageable challenge in a high gold price environment. What makes the 2026 cost structure genuinely precarious for Gold Fields and comparable producers is the simultaneous operation of two additional cost amplifiers: gold-price-linked royalties and producer-currency appreciation.
Royalty structures in many African and emerging-market mining jurisdictions are not fixed-rate instruments. They are designed as sliding-scale mechanisms that escalate automatically when commodity prices rise above specified thresholds. Furthermore, this means that the same gold price rally that appears to improve revenue simultaneously increases the royalty burden per ounce produced. For a miner already absorbing energy and logistics inflation, a rising royalty obligation represents a third concurrent pressure rather than a manageable secondary effect.
Currency dynamics add further complexity. When gold prices rise sharply in US dollar terms, producer-country currencies often strengthen against the dollar as capital flows into commodity-exporting nations. A stronger South African rand, for instance, reduces the local-currency advantage that South African producers rely upon to keep labour and local-services costs competitive in USD-reporting terms. Gold Fields' own reporting explicitly identifies higher royalties and stronger producer currencies as contributing factors to Q1 2026 cost escalation alongside global inflationary price impacts.
Gold Fields' 2026 Guidance: How Much Buffer Actually Remains?
The company's full-year 2026 guidance parameters are as follows:
- Gold production: 2.4 to 2.6 million ounces
- All-In Sustaining Costs (AISC): $1,800 to $2,000 per ounce
- All-In Costs (AIC): $2,075 to $2,300 per ounce
With Q1 AISC at $1,829 per ounce, the distance to the guidance ceiling of $2,000 per ounce stands at approximately $171 per ounce, or roughly 8.5% of the upper bound. That margin may look comfortable in isolation, but it needs to be evaluated against what Q2, Q3, and Q4 cost trajectories might look like if energy prices remain elevated or escalate further.
Gold Fields CEO Mike Fraser acknowledged this tension directly in the Q1 operational report. His assessment was that the company remained confident it could hold within guidance, while simultaneously noting that further price increases in input costs would place that guidance under significant stress. Management confirmed that cost mitigation measures had been activated, including fuel efficiency systems and operational optimisations, though the precise quantified impact of these measures was not disclosed.
The revenue picture provides important context. Gold Fields reported revenue of approximately $4.8 billion for the period, compared to approximately $2.9 billion in the prior comparable period. This near-doubling of top-line performance creates an optical illusion of margin safety that does not withstand scrutiny. Revenue growth driven by gold price and mining equities appreciation does not immunise a producer from structural cost deterioration.
Sector-Wide Exposure: Gold Fields Is Not Facing This Alone
The cost pressure dynamic described above is not specific to Gold Fields. Sibanye-Stillwater reported operating cost increases of approximately 15% in Q1 2026, with elevated royalty taxes linked to higher gold prices identified as a partial contributor alongside direct input cost inflation.
| Producer | Q1 2026 Cost Increase | Primary Contributing Factor |
|---|---|---|
| Gold Fields | +13% AISC YoY; +10% AIC YoY | Energy inflation, royalties, currency appreciation |
| Sibanye-Stillwater | Approximately +15% operating costs | Gold price-linked royalty taxes and input costs |
This pattern suggests a sector-wide phenomenon rather than company-specific execution failure. African-domiciled and South African gold producers face a particularly concentrated version of this pressure because they operate across multiple royalty jurisdictions simultaneously, carry significant local currency exposure relative to dollar-denominated revenue, and often depend on logistics infrastructure that routes through conflict-impacted shipping lanes.
However, the geographic diversification that is typically presented as a risk management advantage for large multi-jurisdiction producers paradoxically multiplies exposure in a conflict-driven inflationary cycle. Each operating jurisdiction brings its own royalty structure, its own currency dynamic, and its own logistics exposure. When a single geopolitical event reprices all of these simultaneously, diversification becomes a vector for aggregated cost pressure rather than a hedge against it.
Capital Return Programmes Under Pressure: The Buyback Execution Problem
Gold Fields announced a $100 million capital return programme in February 2026, the same month the US-Iran conflict commenced. The timing proved immediately problematic. Extreme equity market volatility created structural barriers to executing share repurchases at value-accretive prices, and management confirmed that buyback activity had been materially limited due to market conditions.
The share price behaviour during this period illustrates the execution challenge precisely. Gold Fields shares gained approximately 30% in January 2026 alone, reaching a high of approximately R936 per share on January 29. Within two trading sessions, the stock had retreated 15%. A recovery to approximately R928 was followed by a further 28% decline by mid-March. This type of intraday and week-to-week volatility makes systematic buyback execution at disciplined price levels essentially impractical.
The broader sector told the same story. The Van Eck Gold Miners ETF (GDX), which tracks 54 gold equities, gained approximately 36% between January and February 2026. The subsequent 38% retreat in March represented the ETF's worst monthly performance since October 2008. Furthermore, market volatility and gold dynamics meant that gold itself fell approximately 17% in March alone, its worst monthly performance since 1983.
These figures highlight a fundamental tension in capital return strategies during geopolitical crises. A producer may possess the cash generation capacity to execute a buyback but find itself unable to do so responsibly when the equity price is swinging 15% to 30% within days.
The next major ASX story will hit our subscribers first
The Investor Risk Framework: Understanding Asymmetric Downside
The deeper analytical question raised by Gold Fields war inflation costs in 2026 is not whether this year's guidance holds. It is what the margin structure looks like if the gold price environment normalises while operational costs remain elevated.
Arnold van Graan of Nedbank Securities captured this risk with particular clarity in his assessment of the sector. His view, as reported by MiningMX, was that investors should seriously consider what happens to their exposure when gold price momentum fades. His framing implied that the current environment, characterised by record gold prices and temporarily obscured cost inflation, could rapidly shift into a very different calculus for shareholders if commodity prices plateau or decline.
This risk can be mapped across three scenarios:
| Scenario | Gold Price Trajectory | Input Cost Trajectory | Margin Outlook |
|---|---|---|---|
| Bull Case | Sustained above $2,800/oz | Moderate stabilisation post-conflict | Guidance maintained; buybacks resume |
| Base Case | Range-bound $2,400 to $2,700/oz | Gradual easing as conflict de-escalates | Guidance stretched; capex scrutinised |
| Bear Case | Decline toward $2,000 to $2,200/oz | Costs remain elevated; no de-escalation | Guidance breached; dividend risk emerges |
The bear case is particularly instructive because it exposes the operating leverage paradox that makes gold equities attractive in rising price environments and dangerous in reversal scenarios. When AISC approaches $1,800 to $2,000 per ounce and the gold price trades near $2,000 to $2,200 per ounce, the margin per ounce narrows to a level where royalty payments, sustaining capital, and overhead absorption can eliminate profitability entirely for higher-cost operations.
Investors holding undervalued gold mining stocks for their leveraged exposure to the gold price may be systematically underpricing this operational cost risk. The leverage dynamic works powerfully in both directions. A 20% decline in the gold price accompanied by only a 5% reduction in input costs translates to a disproportionately larger reduction in free cash flow per ounce.
The Interest Rate Dimension: Conflict Inflation's Double Impact on Gold
There is a less-discussed mechanism by which the 2026 conflict environment creates headwinds for gold prices even as it superficially supports gold safe haven demand. When conflict-driven energy inflation persists, central banks face pressure to maintain or increase interest rates rather than implementing anticipated cuts. Higher real interest rates increase the opportunity cost of holding non-yielding assets such as gold.
This creates a counterintuitive scenario where geopolitical risk simultaneously drives investors toward gold as a safe haven and raises the fundamental rate-based argument against holding it. The GDX's devastating March 2026 performance reflects exactly this tension. The 38% monthly decline in gold mining equities, occurring simultaneously with a 17% fall in the gold price itself, was not driven by deteriorating mine fundamentals. It was driven by the market re-rating the interest rate outlook and repricing risk-off assets accordingly.
What the Gold Fields Cost Inflation Story Signals for the Broader Sector
The cost pressures emerging from the 2026 conflict cycle carry implications that extend beyond any single producer's quarterly report. Consequently, several structural themes deserve investor attention when considering the gold price outlook for miners:
- War-driven inflation is categorically different from cyclical cost pressure. Its speed, breadth, and simultaneity across input categories leave producers with inadequate response time compared to gradual commodity cycles.
- The margin buffer between current AISC levels and guidance ceilings is narrower than revenue growth figures suggest. A near-doubling of revenue does not provide equivalent protection against cost escalation when that revenue growth is driven by commodity price appreciation rather than volume increases.
- Royalty structures in African and emerging-market mining jurisdictions create an automatic cost amplification mechanism during gold price rallies that is not always visible in headline cost guidance communications.
- Capital return programmes announced during periods of operational strength are structurally vulnerable to execution failure during geopolitical volatility, complicating both shareholder value delivery and investor communications.
- The gold equity investor's leverage thesis requires explicit modelling of scenarios where gold prices stabilise or decline while input costs remain elevated. This asymmetric downside is consistently underweighted in bullish market environments.
- Geographic diversification across multiple mining jurisdictions can aggregate rather than offset cost exposure when the triggering event is a global supply chain disruption rather than a country-specific operational risk.
Disclaimer: This article is intended for informational purposes only and does not constitute financial advice or an investment recommendation. All forecasts, scenario projections, and cost estimates involve inherent uncertainty and should not be relied upon as predictions of future performance. Investors should conduct independent due diligence and consult qualified financial advisers before making any investment decisions. Past cost and revenue performance is not indicative of future results.
Want to Identify the Next Major Mineral Discovery Before the Broader Market Does?
While gold producers navigate rising input costs and tightening margins, Discovery Alert's proprietary Discovery IQ model scans ASX announcements in real time, delivering instant alerts on significant mineral discoveries directly to subscribers — explore historic discoveries and their returns or start your 14-day free trial today to position yourself ahead of the market.