July 18, 2026
The Hidden Cost of Geopolitical Risk: When Safe-Haven Assets Face Monetary Headwinds
Most investors operate under a simple assumption: when the world becomes more dangerous, gold goes up. Wars, sanctions, naval standoffs, and diplomatic crises have historically pushed capital toward the precious metal as a refuge from uncertainty. Yet the relationship between geopolitical stress and gold pricing is far more layered than this intuition suggests.
The current environment surrounding the Strait of Hormuz is exposing one of gold's least understood vulnerabilities: that not all geopolitical crises are inflationary in the same way, and that when a conflict raises oil prices rather than suppressing risk appetite broadly, the resulting monetary policy response can actually work against gold rather than in its favour.
That is precisely the dynamic now at play as Hormuz escalation pressures gold as $4,000 support comes into focus, becoming the defining battleground for precious metals traders in mid-2026.
When big ASX news breaks, our subscribers know first
Why the Strait of Hormuz Matters More Than Any Other Waterway on Earth
The Strait of Hormuz sits between the Gulf of Oman and the Persian Gulf, stretching at its narrowest point to roughly 33 kilometres wide. Despite its modest geographic footprint, it serves as the single most consequential energy chokepoint on the planet. Approximately 20% of the world's daily oil supply transits this corridor, including the bulk of crude exports from Saudi Arabia, the UAE, Kuwait, Iraq, and Iran itself.
What makes the current US-Iran escalation cycle particularly disruptive compared to prior confrontations is the combination of physical and diplomatic deterioration occurring simultaneously. The pattern this time has included:
- Military strike activity targeting assets near the strait itself
- Threatening language from US leadership around toll enforcement on Hormuz passage
- A reversal of that position, followed by escalation language directed at civilian infrastructure in Iran
- Crude oil prices responding by pushing back toward $90 per barrel
The $90/bbl threshold carries outsized significance for inflation modelling. At that level, energy costs begin feeding materially into core services inflation through transportation, logistics, and manufacturing input costs. This transmission effect does not play out overnight, but forward-looking bond and commodity markets begin pricing in the consequences well before the CPI data confirms them. The resulting oil price rally feeds directly into rate-hike expectations, complicating gold's traditional safe-haven role.
From Oil Price to Inflation Expectation: A Step-by-Step Transmission
Understanding how Hormuz disruption flows through to gold requires tracing the full chain of economic causation:
- Physical or threatened disruption to Hormuz shipping raises crude oil spot and futures prices
- Higher crude prices increase petrol, diesel, and jet fuel costs for consumers and businesses
- Energy cost increases flow into transportation, manufacturing, and agricultural production expenses
- Consumer price indices begin reflecting higher headline inflation within one to three monthly readings
- Inflation expectations rise, as measured by breakeven rates embedded in Treasury Inflation-Protected Securities (TIPS)
- The Federal Reserve faces pressure to respond by either delaying rate cuts or actively considering rate increases
- Rising rate expectations increase the opportunity cost of holding non-yielding assets like gold
- Gold prices face downward pressure even as the underlying geopolitical tension would normally support them
This chain explains why the Hormuz escalation is not functioning as a traditional safe-haven catalyst for gold in the current environment. The risk transmission is happening through the oil-inflation-rate channel rather than through a broad flight-to-safety impulse. Understanding these gold safe-haven dynamics is essential for interpreting current price behaviour accurately.
When geopolitical conflict raises oil prices rather than suppressing broader risk appetite, the resulting inflationary pressure can become a headwind for gold by making rate hikes more plausible. This counter-intuitive dynamic is one of the most commonly misunderstood mechanisms in precious metals markets.
The $4,000 Gold Price Level and Its Technical Significance
Round-number price levels function differently in commodity markets than in equity markets. In gold specifically, they tend to attract disproportionate institutional attention because options market positioning, algorithmic stop-loss clusters, and systematic fund mandates frequently reference these levels as benchmarks. The $4,000/oz level has now emerged as what technical analysts call a bull-bear watershed: the dividing line between a consolidation narrative and a structural correction narrative.
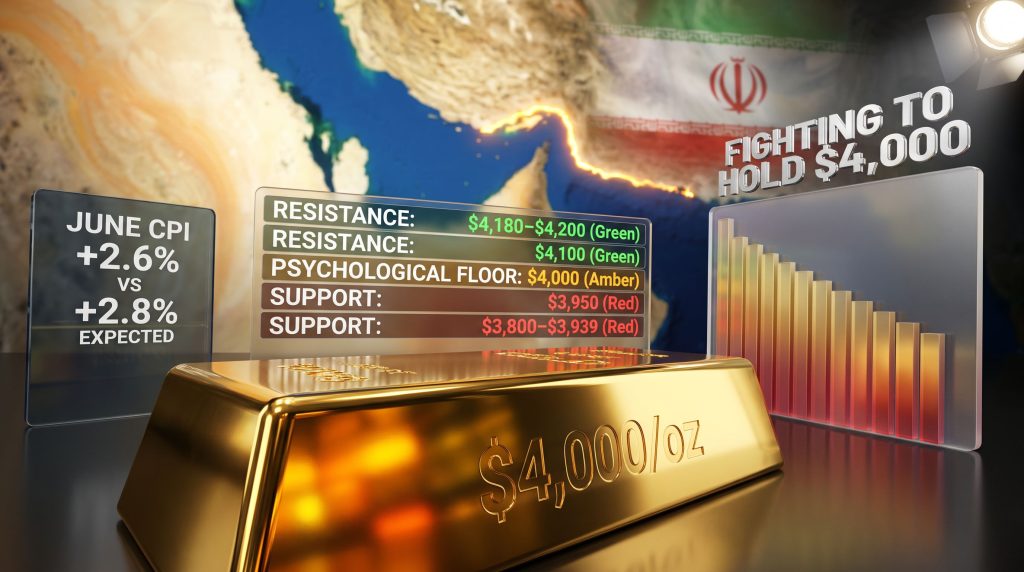
Throughout the trading week of July 14–17, 2026, spot gold prices oscillated within a relatively compressed band, reaching as low as $3,975/oz on the downside and recovering to approximately $4,015/oz by Friday's midday session. US gold futures settled in the $4,005–$4,008 range, underscoring just how contested this zone has become. Analysts tracking the broader gold price forecast note that the $4,000 level now represents one of the most closely watched thresholds in recent memory.
Key Price Levels Traders Are Monitoring in Both Directions
| Direction | Price Level | Market Significance |
|---|---|---|
| Immediate support | $4,000 | Psychological floor; institutional defence zone |
| Secondary support | $3,950 | First technical breakdown target |
| Deeper support | $3,800–$3,939 | Acceleration scenario if selling intensifies |
| Near-term resistance | $4,100 | Prior consolidation ceiling |
| Key resistance zone | $4,180–$4,200 | Bullish momentum reclaim threshold |
| Extended bull target | $4,300 | Breakout level under easing conditions |
What makes the $4,000 zone particularly interesting from a market microstructure perspective is the options market dynamic. Large open interest at the $4,000 strike creates an incentive for certain market participants to defend this level into expiry cycles, while a confirmed close below it would likely trigger cascading algorithmic sell orders from momentum-following strategies.
Summer market conditions compound these dynamics. Reduced institutional participation during the Northern Hemisphere holiday period means that the market depth required to absorb large directional flows is thinner than during peak activity months, making price swings in either direction more pronounced than the underlying fundamental picture might warrant. Analysis from City Index suggests that a sustained break below $4,000 could expose gold to further downside in a sub-$4,000 scenario.
How Monetary Policy Expectations Are Overwhelming Gold's Safe-Haven Premium
The June CPI Report: A Softer Number That Changed Nothing
When the June Consumer Price Index was released showing annualised inflation of +2.6% against a consensus forecast of +2.8%, the initial market reaction was predictably supportive for gold. Softer inflation data normally reduces the likelihood of rate increases, which decreases the opportunity cost of holding the precious metal.
However, the relief proved short-lived. Markets rapidly concluded that the softer reading was a statistical artifact of the prior period's oil price declines, which occurred during a brief window when US-Iran diplomatic engagement appeared to be gaining traction. Once that engagement collapsed and crude prices rebounded toward $90/bbl, the rationale for the softer CPI print evaporated.
This distinction between structural disinflation and energy-driven data noise is critical for gold investors to understand. A genuine cooling in core services inflation would represent a durable positive catalyst for gold. A one-month decline driven by temporarily lower petrol prices, subsequently reversed, provides no such foundation. Furthermore, the gold-bond dynamics at play here reinforce why real yield movements carry such decisive weight for precious metals valuations.
Fed Chair Warsh's Policy Posture: What It Signals for Gold
Newly installed Federal Reserve Chair Kevin Warsh's first semiannual testimony before Congress added a more hawkish dimension to the rate outlook. Rather than maintaining the forward guidance-heavy communication style that characterised prior Fed leadership, Warsh outlined a framework that prioritises direct responsiveness to incoming data over pre-committed policy signals.
For gold markets, this shift carries specific implications:
- Increased policy uncertainty makes it harder for markets to price a definitive rate path, which typically benefits the US dollar as a safe haven over gold
- Data-reactive posture means that a sustained period of elevated inflation driven by oil prices could translate more quickly into rate action than under prior frameworks
- Fed Funds futures repriced following Warsh's testimony, with market-implied probability shifting toward a genuine possibility that the FOMC's next move is a rate hike rather than a rate cut
For context on how significant this shift is, consider gold's behaviour during prior rate-hike cycles:
| Rate-Hike Cycle | Gold Performance |
|---|---|
| 2004–2006 | Initially resilient, then pressured as real yields rose |
| 2015–2018 | Significant underperformance during aggressive tightening |
| 2022–2023 | Underperformed despite inflation, constrained by real yield surge |
The historical pattern is consistent: when real yields rise sharply in response to tighter monetary policy, gold tends to underperform even when nominal inflation remains elevated. Commentary from Pepperstone highlights precisely this headwind, noting that Warsh's testimony has placed the $4,000 level firmly back in focus for near-term traders.
The Stagflation Paradox Explained
Gold's theoretical relationship with stagflation is one of the most discussed and least reliable frameworks in precious metals investing. Stagflation conditions, characterised by slowing economic growth combined with persistent inflation, are widely cited as the ideal environment for gold. The 1970s experience is frequently invoked as evidence.
Yet the current environment is producing a more conflicted outcome for three distinct reasons:
- The rate-hike channel is active: Unlike the 1970s, the Fed in 2026 has both the credibility and the institutional willingness to raise rates aggressively in response to oil-driven inflation, which directly penalises non-yielding assets
- Dollar strength is competing: When rate-hike expectations firm, the US dollar tends to strengthen, and a stronger dollar reduces the purchasing power equivalence of dollar-priced gold for international buyers
- Trader positioning reflects ambiguity: CFTC Commitment of Traders data has shown neither a decisive accumulation of long positions nor a capitulation of existing holdings, reflecting a market that is genuinely uncertain rather than directionally committed
In addition, central bank gold demand continues to provide a structural underpinning for prices, even as short-term monetary policy headwinds create downward pressure.
Three Scenarios for Gold Over the Next 30 Days
Scenario A: De-escalation and Softer Data
Oil retreats below $80/bbl as Hormuz tensions ease. Subsequent CPI readings confirm the June trend. Fed Funds futures reprice toward a hold or cut. Gold reclaims $4,100–$4,180 and rebuilds constructive momentum heading into Q3 2026.
Scenario B: Sustained Escalation and Persistent Inflation
Oil holds above $88–$90/bbl through July and August. Inflation expectations remain anchored above target. Warsh's Fed signals a rate hike before end of 2026. Gold tests $3,950 and potentially $3,800 in an accelerated correction.
Scenario C: Tail-Risk Escalation
Military conflict expands beyond the Strait itself, triggering broad risk-off sentiment across equities, credit, and currencies. Gold's safe-haven premium temporarily overrides rate headwinds, producing a sharp spike toward $4,300+. Historical precedent suggests this effect dissipates quickly unless monetary policy pivots simultaneously.
What to Watch in the Week Ahead
With a sparse macroeconomic data calendar anticipated for the coming week, gold's price direction will be disproportionately sensitive to geopolitical developments and secondary market signals. The key indicators worth tracking closely include:
- Crude oil price trajectory: Moves above or below $90/bbl serve as the primary real-time inflation signal
- Fed Funds futures positioning: Weekly shifts in rate-hike probability provide the most direct leading indicator for gold
- US Dollar Index (DXY): Strength above key resistance levels functions as a structural headwind for dollar-priced gold
- 10-year TIPS real yield: The most important structural anchor for gold valuation in the current environment
- Hormuz shipping reports: Tanker traffic data and any naval incident updates that could reprice the geopolitical risk premium
- CFTC Commitment of Traders data: Speculative net positioning as a contrarian sentiment indicator at extremes
The next major ASX story will hit our subscribers first
Synthesising the Forces Shaping Gold Right Now
| Driver | Current Impact | Directional Bias |
|---|---|---|
| Hormuz escalation via oil channel | Raises inflation expectations and rate-hike risk | Bearish |
| June CPI (+2.6% vs +2.8% expected) | Temporary relief dismissed by markets | Neutral/Bearish |
| Fed Chair Warsh's hawkish posture | Increases rate-hike probability | Bearish |
| $4,000 psychological support | Institutional defence zone, options market anchor | Conditionally Bullish |
| Summer liquidity thinning | Amplifies volatility in both directions | Uncertain |
| Geopolitical risk premium | Provides a floor but not a sustained catalyst | Mildly Supportive |
A sustained close above $4,000 would confirm that institutional buyers are treating this level as a genuine accumulation zone, opening a pathway toward the $4,100–$4,180 resistance band. Consequently, a confirmed break below would activate algorithmic selling, shift the market narrative from consolidation to correction, and accelerate a move toward the $3,950 and $3,800 support zones that represent the next meaningful technical floors.
The coming weeks will test whether gold's structural bull case, built on central bank accumulation, de-dollarisation trends, and long-term inflation concerns, can withstand a monetary policy environment that has rarely been this explicitly hostile to non-yielding assets. Indeed, Hormuz escalation pressures gold as $4,000 support comes into focus in a way that reveals just how nuanced the interplay between geopolitical risk and monetary policy has become.
Disclaimer: This article is intended for informational purposes only and does not constitute financial advice. All price levels, scenario projections, and market forecasts discussed are based on publicly available information and analytical frameworks. Past performance of gold or any asset class during prior economic cycles does not guarantee future results. Readers should conduct their own research and consult a qualified financial adviser before making investment decisions.
Want to Stay Ahead of the Next Major Mineral Discovery Before the Market Moves?
While macro forces like Hormuz escalation and Fed policy shape gold's short-term trajectory, Discovery Alert's proprietary Discovery IQ model scans ASX announcements in real time, instantly identifying significant mineral discoveries and delivering actionable alerts to subscribers before the broader market reacts — explore historic discovery returns or begin your 14-day free trial at Discovery Alert to position yourself ahead of the next major find.