June 15, 2026
Gold's Inflation Premium Is Unwinding: What the Iran Peace Deal Really Means for Fed Rate Expectations
Commodity markets have long understood that oil is not merely an energy source — it is an inflation signal, a monetary policy input, and a geopolitical barometer rolled into a single benchmark price. When structural disruptions to oil supply are resolved, the effects ripple through CPI forecasts, central bank probability models, and ultimately into the pricing of non-yielding assets like gold. Understanding this transmission mechanism is the starting point for interpreting what the US-Iran peace framework actually means for gold in 2026 — and why the Iran peace deal gold price Fed hike odds relationship is more nuanced than a straightforward safe-haven narrative.
When big ASX news breaks, our subscribers know first
The Three-Variable Compression Event That Repriced Gold in a Single Session
Most significant gold price movements are driven by a single dominant factor: a currency shock, a central bank announcement, or a geopolitical escalation. What made the June 2026 repricing event unusual was the simultaneous movement of three interconnected macro variables within hours of each other.
The US-Iran peace framework, with a formal signing planned in Switzerland, triggered the following chain reaction:
- Plans to reopen the Strait of Hormuz removed a structural supply-risk premium from global energy markets, with Brent crude falling more than 4% on the announcement
- Lower expected oil prices reduced headline CPI projections, weakening the Federal Reserve's justification for maintaining a restrictive rate posture
- The US dollar simultaneously fell to a 10-day low, amplifying gold's repricing by reducing the cost of gold for non-USD buyers globally
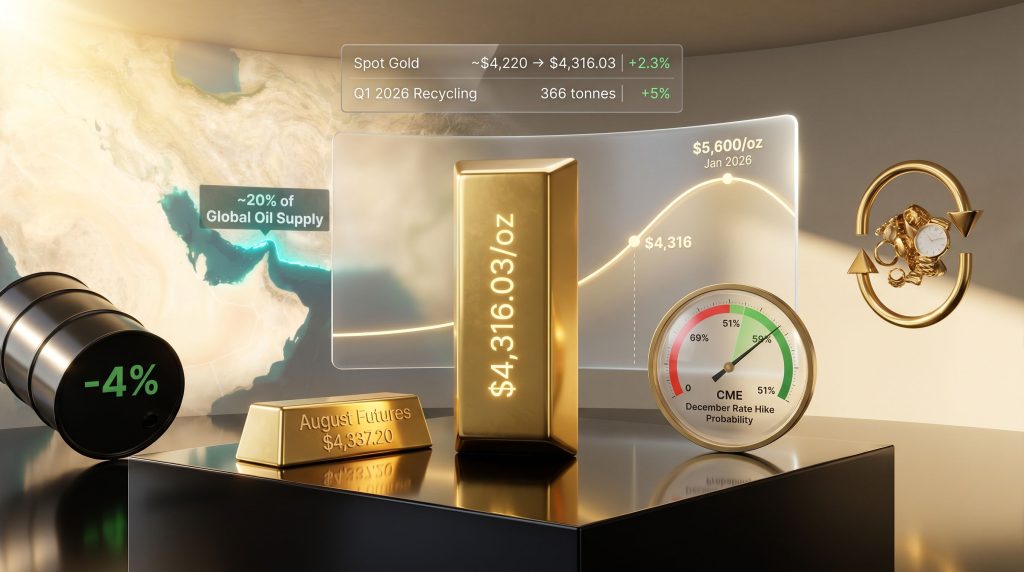
- Spot gold advanced 2.3% to $4,316.03/oz, its strongest level since June 9, while August gold futures gained 2.3% to $4,337.20/oz, extending a third consecutive session of gains
The critical insight here is that gold was not rising because the world became more dangerous or uncertain. It rose because the world became less inflationary — and that distinction carries entirely different implications for how long the move can be sustained.
The Strait of Hormuz is the passage through which approximately 20% of global oil supply transits. When military tensions between the US, Israel, and Iran restricted navigation through this corridor, energy markets priced in a persistent supply-risk premium that flowed directly into headline inflation readings. That premium is now being unwound.
Key Insight: The gold market is not reacting to peace as a geopolitical event. It is reacting to peace as a disinflation catalyst — one that directly alters the Federal Reserve's rate calculus and reduces the opportunity cost of holding non-yielding assets.
How the Iran Peace Deal Collapsed Fed Hike Odds by 18 Percentage Points
The most precise indicator of gold's sensitivity to this event is the shift in CME FedWatch implied probabilities for a December 2026 Federal Reserve rate hike. This tool derives market-consensus rate expectations from federal funds futures contracts, providing a real-time read on how traders are pricing monetary policy outcomes.
Prior to the peace announcement, the implied probability of a December hike sat at 69% — a level consistent with persistent energy-driven inflation keeping the Fed on a tightening path. Following the deal, that reading compressed to 51% within a single trading session, representing an 18-percentage-point collapse in rate expectations. The gold price forecast for the near term has shifted materially as a result.
| Macro Variable | Pre-Deal Level | Post-Deal Level | Change |
|---|---|---|---|
| December Fed Hike Probability | 69% | 51% | −18 percentage points |
| Spot Gold (USD/oz) | ~$4,220 | $4,316.03 | +2.3% |
| August Gold Futures | ~$4,237 | $4,337.20 | +2.3% |
| Brent Crude Price Move | Baseline | −4%+ | Sharp decline |
| USD Index | Baseline | 10-day low | Weakened |
The transmission mechanism is straightforward but often underappreciated in mainstream coverage. Lower oil prices reduce the energy component of consumer price indices, which lowers headline CPI readings. Lower headline CPI reduces the argument for additional rate hikes. Reduced rate-hike expectations lower the real yield on competing interest-bearing assets, which in turn reduces the opportunity cost of holding gold. KCM Trade's Tim Waterer attributed the 18-point decline in December rate-hike odds directly to lower oil prices and a weaker US dollar following the Strait of Hormuz reopening.
The Dollar-Gold Feedback Loop Most Investors Underestimate
A detail that frequently gets lost in single-factor gold analysis is the compounding effect of dollar weakness operating simultaneously with falling rate expectations. A weaker dollar increases gold's purchasing power for non-USD buyers — broadening effective demand geographically.
When both channels operate simultaneously, as they did on June 15, the repricing tends to be sharper and faster than either variable alone would produce. This dual-channel dynamic is historically one of gold's most powerful structural supports and one of the clearest signals that a move has macro depth rather than being driven purely by speculative positioning. Furthermore, the gold and bond dynamics at play here reinforce why rate expectations remain so central to gold's valuation.
Gold at $4,316/oz: Understanding the 20% Gap From January's Record Peak
To contextualise the current price level, it is essential to understand why gold fell in the first place. Gold reached a record high of approximately $5,600/oz in January 2026, driven by a convergence of fiscal deficit anxiety, aggressive central bank accumulation across emerging markets, and escalating geopolitical tensions in the Middle East following the US-Israeli conflict with Iran.
The subsequent decline to the $4,200–$4,300/oz range — a drawdown of roughly 20% — was not a reflection of weakening structural demand. Instead, it resulted from a specific monetary dynamic: higher oil prices from Strait of Hormuz disruptions pushed inflation expectations upward, which reinforced the market consensus that the Fed would keep rates elevated for longer.
Higher expected real yields increased the opportunity cost of holding gold, and a stronger dollar further compressed demand from international buyers. The Iran deal reverses the proximate cause of that decline. However, it does not, by itself, restore the January conditions.
What Structural Demand Means in Practice
OCBC noted that the long-term demand pillars supporting gold — concerns over currency debasement, fiscal risk, and geopolitical fragmentation — remain structurally intact regardless of the peace framework. In fact, OCBC suggested that lower energy-driven inflation could actually reinforce these themes by reducing the Fed's ability to justify a hawkish stance. This aligns closely with how central bank gold demand has continued to provide a structural floor beneath prices.
The three long-term demand pillars identified by OCBC deserve specific unpacking because each operates through a different mechanism:
- Currency debasement concerns are driven by elevated sovereign debt levels across G7 economies. When governments run persistent structural deficits, the long-term purchasing power of their currencies becomes increasingly uncertain, incentivising allocation toward hard assets.
- Fiscal risk premiums reflect the market's assessment that structural deficit trajectories in the US and EU cannot be resolved without some combination of inflation, financial repression, or currency devaluation — all of which benefit gold.
- Geopolitical fragmentation refers to the broader trend of dollar-denominated reserve assets losing credibility as a neutral store of value, particularly for central banks in non-aligned economies seeking alternatives to US Treasury holdings.
None of these three drivers disappeared with the Iran deal. They represent the floor beneath gold's medium-term valuation. Moreover, understanding gold in recessionary periods provides additional context for why these structural supports tend to persist even when short-term catalysts shift.
The Warsh Fed Statement: Two Scenarios, One Decision Point
Wednesday's Federal Reserve policy announcement carries unusual significance because it represents Chair Kevin Warsh's first rate decision in the role. Markets are broadly expecting rates to remain unchanged. The variable that will move gold is not the decision itself — it is Warsh's language on inflation, energy prices, and the forward policy path.
The CME FedWatch implied probability of a December rate hike serves as the single most actionable indicator for gold's near-term direction following the statement. Analysts at Crux Investor Research have mapped the following scenario framework:
| CME FedWatch Reading (Post-Statement) | Gold Market Implication | Price Target Range |
|---|---|---|
| ≤ 40% | Strong bull case confirmed | Toward $4,500/oz; $5,400–$6,300/oz targets become credible |
| 41%–45% | Moderate bull — cautious optimism | $4,400–$4,500/oz range |
| 46%–54% | Neutral — current equilibrium maintained | $4,200–$4,350/oz consolidation |
| 55%–60% | Mild bear — rate pressure resurfaces | Struggle to hold above $4,300/oz |
| ≥ 60% | Strong bear — December hike re-priced in | Downside toward $4,000/oz |
Scenario A: Disinflation Confirmed, Bull Case Activated
If Warsh explicitly acknowledges that declining energy prices are materially reducing inflationary pressure and signals a data-dependent pause, December hike odds would likely fall to 40% or below. Under this scenario, gold price forecast models suggest gold could advance toward $4,500/oz in the near term and begin pricing in the structural conditions underpinning long-term analyst targets of $5,400–$6,300/oz.
Reaching those upper targets requires the Iran peace signing in Switzerland to proceed without complications, maintaining the oil supply normalisation narrative. It also requires the dollar to remain under pressure, sustaining demand from international buyers.
Scenario B: Core Inflation Remains Sticky, Bear Case Activated
If Warsh signals that while energy prices have declined, core inflation remains elevated and December rate-hike optionality must be preserved, hike odds could stabilise near 51% or drift back toward 60–69%. This would recreate the monetary tightening premium that drove gold's 20% decline from its January peak.
Critically, the bear case does not require a new negative catalyst. It requires only the absence of confirmation that the disinflation path is underway. A reading of 60% or higher post-statement would materially weaken the case for any near-term advance above $4,400/oz.
Risk Note: The primary downside risk for gold is not a new geopolitical shock — it is Fed guidance that characterises lower energy prices as insufficient to change the broader inflation outlook, effectively signalling that the tightening cycle remains open-ended.
Rising Gold Prices and the Recycling Supply Response
One supply-side dynamic that receives insufficient attention in standard gold market commentary is the price-elastic recycling response. As gold prices rise, the economic value of recovering gold from secondary sources — jewellery, electronics, industrial scrap, and legacy timepieces — increases proportionally, introducing a natural counterforce to demand-driven price gains.
Global gold recycling volumes rose 5% in Q1 2026 to 366 tonnes, a direct reflection of prices near $4,200/oz making scrap recovery economically compelling for a broader set of holders. Gold Traders dealer Jon White highlighted a concrete illustration of this dynamic: the gold content of an Omega Constellation watch was valued at approximately £5,750 (~$7,749 USD) — roughly 35% above its estimated auction value of £4,000–£4,500.
When intrinsic metal value exceeds market resale value by that margin, the financial incentive to recycle rather than sell through traditional channels becomes difficult to ignore. As gold approaches $4,500/oz, industry analysts expect recycling supply to accelerate materially, creating a ceiling pressure dynamic that partially offsets demand-driven appreciation.
Supply Ceiling Warning: Long-term analyst price targets of $5,400–$6,300/oz implicitly require that sustained structural demand from central banks and institutional investors outpaces the recycling supply response — a condition that has historically held in strong bull markets but becomes more contested as prices rise.
The next major ASX story will hit our subscribers first
Critical Minerals Negotiations: The Concurrent Policy Layer
The Fed decision, Iran's formal peace signing, and G7-level critical minerals negotiations are all scheduled to occur within the same five-day window — an unusual clustering of independent market-moving events that amplifies cross-asset volatility risk beyond what any single event would generate in isolation. Furthermore, the critical minerals demand surge adds another layer of complexity to an already intricate macro environment.
On the critical minerals front, the Trump administration is pursuing bilateral agreements with Japan and the EU covering:
- Heavy rare earths
- Antimony
- Graphite
- Tungsten
All four categories face active Chinese export restrictions, making Western supply-chain alternatives a strategic priority. The core policy disagreement within these negotiations involves whether to establish coordinated pricing mechanisms across allied buyers or rely on tax credits and incentive structures.
The National Mining Association's CEO Rich Nolan publicly urged US Trade Representative Greer to prioritise incentive frameworks over price coordination, citing concerns about market distortion. EY's Blake Harden characterised the current environment as one where uncertainty over policy design is itself a deterrent to investment — a policy design risk where the absence of regulatory clarity compounds the already-challenging economics of developing critical minerals projects against Chinese benchmark pricing.
Until binding G7 agreements are reached, project economics for critical minerals miners remain exposed to benchmark price uncertainty set by Chinese export policies rather than Western market dynamics.
Frequently Asked Questions
Why Did the Iran Peace Deal Cause Gold to Rise?
The peace framework reduced geopolitical tension and triggered a sharp decline in oil prices by removing supply-risk premium from the Strait of Hormuz. Lower oil prices reduce headline inflation expectations, which in turn reduce the probability of Federal Reserve rate hikes. Lower expected rates reduce the opportunity cost of holding non-yielding assets like gold, increasing its relative attractiveness to investors.
What Are the Key Gold Price Levels to Watch in 2026?
- $4,316/oz — Spot price following the Iran deal announcement (June 15, 2026)
- $4,400–$4,500/oz — Near-term bull case if December Fed hike odds fall below 45%
- $5,400–$6,300/oz — Long-term analyst consensus range under a full Fed pivot scenario
- $5,600/oz — January 2026 record high; benchmark for measuring the current drawdown
How Does the CME FedWatch Tool Work for Gold Investors?
CME FedWatch derives implied probabilities for Federal Reserve rate decisions from federal funds futures contract pricing. For gold investors, it functions as a real-time monetary policy barometer. When implied rate-hike probability falls, real yield expectations decline, reducing the relative appeal of interest-bearing alternatives and making gold more competitive as a store of value.
What Is the Risk That Gold Reverses After the Fed Statement?
The primary reversal risk is Fed language indicating that core inflation remains elevated despite lower energy prices, keeping December rate-hike odds near or above 55%. A reading of 60% or higher would signal that the monetary tightening cycle remains open-ended, potentially recreating the conditions behind gold's 20% decline from its January peak. As reported by CNBC, renewed tensions had previously dampened peace hopes and clouded the interest rate outlook — a dynamic that remains a live risk.
The Decision Matrix: Gold's Week Ahead
| Event | Bull Case Outcome | Bear Case Outcome |
|---|---|---|
| Fed Statement (Warsh) | Disinflation acknowledged; odds fall to ≤40% | Inflation risks flagged as persistent; odds hold at 51%+ |
| Iran Peace Signing | Proceeds without complications; oil stays suppressed | Delays or complications; energy risk premium returns |
| CME FedWatch Reading | ≤45% supports $4,500/oz target | ≥55% weakens case for further gains |
| G7 Critical Minerals Talks | Incentive framework advances; supply chain clarity improves | Negotiations stall; pricing uncertainty persists |
| Gold Recycling Response | Demand outpaces recycling supply | Accelerated volumes above $4,500/oz cap gains |
What the current setup makes clear is that gold at $4,316/oz represents a market in transition rather than a market with conviction. The Iran peace deal gold price Fed hike odds dynamic has removed a specific inflationary headwind and collapsed December Fed hike odds by 18 percentage points in a single session. However, the path from here requires confirmation — from Warsh's language, from the formal signing process, and from continued dollar weakness.
The structural demand floor beneath gold remains intact. Currency debasement risk, fiscal deficit trajectories across G7 economies, and geopolitical fragmentation have not been resolved by a Middle East peace framework. What the Iran deal has done is remove the obstacle to gold's structural bull case reasserting itself. Whether that case becomes the dominant market narrative depends almost entirely on the words that Chair Warsh chooses on Wednesday.
This article is for informational purposes only and does not constitute financial or investment advice. All price targets, scenario projections, and probability estimates are based on publicly available market data and analyst commentary as of June 15, 2026, and are subject to change. Investors should conduct their own research and consult qualified financial advisers before making investment decisions.
Want to Catch the Next Major Mineral Discovery Before the Market Does?
While gold's macro dynamics unfold through Fed statements and geopolitical frameworks, Discovery Alert's proprietary Discovery IQ model scans ASX announcements in real time — instantly identifying significant mineral discoveries and translating complex data into actionable opportunities for investors at every level. Explore how historic discoveries have generated substantial returns on Discovery Alert's dedicated discoveries page, and begin your 14-day free trial today to position yourself ahead of the broader market.