
May 16, 2026
The structural dynamics reshaping global financial markets have positioned precious metals at the forefront of portfolio strategy discussions. Within this complex environment, understanding why gold continues to buck trends and outperform stocks requires examining the intersection of macroeconomic imbalances, institutional behaviour shifts, and technological developments. Moreover, the historic gold surge explanation reveals how multiple structural factors converge to create sustained demand pressure that conventional equity markets struggle to replicate.
Economic Foundations Supporting Gold's Market Leadership
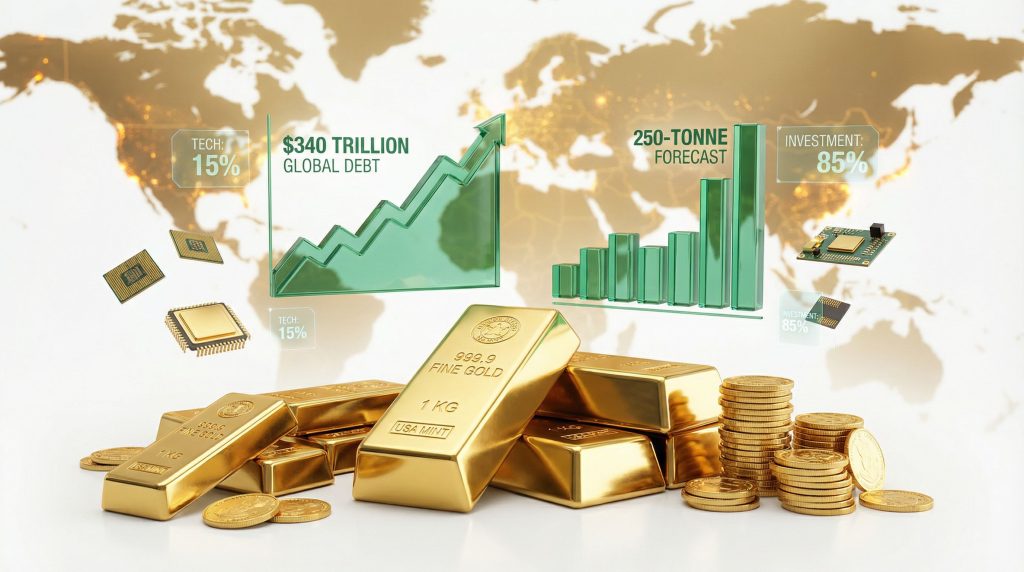
Structural economic imbalances across developed economies create fundamental conditions favouring non-currency assets over traditional financial instruments. Global debt levels have reached historically unprecedented proportions, with total worldwide debt exceeding $340 trillion by 2025, representing approximately 340% of global GDP. This debt accumulation includes government obligations now totaling over $90 trillion globally, with major economies maintaining debt-to-GDP ratios that would have been considered unsustainable in previous decades.
| Economy | 2020 Debt-to-GDP | 2026 Debt-to-GDP | Change |
|---|---|---|---|
| United States | 110% | 125% | +15% |
| Japan | 260% | 260% | Stable |
| Eurozone Average | 88% | 91% | +3% |
| United Kingdom | 105% | 118% | +13% |
| Canada | 115% | 122% | +7% |
These elevated debt levels fundamentally alter investment dynamics by creating persistent currency debasement pressures. When governments cannot practically reduce debt burdens through fiscal constraint, monetary authorities face implicit pressure to maintain accommodative policies that gradually erode purchasing power. This environment rewards assets that maintain real value independent of currency fluctuations.
Portfolio Theory Applications in Multi-Risk Environments
Modern portfolio construction must account for correlation breakdowns during stress periods that traditional models fail to predict. Historical analysis reveals that gold's correlation with equities varies dramatically across market conditions, providing crucial diversification benefits precisely when conventional assets fail to provide protection.
During normal market periods (defined as months when the S&P 500 experiences volatility below 20%), gold correlates with stocks at approximately +0.1 to +0.2. However, during market stress periods (when equity volatility exceeds 30%), this correlation frequently turns negative, ranging from -0.2 to -0.5. This negative correlation during downturns explains gold's value as portfolio insurance.
The 200-Ounce Historical Benchmark: Analysis of long-term purchasing power preservation shows remarkable consistency in gold's real value. In 1933, median home prices of approximately $1,500 required roughly 73 ounces of gold at $20.67 per ounce. By 2025, median home prices near $450,000 require approximately 188 ounces at $2,400 per ounce, demonstrating sustained purchasing power across nearly a century.
Risk-adjusted return analysis using Sharpe ratios (excess return divided by volatility) shows gold delivering ratios of 0.35-0.45 from 2000-2025, compared to the S&P 500's 0.45-0.55. While stocks provided slightly superior risk-adjusted returns on a standalone basis, gold's primary value emerges in portfolio context through volatility reduction and correlation benefits. Furthermore, understanding the relationship between these assets is crucial, as outlined in our comprehensive gold‑stock market guide which explores secular market cycles.
When big ASX news breaks, our subscribers know first
Central Bank Reserve Strategy Evolution
Central bank gold accumulation patterns reflect structural shifts in international monetary arrangements rather than cyclical investment decisions. Official sector purchases have reached record levels, with central banks acquiring over 1,000 tonnes annually from 2022-2024, representing the highest sustained purchasing in decades.
This accumulation reflects multiple strategic considerations beyond traditional reserve management. Sanctions imposed on Russian foreign currency reserves in 2022 demonstrated that traditional reserve assets remain subject to external restriction, while gold reserves stored domestically cannot be frozen through international sanctions. This revelation prompted widespread reassessment of reserve composition across emerging market central banks.
| Country/Region | 2020 Gold Holdings | 2025 Gold Holdings | Percentage Increase |
|---|---|---|---|
| China | 1,948 tonnes | 2,140 tonnes | +9.9% |
| Russia | 2,299 tonnes | ~2,300 tonnes | Stable* |
| India | 687 tonnes | 850 tonnes | +23.7% |
| Turkey | 440 tonnes | 580 tonnes | +31.8% |
| Kazakhstan | 382 tonnes | 450 tonnes | +17.8% |
*Russian purchases constrained by sanctions after 2022
Dedollarisation Trends and Reserve Diversification
The US dollar's share of identified global foreign exchange reserves has declined from approximately 71% in 2000 to roughly 59% by late 2025, according to International Monetary Fund data. While this decline appears gradual, it represents massive capital reallocation when applied to total global reserves exceeding $15 trillion.
BRICS nations have emerged as particularly active gold accumulators, with collective holdings approaching 3,100 tonnes by 2025. These purchases reflect explicit policy discussions regarding reduced dollar dependence, though practical implementation remains limited by existing financial infrastructure requirements.
Central bank gold purchasing operates independently of price considerations, creating sustained demand pressure regardless of short-term market conditions. Unlike private investors who may reduce purchases during price increases, central banks focus on strategic reserve composition targets that support continued accumulation across varying price environments. Consequently, this institutional demand supports gold's role as a record‑highs inflation hedge.
Technological Applications Expanding Industrial Demand
Gold's industrial applications extend far beyond traditional jewellery and monetary functions, with technological advancement creating new demand categories that support structural price appreciation. Industrial gold consumption totals approximately 260-280 tonnes annually, representing 8-10% of total demand, with electronics applications accounting for the largest component at 180-200 tonnes yearly.
Supercomputing infrastructure development requires substantial gold quantities for specialised applications where material properties remain irreplaceable. Each modern exascale computing facility utilises kilogram quantities of gold in circuit interconnects, contact materials, and corrosion-resistant components. The US Department of Energy's commitment to exascale systems, alongside similar programmes globally, creates sustained industrial demand independent of investment considerations.
Digital Asset Infrastructure Dependencies
Stablecoin issuers have emerged as significant gold holders, with reserves exceeding $25 billion in precious metals backing by early 2026. These digital assets require stable collateral to maintain peg stability, creating new demand categories that bridge traditional monetary applications with emerging financial technology.
Blockchain technology's expansion creates indirect gold demand through several mechanisms:
- Hardware Infrastructure: Mining operations and node networks require gold-containing electronic components
- Collateral Requirements: Decentralised finance protocols increasingly incorporate precious metals as backing assets
- Cross-Chain Bridges: Gold-backed tokens facilitate value transfer between different blockchain networks
- Institutional Custody: Major cryptocurrency exchanges maintain precious metals reserves for stability purposes
| Industrial Application | Annual Gold Consumption | Growth Rate (2020-2025) |
|---|---|---|
| Electronics/Computing | 180-200 tonnes | +15% |
| Aerospace/Defence | 15-20 tonnes | +25% |
| Medical/Dental | 25-30 tonnes | +8% |
| Solar/Renewable Energy | 40-60 tonnes | +45% |
| Automotive Electronics | 10-15 tonnes | +35% |
Geopolitical Risk Factors Creating Safe-Haven Demand
International tensions across multiple regions simultaneously create sustained demand for assets existing outside political jurisdiction. Unlike previous decades when geopolitical risks remained geographically contained, current conflicts span Eastern Europe, the Middle East, and potential Asia-Pacific tensions, creating global uncertainty rather than regional concerns.
Regional conflict assessment reveals overlapping timeframes that prevent risk diversification across geographical markets. The Russia-Ukraine conflict, ongoing Middle East tensions, and China-Taiwan concerns create scenario planning challenges for institutional investors managing globally diversified portfolios. Gold provides hedging value that remains effective regardless of which specific conflicts escalate. However, investors should consider the broader implications outlined in our geopolitical gold price forecast.
Currency Policy Divergence Across Economic Blocks
Monetary policy coordination between major central banks has deteriorated as regional priorities diverge. The Federal Reserve focuses on domestic inflation and employment concerns, the European Central Bank manages sovereign debt sustainability across varied economies, and emerging market central banks address capital flow volatility and exchange rate stability.
This divergence creates exchange rate uncertainty that affects international trade and investment returns. Multinational corporations face earnings volatility from currency fluctuations, while international investors encounter unpredictable translation effects. Gold's role as a neutral monetary asset provides protection from currency policy conflicts.
Risk Assessment Framework: Investment professionals increasingly utilise scenario-based planning that assumes multiple simultaneous geopolitical tensions rather than isolated regional conflicts. This approach recognises that modern global integration means that localised conflicts create worldwide economic effects through supply chain disruption, energy price volatility, and financial market contagion.
Supply-Demand Dynamics Supporting Price Appreciation
Gold supply growth has decelerated significantly despite sustained price increases, reflecting geological and economic constraints on mining expansion. Annual production remains approximately 3,000-3,200 tonnes globally, with growth rates below 1% annually despite substantial price appreciation creating economic incentives for expanded output.
Furthermore, understanding these dynamics becomes clearer when examining overall gold market performance surge patterns that demonstrate how supply constraints interact with growing demand pressures.
Mining Production Constraints and Discovery Limitations
New gold discoveries have declined substantially over recent decades, with significant finds becoming increasingly rare. Major mining companies report that average ore grades continue declining at existing operations, requiring increased processing volumes to maintain output levels. This ore grade decline reflects the fundamental geological reality that easily accessible, high-grade deposits have been largely exhausted.
Capital expenditure requirements for new mine development have increased exponentially due to regulatory compliance costs, environmental impact mitigation, and the remote locations of remaining deposits. New mines require 5-10 years from discovery to production, with development costs often exceeding $1 billion for major operations.
| Supply Component | Annual Volume | Trend |
|---|---|---|
| Mine Production | 3,000-3,200 tonnes | Flat to declining |
| Recycled Gold | 1,300-1,400 tonnes | Stable |
| Central Bank Sales | Near zero | Shifted to purchases |
| Total Supply | 4,300-4,600 tonnes | Limited growth |
Demand Acceleration Across Multiple Sectors
Simultaneous demand increases across investment, industrial, and central bank sectors create supply pressure that cannot be readily resolved through increased production. This multi-sector demand acceleration differs from historical patterns where single demand categories drove price movements.
Investment demand through ETFs and direct purchases has been projected by major financial institutions to reach 250-300 tonnes annually, while bar and coin demand exceeds 1,200 tonnes per year. Combined with central bank purchases of 1,000+ tonnes and industrial consumption of 260-280 tonnes, total demand frequently exceeds available supply, requiring inventory drawdowns to clear markets.
Portfolio Allocation Strategies for Gold Exposure
Modern portfolio construction incorporating gold requires sophisticated allocation models that account for its unique risk-return characteristics and correlation patterns. Traditional mean-variance optimisation often underweights gold because it focuses on standalone return expectations rather than portfolio-wide risk reduction benefits.
In addition, comprehensive analysis from Investopedia's gold price drivers guide provides essential background for understanding the various factors that influence precious metals valuations and portfolio positioning strategies.
Risk-Adjusted Allocation Models
Academic research and institutional practice suggest gold allocations between 5-15% of total portfolio value optimise risk-adjusted returns across different investor profiles. Conservative investors benefit from allocations toward the higher end of this range due to capital preservation priorities, while aggressive growth investors utilise smaller allocations focused on tail-risk hedging.
| Investor Profile | Recommended Gold Allocation | Primary Objective |
|---|---|---|
| Conservative Income | 10-15% | Capital preservation |
| Balanced Growth | 5-10% | Volatility reduction |
| Aggressive Growth | 3-7% | Tail risk hedging |
| High Net Worth | 8-12% | Wealth preservation |
| Institutional Pension | 5-8% | Liability matching |
Portfolio simulations demonstrate that 10% gold allocation reduces traditional 60/40 stock/bond portfolio volatility by approximately 15-20% while maintaining comparable long-term returns. This volatility reduction proves particularly valuable during market stress periods when correlation benefits are most pronounced.
Implementation Methods and Cost Considerations
Gold exposure can be implemented through multiple vehicles, each presenting distinct cost structures and operational considerations. Physical gold ownership provides complete price exposure but requires storage and insurance arrangements. Gold ETFs offer liquidity and fractional ownership but involve management fees and potential tracking errors.
Physical Gold Holdings:
- Advantages: No counterparty risk, complete price exposure, tangible asset ownership
- Disadvantages: Storage costs, insurance requirements, liquidity constraints for large positions
- Optimal Use: Long-term holdings, wealth preservation strategies, crisis preparation
Gold ETFs and Mutual Funds:
- Advantages: High liquidity, professional management, fractional ownership capability
- Disadvantages: Management fees, potential tracking errors, counterparty risks
- Optimal Use: Tactical allocation adjustments, institutional portfolios, retirement accounts
Gold Mining Equities:
- Advantages: Leverage to gold prices, dividend potential, operational improvements
- Disadvantages: Equity market correlation, operational risks, management quality dependence
- Optimal Use: Growth-oriented strategies, active management approaches, sector rotation tactics
The next major ASX story will hit our subscribers first
Potential Scenarios Challenging Gold's Outperformance
Realistic scenario analysis must consider conditions that could undermine gold's relative performance advantages. While structural factors support continued strength, certain developments could create headwinds for precious metals investment returns. However, recent analysis from the Courier Mail's market shift coverage suggests that current trends favour continued precious metals strength over traditional equity indices.
Economic Normalisation Scenarios
Rapid resolution of inflation concerns combined with real interest rate normalisation could reduce gold's relative attractiveness. If central banks successfully restore price stability while maintaining positive real interest rates above 2%, traditional income-generating assets would provide competition for defensive capital allocation.
However, this scenario faces implementation challenges given existing debt burdens that make sustained high real rates economically disruptive. Government debt service costs become prohibitive when real rates significantly exceed economic growth rates, creating political pressure for accommodative monetary policies.
Technological Disruption in Mining or Processing
Breakthrough technologies in gold extraction, processing, or recycling could substantially increase supply availability, potentially overwhelming demand growth. Advanced extraction techniques, improved ore processing efficiency, or economical seawater extraction could transform supply dynamics.
Additionally, technological substitution in industrial applications could reduce demand from electronics and computing sectors. Alternative materials providing equivalent conductivity and corrosion resistance at lower costs would diminish gold's industrial value proposition.
| Scenario | Probability | Potential Impact | Timeline |
|---|---|---|---|
| Inflation Resolution | Moderate | Negative for gold | 2-3 years |
| Geopolitical Stabilisation | Low | Moderately negative | 5-10 years |
| Mining Technology Breakthrough | Low | Significantly negative | 10+ years |
| Dollar Strengthening | Moderate | Short-term negative | 1-2 years |
| Interest Rate Normalisation | High | Mixed impact | 2-5 years |
Long-Term Investment Thesis and Strategic Outlook
The structural factors supporting gold's market leadership appear likely to persist across extended timeframes. Debt sustainability concerns across developed economies cannot be readily resolved without either extended periods of economic austerity or gradual currency debasement through monetary policy accommodation. Historical precedent suggests political systems favour gradual debasement over sudden fiscal adjustment.
Technological advancement continues expanding gold's industrial applications faster than substitution eliminates existing uses. The transition to renewable energy, electrification of transportation, and advancement of computing infrastructure all increase industrial gold consumption. These trends operate independently of monetary and investment demand drivers, providing multiple support pillars for sustained demand growth.
Timeline Expectations for Structural Demand Factors
Near-term projections (2026-2028) suggest continued central bank accumulation as reserve diversification strategies advance gradually. Industrial demand growth should accelerate as renewable energy deployment expands globally, while investment demand depends heavily on inflation expectations and geopolitical developments.
Medium-term outlook (2028-2032) may see supply constraints become more binding as existing mines face declining ore grades while new discoveries remain limited. Technology-driven demand growth could accelerate through advanced computing applications and expanded electronic device proliferation in emerging markets.
Investment Thesis Summary: Unless underlying structural forces reverse meaningfully through debt reduction, geopolitical stabilisation, and technology substitution, gold's role in global finance appears positioned to strengthen further. The combination of constrained supply, diversified demand growth, and continued monetary system uncertainty creates favourable conditions for sustained outperformance.
Ultimately, the question of why gold continues to buck trends and outperform stocks reflects deeper structural changes in the global financial system. Consequently, these changes suggest that precious metals may maintain their advantageous position relative to traditional equities for the foreseeable future, making them essential components of modern portfolio construction strategies.
Disclaimer: This analysis contains forward-looking statements and assumptions about future market conditions, government policies, and economic developments. Actual results may vary significantly from projections presented. Gold prices can be volatile, and past performance does not guarantee future results. Investors should conduct independent research and consider their risk tolerance before making investment decisions. This content is for educational purposes and should not be considered personalised investment advice.
Ready to Capitalise on the Next Major Gold Discovery?
Discovery Alert's proprietary Discovery IQ model delivers real-time alerts on significant ASX mineral discoveries, instantly empowering subscribers to identify actionable opportunities ahead of the broader market. Understanding why major mineral discoveries can lead to substantial returns becomes crucial as precious metals continue outperforming traditional equities, and you can begin your 14-day free trial today to position yourself ahead of the market.