June 18, 2026
Gold Has No Earnings, No Yield, and No Intrinsic Anchor — Yet It Outperforms Almost Everything Over Time
Most asset classes can be modelled. Equities respond to earnings growth. Bonds respond to credit spreads and duration. Real estate follows rental yields and cap rates. Gold responds to none of these. It generates no income, carries no coupon, and produces no cash flow. By conventional financial logic, it should be impossible to value.
And yet, across multi-decade horizons, gold has preserved wealth more reliably than virtually any fiat currency ever issued. Understanding why requires a complete reframe of how gold is priced. It is not a commodity in the industrial sense. It is a monetary barometer — a real-time signal of how much collective confidence exists in the integrity of fiat money systems, central bank credibility, and the broader architecture of global finance.
Understanding what moves gold prices is not about tracking a single variable. It is about reading a system. The forces that drive gold operate across short, medium, and long-term horizons simultaneously — and they often point in contradictory directions depending on the timeframe being examined. This article maps each of those forces in full.
Gold does not respond to company earnings or credit spreads. It responds to the perceived integrity of the monetary system itself. That distinction is the foundation for reading every price movement that follows.
When big ASX news breaks, our subscribers know first
Monetary Policy and the Real Interest Rate Mechanism
Why Real Yields Are the Most Precise Short-Term Signal for What Moves Gold Prices
Real interest rates — defined as nominal interest rates minus prevailing inflation — represent the single most reliable short-term predictor of gold price direction. The logic is mechanically straightforward: gold produces no yield. When the real yield available on competing assets such as Treasury bonds falls toward or below zero, the opportunity cost of holding gold effectively disappears. Capital flows toward gold. When real yields are positive and rising, yield-bearing assets become comparatively attractive and gold faces structural headwinds.
This mechanism, as detailed in gold's relationship with real interest rates, explains both the peaks and the troughs of gold's recent price history with unusual precision:
| Real Rate Environment | Historical Gold Tendency | Example Period |
|---|---|---|
| Deeply negative (below -1%) | Strong upward pressure | 2020–2022 |
| Mildly negative (0% to -1%) | Moderate support | 2019, 2024 |
| Near zero | Neutral to range-bound | 2017–2018 |
| Positive and rising | Headwinds, price softening | 2022–2023 |
| Positive and stable | Mixed, dependent on other factors | Varies |
The 2020–2022 period produced one of gold's most sustained multi-year rallies on record, driven directly by deeply negative real rates resulting from near-zero nominal rates combined with elevated inflation. The reversal came when the Federal Reserve initiated an aggressive tightening cycle, pushing real yields into positive territory and creating headwinds that persisted even as nominal prices remained historically elevated.
By mid-2026, markets had completely repriced rate cut expectations out of the calendar. A December rate hike had become a meaningful probability following hotter-than-expected producer price data (Trading Economics). Gold responded immediately to that shift in expectations — not to the hike itself, but to the forward guidance repricing that preceded it.
How the Federal Reserve Transmission Chain Actually Works
A frequently misunderstood point is that gold does not react primarily to the rate decision itself. It reacts to forward guidance — the market's evolving interpretation of where rates are heading. The transmission chain compresses into hours during high-volatility communication events:
- Federal Reserve signals hawkish or dovish shift in policy outlook
- Bond markets reprice yields across the curve
- Real yields shift in response to the new nominal rate expectations
- The U.S. dollar adjusts relative to other currencies
- Gold reprices to reflect the new real yield and dollar configuration
Furthermore, there is a notable asymmetry in this process. Gold tends to react faster and more sharply to hawkish surprises than to dovish ones, partly because existing long positioning makes the unwind more abrupt.
How Inflation Shapes Gold's Value Proposition Across Different Time Horizons
The Critical Distinction Between Cyclical and Structural Inflation Effects
Inflation affects gold through two entirely separate mechanisms that operate on different timescales and can produce opposite short-term price signals. Conflating them is one of the most common analytical errors in gold market commentary. According to Investopedia's analysis of gold price drivers, understanding this distinction is essential for any serious investor.
-
Cyclical inflation response: Rising consumer prices increase near-term demand for inflation hedges. However, high CPI readings simultaneously trigger rate hike expectations, which push real yields higher and can actually pressure gold in the short term.
-
Structural debasement argument: Persistent government deficit spending and central bank balance sheet expansion erode fiat purchasing power across decades. Gold, as a fixed-supply asset, benefits from this dynamic regardless of short-term noise in the inflation data.
The April 2026 data illustrated this tension directly. U.S. CPI reached 3.8% — its highest reading since May 2023 (Bureau of Labor Statistics) — partly driven by energy price shocks. Gold pulled back sharply in the same period as the rate hike probability repricing intensified. Hotter inflation produced a bearish gold outcome over weeks, even while the structural inflation argument grew stronger.
The 100-Year Purchasing Power Test: One ounce of gold purchased in 1924 retains approximately the same real purchasing power in terms of goods and services today. An equivalent amount of U.S. currency from 1924 does not come close to matching that outcome. This is not a trading argument — it is a multi-generational store of value case that no major fiat currency has replicated over comparable timeframes. (Source: GoldSilver.com — Gold vs Inflation: What 100 Years of Data Shows)
Why Deficit Spending Compounds the Long-Term Gold Thesis
When governments finance expenditure through debt issuance rather than taxation, money supply expands at a pace that outstrips productive economic output. Gold's supply is constrained by geology and capital expenditure cycles — it cannot be expanded by policy decision. This asymmetry compounds meaningfully over years and decades.
This dynamic is not unique to the United States. It applies across major economies running persistent structural deficits, including most G7 nations. IMF Fiscal Monitor data on sovereign debt-to-GDP trajectories across developed economies provides the quantitative backdrop for why gold's structural purchasing power argument is unlikely to weaken significantly over long horizons. Furthermore, the interplay between gold, bonds, and economic cycles reinforces why deficit spending remains a durable tailwind for the metal.
The U.S. Dollar's Relationship With Gold Prices
The Inverse Relationship: Reliable Baseline With Important Exceptions
Because gold is denominated in U.S. dollars across global markets, dollar movements have a direct mechanical impact on gold's price. Dollar appreciation raises the effective cost for non-U.S. buyers, suppressing international demand and exerting downward pressure on prices. Dollar depreciation lowers that effective cost, stimulating demand. Over medium-term horizons, this inverse relationship is one of the most consistent in financial markets (GoldSilver.com — Dollar vs Gold Relationship).
The exceptions matter, however. During the systemic stress events of 2008, 2020, and portions of early 2026, the dollar and gold rose simultaneously. Both assets attracted safe-haven capital as investors exited risk assets at the same time. The inverse relationship functions reliably under normal market conditions; it breaks down when the primary driver of capital flows is systemic fear rather than relative asset attractiveness.
Treat the inverse dollar-gold relationship as a strong baseline for normal market regimes, not a universal law that holds under all conditions.
Exchange Rate vs. Purchasing Power: The More Important Long-Run Dynamic
The conventional focus on the dollar's exchange rate relative to other currencies captures only part of the picture. A dollar that strengthens against the euro while simultaneously losing ground against energy, food, and housing is still a weakening currency in the context that matters most to gold markets. Gold's long-run response is to purchasing power erosion, not to currency cross-rates.
This distinction explains why gold can perform strongly even during periods when the DXY index (the dollar's measure against a basket of other fiat currencies) appears stable or modestly elevated. Other currencies may be weakening at a similar pace, masking the underlying purchasing power deterioration that gold is responding to.
De-Dollarisation as a Structural Tailwind
The share of U.S. dollar-denominated assets in global central bank reserves has declined meaningfully over the past two decades. IMF COFER data on global reserve currency composition captures this gradual but consistent shift. This is a slow-moving structural force rather than a near-term catalyst — but its directional implications for gold are durable and reinforcing over longer time horizons.
Why Central Bank Gold Demand Has Become a Structural Market Force
From Portfolio Allocation to Reserve Architecture Reconfiguration
The most important shift in what moves gold prices over the past four years has been the transformation of central bank buying from a tactical allocation decision into a deliberate sovereign reserve strategy reconfiguration. This distinction carries significant analytical weight.
Central banks are fundamentally price-insensitive buyers. Their accumulation decisions are driven by long-term reserve management mandates and geopolitical risk assessments — not by short-term price signals or momentum. This characteristic makes their demand a structural demand floor: persistent, non-reactive to normal market volatility, and unaffected by the sentiment swings that drive retail and institutional investor flows. Consequently, central bank demand has been a key driver of gold's performance in 2025.
The Quantitative Scale of the Structural Shift
The numbers behind this shift are striking:
| Period | Average Annual Purchases | Characterisation |
|---|---|---|
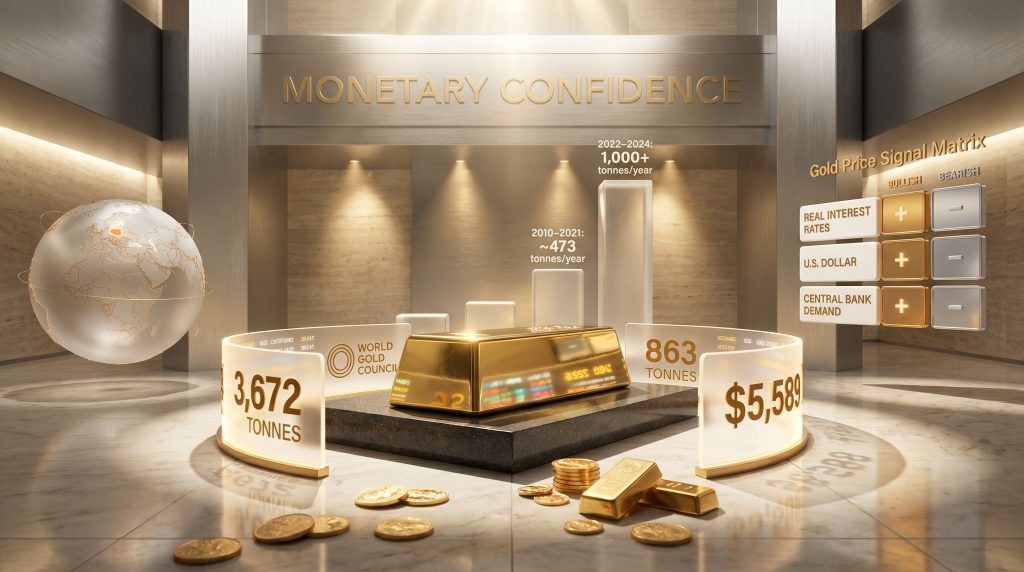
| 2010–2021 | ~473 tonnes/year | Moderate, steady accumulation |
| 2022–2024 | 1,000+ tonnes/year | Structural acceleration |
| 2025 | 863 tonnes | Moderation — still 4th largest on record |
| Largest 2025 buyer | Poland: +102 tonnes (reaching 550 tonnes total) | Major reserve build |
(Source: World Gold Council — Gold Demand Trends Full Year 2025)
Global central bank gold purchases exceeded 1,000 tonnes per year from 2022 through 2024 — nearly double the annual average of 473 tonnes recorded across the preceding decade. Twenty-two central banks increased their gold reserves by at least one tonne in 2025 alone. A 2025 World Gold Council survey found that 95% of central banks anticipated continued growth in global gold reserves, with none projecting a reduction in their own holdings.
Perhaps the clearest signal of the structural nature of this shift came during periods when Western ETF investors were net sellers of gold. Sovereign institutional buyers absorbed the released supply — and prices continued to rise. This divergence reveals a fundamental change in who is setting the marginal price of gold in the current cycle.
Repatriation: The Underappreciated Dimension of Sovereign Gold Strategy
Beyond the headline buying figures, 68% of central banks now store the majority of their gold reserves within their own national borders — up from approximately 50% in 2020 (World Gold Council Central Bank Survey 2025). The scale of central bank gold reserves in 2025 underscores how this repatriation trend reflects sovereign concern about the risk of foreign-held assets being frozen or restricted. It is not a reaction to individual geopolitical headlines; it represents a deliberate long-term reconfiguration of reserve custody architecture.
Geopolitical and Systemic Risk as a Gold Price Driver
Separating the Fear Premium From Structural Risk
Geopolitical events affect gold through two mechanisms that operate on entirely different timescales and with different durability:
-
The fear premium: Acute crises — conflicts, political instability, financial sanctions — generate rapid demand for counterparty-free assets. Gold's price spikes. This premium typically fades as the immediate uncertainty resolves or markets habituate to the new environment.
-
The structural risk discount: Sustained erosion of trust in multilateral financial institutions, reserve currency systems, and cross-border financial infrastructure creates durable support that does not fade with individual headlines. This is the mechanism that has underpinned gold's multi-year re-rating.
The rally to a record high of $5,589 per ounce in January 2026 (Yahoo Finance / Trading Economics) incorporated both elements simultaneously. Conflict-driven fear premium layered over deepening structural uncertainty around global trade architecture. The subsequent pullback to around $4,550 reflected the normalisation of the acute fear premium — not the disappearance of the structural support beneath it.
Gold as the Only Large-Scale Counterparty-Free Reserve Asset
Gold's defining property in the context of reserve strategy is that it cannot be frozen, defaulted on, devalued by a third party, or subjected to sanctions. It is the only reserve asset available at scale that carries genuinely zero counterparty risk. This property becomes exponentially more valuable precisely when counterparty risk in the broader financial system rises — which is why gold's structural bid intensifies during systemic stress events rather than fading alongside them.
The 2022 freezing of Russian central bank reserves held in foreign-currency-denominated assets provided a live case study in what counterparty risk looks like when it materialises for a sovereign holder. The global central bank buying acceleration that followed was not coincidental. In addition, gold's safe-haven dynamics in 2025 illustrate precisely how this counterparty-free property drives demand during periods of heightened systemic stress.
The next major ASX story will hit our subscribers first
Physical Supply and Demand: What the Production Data Actually Reveals
Why Mine Supply Cannot Drive Gold Prices
Gold mine production is constrained by geology, multi-year capital investment cycles, and permitting timelines that can span a decade or more from initial discovery to first production. A price spike does not generate a supply surge in the way it might for agricultural commodities or even base metals. The lag between investment decision and production output is simply too long.
Global mine production reached a record 3,672 tonnes in 2025, growing by less than 1% year-over-year (World Gold Council). Against a backdrop of record demand, near-flat supply growth reinforces the fundamentally demand-driven nature of gold price formation. Supply is essentially an anchor — slow-moving and unable to respond to price signals within any commercially relevant timeframe.
There is also a key structural feature that makes gold unlike almost every other commodity: virtually all gold ever mined remains in circulation in some form. Estimated above-ground stocks exceed 200,000 tonnes. Annual mine production of approximately 3,672 tonnes represents less than 2% of total above-ground stock. This means gold's price is almost entirely determined by the willingness of existing holders to sell and new buyers to acquire — production volumes are largely irrelevant to price formation at the margin.
Decomposing Physical Demand: Three Categories With Different Price Sensitivities
| Demand Category | 2025 Behaviour | Price Sensitivity | Key Driver |
|---|---|---|---|
| Jewellery | Declined globally | High — falls as prices rise | Consumer discretionary spending |
| Technology (incl. AI applications) | Held steady | Low — essential industrial use | Electronics and AI infrastructure |
| Investment (bars and coins) | 12-year high in Q4 2025 | Inverse — rises with price in bull markets | Monetary demand, inflation hedging |
| Central bank purchases | 863 tonnes — 4th largest on record | Very low — strategic, not price-driven | Reserve diversification |
Total gold demand exceeded 5,000 tonnes in 2025 — a new annual record (World Gold Council). Elevated prices did not suppress aggregate demand. Investment and sovereign buying more than offset the decline in jewellery consumption.
This is atypical commodity behaviour. In most markets, higher prices reduce demand through affordability constraints. In gold's investment segment, however, higher prices can attract additional demand as monetary concerns and momentum reinforce each other — a reflexive dynamic that does not apply to industrial commodities. The Gold Industry Group's overview of what moves the gold price provides a useful additional framework for understanding these demand dynamics.
Reading Gold Price Movements as a System: The Multi-Factor Framework
No Single Variable Determines What Moves Gold Prices in Isolation
Gold price movements are rarely the product of a single driver. They reflect the aggregate signal of monetary, financial, and geopolitical forces operating simultaneously — often in partially offsetting directions. The analytical challenge is not identifying which factors exist, but correctly weighting each one by its current intensity.
| Factor | Bullish for Gold | Bearish for Gold |
|---|---|---|
| Real interest rates | Negative or falling | Positive and rising |
| U.S. dollar | Weakening | Strengthening |
| Inflation | Structurally elevated | Contained and falling |
| Central bank demand | Accelerating accumulation | Sustained selling (historically rare) |
| Geopolitical risk | Escalating systemic stress | Broad de-escalation |
| Physical investment demand | Bar and coin buying rising | ETF outflows and retail selling |
| Mine supply growth | Stagnant or declining | Significant supply surge (geologically rare) |
Scenario Pathways: What Could Drive Gold Significantly Higher or Lower
Scenarios that could drive gold to new highs from current levels:
-
Stagflationary spiral: Inflation re-accelerates above 4% while growth stalls, forcing the Fed to pause its tightening cycle. Real yields collapse, the dollar weakens, and gold's opportunity cost falls to near zero.
-
Systemic financial stress event: A sovereign debt crisis or major institutional failure triggers simultaneous dollar and gold safe-haven demand. Gold leads the flight to quality.
-
Accelerated de-dollarisation: BRICS+ economies formalise mechanisms that increase the role of gold in trade settlement or reserve architecture, driving structural sovereign demand beyond the current pace.
Scenarios that could create meaningful headwinds:
-
Credible disinflation: CPI falls sustainably toward the Fed's 2% target, allowing rate cuts that normalise real yields without triggering inflationary concern. Gold's relative appeal diminishes.
-
Risk-on rotation: Equity markets enter a sustained bull cycle driven by productivity gains, drawing capital away from defensive assets. ETF outflows accelerate and investment demand softens.
These scenarios are hypothetical projections intended for analytical purposes only. They do not constitute investment advice, and actual market outcomes may differ materially from any scenario described.
Frequently Asked Questions: What Moves Gold Prices
Why does gold rise when inflation increases?
Gold's supply is constrained by geology and cannot be expanded through government or central bank policy. When fiat currency supply grows faster than productive output — through deficit spending or monetary expansion — each unit of currency purchases less over time. Gold, as a fixed-supply asset, tends to hold its real purchasing power across inflationary cycles.
The short-term complication is that high inflation can trigger rate hike expectations that temporarily pressure gold by pushing real yields higher. Separating the cyclical short-term response from the structural long-run dynamic is essential to interpreting the relationship correctly.
What is the relationship between gold prices and the U.S. dollar?
Gold is globally priced in U.S. dollars, so dollar appreciation raises the effective cost for non-U.S. buyers, reducing demand and exerting downward pressure on prices. The inverse relationship is reliable over medium-term horizons but breaks down during systemic risk events, when both assets attract safe-haven capital simultaneously.
The more durable long-run relationship is between gold and the dollar's purchasing power relative to real goods and services — not its exchange rate against other fiat currencies.
How do Federal Reserve interest rate decisions affect gold?
Fed policy affects gold primarily through the real interest rate channel. Rate hikes that outpace inflation push real yields higher, increasing the opportunity cost of holding non-yielding gold. Rate cuts or pauses do the opposite.
Gold tends to respond most powerfully not to the rate decision itself but to the forward guidance repricing that precedes it. The strongest historical environments for gold have combined low nominal rates with elevated inflation — producing deeply negative real yields and removing the opportunity cost of gold ownership almost entirely.
Why are central banks buying so much gold?
Central banks have been systematically diversifying reserves away from dollar-denominated assets, partly in response to sanctions-related risks that became explicit in 2022. From 2022 through 2024, global central bank purchases exceeded 1,000 tonnes per year — nearly double the prior decade's pace.
This represents a structural reconfiguration of reserve management strategy, not a tactical trade responding to short-term price signals. The repatriation trend — with 68% of central banks now storing the majority of their gold domestically — reflects the same underlying concern about counterparty risk in foreign-held assets.
Does geopolitical conflict always push gold prices higher?
Not always, and not permanently. Conflict increases near-term demand for assets with zero counterparty risk, which pushes gold higher in the short term. But that fear premium typically fades once the immediate uncertainty resolves or becomes priced in.
The more durable support comes from structural shifts — de-dollarisation, reserve diversification, and declining institutional confidence in multilateral financial systems — not from individual geopolitical events. Events can move gold quickly; structural forces determine where it settles afterward.
This article is intended for informational and educational purposes only. It does not constitute investment advice. Past performance of any asset class is not indicative of future results. Readers should consult a qualified financial adviser before making any investment decisions. Scenario projections and forward-looking statements involve assumptions that may not reflect actual future conditions.
Want to Know Which ASX Mining Discoveries Could Be the Next Major Find?
Discovery Alert's proprietary Discovery IQ model delivers real-time alerts on significant ASX mineral discoveries, instantly translating complex geological data into actionable investment insights for both short-term traders and long-term investors. Explore historic discoveries and the substantial returns they generated, then begin a 14-day free trial at Discovery Alert to position yourself ahead of the broader market.