June 29, 2026
When Derivatives Drive Markets: Understanding the Mechanics Behind Gold's Correction
Most discussions about gold price movements default to familiar narratives: central bank policy, dollar strength, geopolitical risk. But the forces that actually move prices in modern commodity markets are increasingly mechanical rather than fundamental. Options positioning, margin dynamics, and dealer hedging obligations can overwhelm even the most robust macroeconomic thesis in the short term. Consequently, these forces create violent price dislocations that are routinely misread as sentiment shifts.
This distinction matters enormously for investors trying to interpret what the current gold correction actually means, and whether the surge in GLD put buying and gold market selloff signals genuine institutional bearishness or something far less alarming.
When big ASX news breaks, our subscribers know first
The Mechanics Behind the Selloff: Derivatives, Not Fundamentals
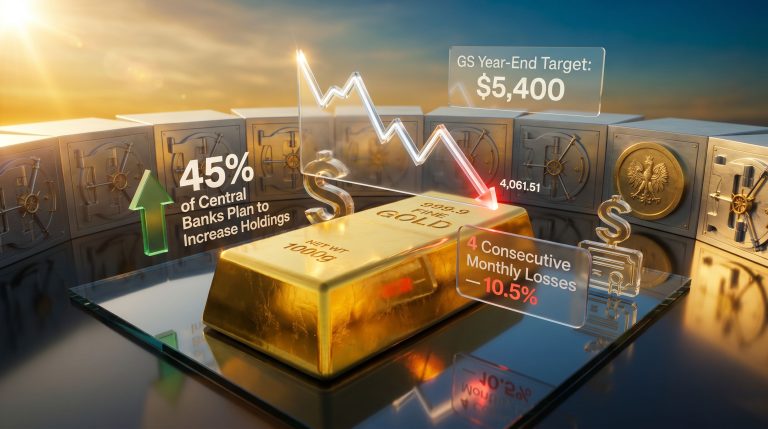
The gold market's sharp decline from above $5,500 per ounce to approximately $4,000 was not triggered by a fundamental reassessment of gold's role as a monetary asset. Instead, the velocity of the decline traces back to a structural breakdown in derivatives positioning known as gamma flipping. Understanding the gold price moves behind this breakdown is essential for any informed investor.
Here is how the mechanism works:
- Options dealers who hold short call positions must continuously adjust their delta exposure as prices move
- When spot gold fell through critical strike levels, dealers were mathematically obligated to sell futures contracts to maintain a neutral hedge
- This mechanical selling had nothing to do with investment conviction — it was a hedging obligation
- Simultaneously, over-leveraged long positions hit margin thresholds and were automatically liquidated
- Metal exchanges had raised margin requirements significantly in the preceding weeks, amplifying the forced deleveraging wave
The result was a self-reinforcing downward spiral where selling bred more selling, entirely disconnected from any change in gold's underlying supply and demand dynamics. Recognising this distinction between a liquidity-driven correction and a fundamentals-driven bear market is the single most important analytical step for positioning correctly in what follows.
When a commodity selloff is engineered by derivatives mechanics rather than a repricing of long-term value, the decline frequently overshoots fair value, creating asymmetric entry opportunities that patient, well-capitalised investors can exploit.
Historical Context: Gold's 12th Major Correction in a Multi-Decade Bull Market
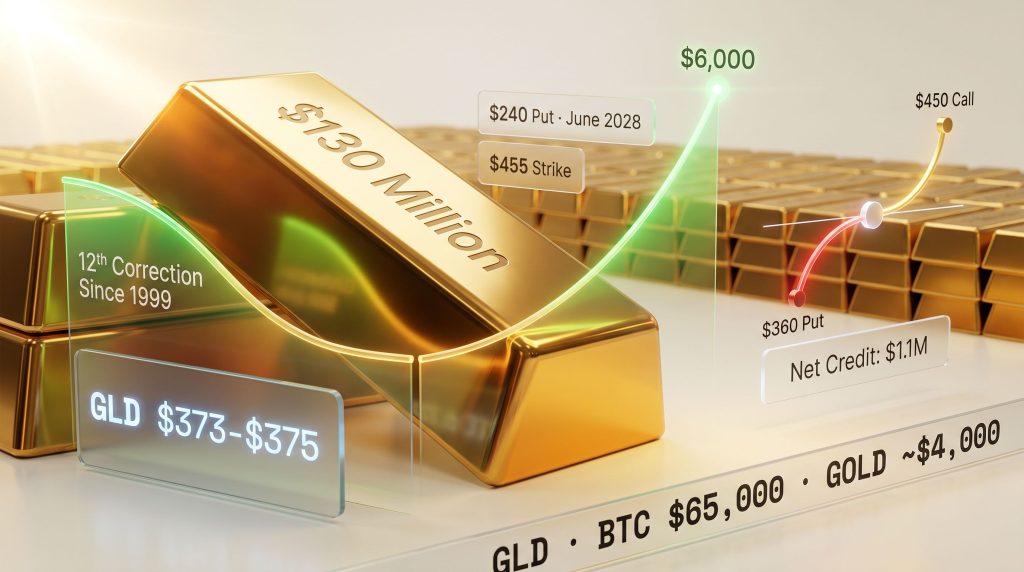
Perspective is critical here. The current drawdown, representing more than 20% from peak levels, qualifies as the 12th significant correction since gold's secular bull market originated in 1999. The GLD ETF, which tracks physical gold spot prices, has pulled back to the $373 to $375 range from all-time highs above $450. Furthermore, the broader gold market outlook suggests this correction sits well within historical norms for the asset class.
A directly comparable episode occurred in March 2026, when gold experienced a roughly 12% decline driven by a spike in real yields and institutional deleveraging. That correction was similarly unaccompanied by any structural shift in gold's fundamental investment case, and prices subsequently recovered to new highs.
| Correction Event | Approximate Drawdown | Primary Driver | Recovery Outcome |
|---|---|---|---|
| March 2026 Pullback | ~12% | Real yield spike and deleveraging | Recovery to new highs |
| Current Correction | ~20-27% | Gamma flip, margin hikes, Fed hawkishness | Under observation |
| Historical commodity parabolic corrections | Up to 50% | Parabolic advance exhaustion | Full recovery and new highs |
The historical framework articulated by long-term commodity investors holds that no commodity has ever sustained a parabolic advance without correcting deeply, sometimes by as much as 50%, before resuming its primary uptrend. Applied to gold, a 50% retracement from the $5,500 peak would place a theoretical floor near $2,750 — an extreme scenario but one that falls within the historical distribution of commodity corrections.
Critically, the same framework predicts full recovery and higher highs following the correction phase. Gold, silver, and platinum all experienced near-vertical advances simultaneously, a pattern that historically increases the probability of a mean-reverting correction before the next leg higher. For a deeper dive into this pattern, Seeking Alpha's analysis offers useful additional context on what has driven gold's recent behaviour.
Decoding GLD Put Buying: Panic Hedging Versus Directional Bearishness
The headline figures are striking. More than $130 million in put premium has been deployed on heavy down days in GLD, with traders concentrating positions in deep out-of-the-money strikes including the $240 put targeting June 2028, implying a further 30 to 40% decline from current levels. Put/call skew has reached extremes not observed since prior bear market episodes.
However, interpreting this data requires understanding the distinction between hedging behaviour and directional conviction.
Is the Put Buying Genuine Bearishness?
Floor trading analysis strongly suggests that the dominant motivation behind this GLD put buying and gold market selloff is portfolio insurance, not outright bearish positioning. The logic is straightforward:
- If large institutions had genuinely abandoned their bullish thesis on gold, the rational action would be to liquidate the underlying position entirely
- The presence of substantial put buying alongside retained long positions indicates that holders are protecting existing exposure, not closing it
- As more participants pile into put protection, implied volatility rises, increasing the cost of the hedge for every subsequent buyer
- This self-reinforcing dynamic ultimately benefits contrarian sellers of volatility, not put buyers
A notable institutional structure illustrates the complexity of current positioning: one significant trade involved selling $450-strike calls while simultaneously buying $360-strike puts, generating a $3.1 million credit from the call sale and costing $2 million for the put purchase. The net credit of approximately $1.1 million reflects a risk-reversal structure expressing a near-term bearish lean while managing the cost of downside protection. The $455 level carries substantial open interest and is being watched closely as a potential trigger for renewed buying pressure if prices break higher.
In floor trading culture, there is a saying that captures the psychology of these moments precisely: when you can see their tonsils, give them whatever they want, because they are wrong. Extreme put buying at current levels, driven by panic rather than conviction, may paradoxically mark proximity to a floor rather than confirmation of further downside.
The Federal Reserve Variable: Rate Hike Probability and Gold's Structural Headwind
The hawkish Federal Reserve narrative is not media fabrication — it reflects real market pricing. Fed funds futures are currently assigning approximately 65% probability to at least one rate hike in the near term, driven by persistent inflation that conventional monetary tools have struggled to contain.
The 10-year Treasury yield has rallied materially, reinforcing the hawkish signal independent of official Fed guidance. Higher nominal rates increase the opportunity cost of holding non-yielding assets like gold, creating a genuine structural headwind that compounds the derivatives-driven selling pressure. In addition, the interplay between gold and bond volatility has become increasingly relevant for understanding how rate dynamics feed through into gold price action.
What Are the Key Risks to Watch?
However, the hawkish narrative requires important nuance:
- The current Fed posture partly reflects a belated acknowledgment that free-market rate dynamics have outpaced central bank guidance
- Longer-duration instruments had already moved higher before official policy reflected this reality
- The exception scenario involves a major deterioration in credit markets, with private credit stress and the re-emergence of low-documentation mortgage lending flagged as early warning signals echoing 2008 dynamics
The base case, absent a systemic credit event, is continued rate hikes. But the tail risk scenario — a rapid policy reversal forced by credit market stress — would likely represent the most powerful near-term catalyst for a gold re-rating. Investors should monitor private credit conditions and commercial real estate stress as leading indicators of whether this tail risk is materialising.
The July 4th Monetary Reset: Separating Signal from Noise
Circulating theories about a U.S. Treasury issuance of gold-convertible 50-year bonds timed to America's 250th anniversary have attracted significant media attention. The proposal, associated with monetary reform advocates, frames new long-duration debt instruments anchored to gold reserves as a credibility signal in an era of fiscal expansion.
The honest assessment is that this narrative lacks implementation architecture:
- A genuine gold convertibility mechanism requires legislative action, not executive initiative
- International monetary coordination would be essential and is nowhere in evidence
- Some U.S. states have passed legislation recognising gold as legal tender, but this operates at a jurisdictional level with no systemic monetary implications
- The free market, not a policy reset button, is the only credible mechanism for repricing gold's monetary role
The July 4th narrative is best understood as a media-amplified distraction. Serious market participants should assign negligible probability to any market-moving implementation and focus instead on the mechanical and macro drivers that are actually shaping price action.
The next major ASX story will hit our subscribers first
CME Micro Contracts and the Coming 24/7 Trading Landscape
Two concrete structural developments deserve attention from investors monitoring gold market dynamics. The CME Group is launching two new micro contracts on July 24th and July 26th:
- A 1-ounce gold micro contract that dramatically reduces the capital threshold for direct gold futures exposure
- A 10-barrel crude oil micro contract providing parallel democratisation of energy market access
Both contracts are designed to enable 24/7 trading, extending market access to Asia-Pacific participants in regions including Australia and South Korea. This aligns with a broader industry transition: equity and options markets are moving to 24/5 trading by September, with full 24/7 coverage projected by year-end.
| Market Participant | Impact of 24/7 Trading |
|---|---|
| Active traders | Increased monitoring burden, volatility spread across more hours |
| Long-term investors | Minimal impact on portfolio outcomes |
| Volatility traders | Reduced spike intensity, Monday gap phenomenon diminishes |
| Global retail investors | Expanded access across time zones |
The practical implication for volatility dynamics is significant. The notorious Monday gap phenomenon, where weekend news accumulates and triggers sharp market opens, is expected to diminish as continuous trading smooths information-driven price dislocations in real time. For volatility traders, this structural shift compresses one of the most reliable short-term trading edges in commodity markets.
Bitcoin's Parallel Correction and What It Confirms
Bitcoin's retreat from $120,000 to approximately $65,000 mirrors the percentage-based drawdown in gold, and this parallel is analytically meaningful. Two assets with distinct structural investment theses — gold as a monetary hedge with thousands of years of history and Bitcoin as a digitally native store of value — correcting by similar magnitudes simultaneously points to a common macro driver rather than asset-specific fundamental problems.
That common driver is broad liquidity withdrawal across risk assets. When capital is being pulled from markets indiscriminately, even uncorrelated assets decline together. This pattern actually reinforces the case that gold's correction is cyclical and mechanical rather than structural, as the underlying demand drivers for both assets remain intact. Furthermore, the gold safe-haven dynamics at play here suggest that gold's long-term role as a portfolio anchor has not diminished despite the sharp drawdown.
Physical Gold Versus Paper Gold: Different Risk Profiles in a Correction
Not all gold exposure carries the same risk profile during periods of elevated margin requirements and forced liquidations.
Physical gold holders can hedge downside exposure using options strategies such as back-ratio spreads without liquidating the underlying position. This approach allows long-term investors to maintain core exposure while reducing mark-to-market pain during the correction phase.
Paper gold holders, including those with ETF and futures exposure, face additional risks from margin calls and forced liquidations that do not affect physical holders. Institutional investors with no near-term liquidity requirements are structurally better positioned to ride out the correction in physical holdings. The dynamics specific to the LBMA-COMEX gold market also play a meaningful role in how these risks manifest across different trading venues.
The strategic implication is clear: investors with a long-term horizon and adequate capital reserves — defined as capital that does not need to meet near-term obligations — are positioned to benefit from the current correction rather than being victimised by it. According to Investing.com's analysis, the SPDR Gold Trust's selloff has effectively cleared the excess positioning built during the 2025 rally, which many analysts view as a necessary reset before any sustained recovery.
Navigating the Correction: A Framework for Structural Investors
Synthesising the mechanics, history, and positioning dynamics into an actionable framework produces the following conclusions:
- The selloff was derivatives-driven, not fundamentals-driven, meaning the correction likely overshoots intrinsic value
- Extreme GLD put buying and gold market selloff dynamics are more consistent with institutional panic hedging than directional bearishness — a historically reliable contrarian signal
- The hawkish Fed creates genuine near-term headwinds, but credit market deterioration remains the wildcard that could rapidly reverse the policy trajectory
- The July 4th reset narrative deserves no weight in serious investment analysis
- Gold has undergone 12 significant corrections in its multi-decade bull market, and the structural case for the asset class remains intact
- The $6,000 gold price target articulated by experienced market participants remains a credible medium-term projection for those viewing the current drawdown as cyclical
- CME micro contract launches and the shift to 24/7 trading will broaden market access while structurally reducing sharp volatility spikes over time
This article contains forward-looking analysis and market commentary intended for informational and educational purposes only. All price projections, scenario analyses, and market predictions involve inherent uncertainty and should not be construed as financial advice. Readers should conduct their own due diligence and consult a qualified financial adviser before making any investment decisions.
Want to Stay Ahead of the Next Major Mineral Discovery on the ASX?
While gold market mechanics and derivatives positioning create short-term volatility, the real wealth-building opportunities often emerge from significant new mineral discoveries — and Discovery Alert's proprietary Discovery IQ model instantly alerts subscribers to these high-potential ASX announcements the moment they hit the market. Explore historic discoveries and their extraordinary returns on Discovery Alert's dedicated discoveries page, and begin your 14-day free trial today to ensure you're positioned ahead of the broader market.