July 29, 2026
Understanding What Gold Mine Rankings Actually Measure
Every year, investors, geologists, and market analysts revisit the question of ranking the world's gold mines and deposits, yet many reach contradictory conclusions. The reason is straightforward: there is no single universal metric. A ranking built around annual production output tells an entirely different story from one constructed around total in-situ gold resources. Confusing the two is one of the most common and costly errors in how mining assets are assessed, whether by institutional capital allocators or retail investors scanning headline numbers.
Before interpreting any global gold mine comparison, the foundational question must be: what exactly is being measured?
When big ASX news breaks, our subscribers know first
Production Output vs. In-Situ Resources: Two Entirely Different Scorecards
Annual production rankings measure how many troy ounces a mine extracts and processes within a calendar year. This is an operational metric, heavily influenced by processing capacity, ore grade, mill throughput, and labour efficiency. A mine can rank among the world's top producers while sitting on a relatively modest total resource base, simply because it processes material at an extraordinary rate.
In-situ resource rankings, by contrast, capture the total estimated gold content within a deposit, regardless of whether it is economically recoverable at current prices or processing technology. A deposit holding 100 million ounces in-situ might never produce a single ounce if grades are too low, metallurgy is complex, or the surrounding environment makes permitting prohibitive.
"A mine ranked first by annual production may not hold the world's largest gold resource. Whether a ranking measures what is in the ground versus what is being extracted per year is essential context for interpreting any global gold mine comparison accurately."
Why Grade Matters as Much as Size: The g/t Au Equation Explained
Gold grade, expressed in grams per tonne (g/t Au), is arguably the single most important variable in determining whether a deposit can generate sustainable economic returns. A 10-million-ounce deposit grading 0.3 g/t Au is fundamentally less valuable in operational terms than a 3-million-ounce deposit grading 8.0 g/t Au, because the latter requires processing far less rock to recover each ounce of gold.
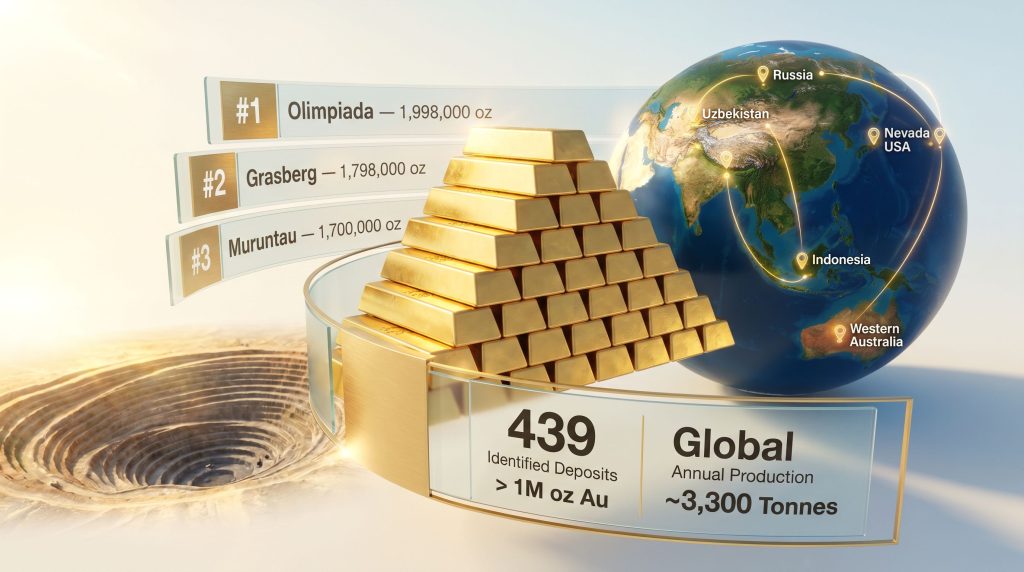
This distinction becomes critical when evaluating the global pipeline of undeveloped deposits. Research compiled from public filings and geological surveys reveals that the 439 identified gold deposits exceeding 1 million ounces globally include both operating mines and projects at various stages of development. Of the 189 producing gold mines worldwide, the average grade is approximately 1.06 g/t Au. The average grade across all undeveloped deposits sits at 0.66 g/t Au, a differential of 0.40 g/t Au that carries profound implications for the economics of future gold supply.
| Metric | Global Figure |
|---|---|
| Identified deposits exceeding 1 million oz Au | 439 |
| Active producing gold mines globally | 189 |
| Average grade, producing mines | 1.06 g/t Au |
| Average grade, undeveloped deposits | 0.66 g/t Au |
| Global annual production (approximate) | ~3,300 tonnes |
"The grade differential between producing mines and undeveloped deposits is not a random geological curiosity. It reflects a structural reality: the highest-grade ore bodies were the first to be discovered and mined, because their economics were most compelling. What remains in the undeveloped pipeline is, on average, lower quality, harder to process, and more capital-intensive to bring into production."
How Public Filings, Geological Surveys, and NI 43-101 Reports Power Global Rankings
The data underpinning global gold mine rankings originates from a range of standardised public disclosures. In Canada and Australia, NI 43-101 and JORC Code compliant technical reports form the backbone of resource estimation. Companies listed on the TSX, ASX, NYSE, and other exchanges are required to disclose resource and reserve figures according to these regulated frameworks, providing a relatively consistent foundation for cross-border comparison.
The process of constructing a comprehensive global ranking typically involves:
- Data collection from NI 43-101 technical reports, company annual reports, and national geological survey publications.
- Standardisation of all resource figures into troy ounces using consistent cut-off grade assumptions to ensure comparability.
- Classification of deposits into measured, indicated, and inferred resource categories according to confidence level.
- Verification through cross-referencing against operator disclosures, independent auditor statements, and regulatory filings.
- Ranking by total contained ounces for in-situ comparisons, or by annual output for production-based lists.
| Term | Definition | Confidence Level |
|---|---|---|
| Measured Resource | Highest confidence estimate, sufficient drilling density | Very High |
| Indicated Resource | Reasonable confidence, moderate drilling density | High |
| Inferred Resource | Low confidence, limited drilling data | Moderate |
| Proven Reserve | Measured resource with positive economic assessment | Bankable |
| Probable Reserve | Indicated resource with positive economic assessment | Bankable |
| In-Situ Resource | Total contained metal regardless of economic viability | Conceptual |
Furthermore, rankings shift year to year as exploration drilling expands resource estimates, mine depletion reduces remaining reserves, and reclassification events upgrade or downgrade confidence categories. A deposit can move substantially up or down a global ranking without a single ounce being extracted, simply because new drilling has refined the geological model. Understanding mineral deposit tiers is therefore essential context for any investor interpreting these movements.
Top 10 Largest Producing Gold Mines in the World
Measured by annual production output, the world's top ten gold mines collectively account for a significant share of global supply. What distinguishes these operations from the other 179 producing mines is not only their scale but also the combination of geological endowment, processing infrastructure, and operational efficiency that enables sustained high output. For a deeper breakdown, a comprehensive look at the largest gold mines by production provides further context on how these assets compare globally.
| Rank | Mine | Location | 2022 Production (oz) | Primary Operator |
|---|---|---|---|---|
| 1 | Olimpiada | Russia | 1,998,000 | Polyus |
| 2 | Grasberg | Indonesia | 1,798,000 | Freeport-McMoRan |
| 3 | Muruntau | Uzbekistan | 1,700,000 | Navoi |
| 4 | Carlin Trend | USA (Nevada) | 1,571,000 | Nevada Gold Mines |
| 5 | Boddington | Australia | 813,000 | Newmont |
| 6 | Kibali | DR Congo | 749,000 | Barrick/AngloGold |
| 7 | Detour Lake | Canada | 732,570 | Agnico Eagle |
| 8 | Cortez | USA (Nevada) | 731,700 | Nevada Gold Mines |
| 9 | Pueblo Viejo | Dominican Republic | 713,300 | Barrick/Newmont |
| 10 | Lihir | Papua New Guinea | 701,800 | Newmont |
The Olimpiada Mine: Russia's Dominant Gold Asset
Polyus PJSC's Olimpiada mine in the Yenisei Ridge of Siberia produced approximately 1,998,000 ounces in 2022, the highest single-mine annual output recorded globally. This single operation contributes more than half of Polyus's total company-wide annual production, with processing capacity exceeding 13 million tonnes per annum. For international investors, however, the mine's Russian jurisdiction introduces a geopolitical risk premium that cannot be separated from its operational excellence.
Grasberg: The Dual-Commodity Giant
Freeport-McMoRan's Grasberg operation in Papua, Indonesia, holds an estimated 88.1 million ounces of in-situ gold resources, making it the largest single gold resource among all producing mines globally. Producing approximately 1,798,000 ounces in 2022, it simultaneously ranks as the world's largest copper mine by output. Located at over 4,000 metres elevation in the Sudirman Mountain Range, the mine is transitioning from decades of open-pit extraction to underground block-cave mining, a technically complex shift requiring billions in capital investment.
Muruntau: Central Asia's Open-Pit Colossus
Operated by the state-owned Navoi Mining and Metallurgical Company, Uzbekistan's Muruntau mine produced approximately 1,700,000 ounces in 2022 and accounts for over 80% of the country's entire national gold output. One of the deepest open-pit gold mines ever constructed, reaching approximately 600 metres below surface, it operates in desert conditions presenting extreme logistical and climatic challenges. Its dominance within Uzbekistan illustrates how a single tier-1 asset can define a nation's entire commodity export profile.
The Carlin Trend: Nevada's Invisible Gold Phenomenon
The Carlin Trend complex in Nevada, operated under the Nevada Gold Mines joint venture between Barrick Gold and Newmont, produced approximately 1,571,000 ounces in 2022 across its component operations. What makes Carlin-type deposits geologically unique is the nature of gold mineralisation itself.
"Carlin-type gold deposits contain micron-scale gold particles locked within arsenian pyrite, invisible to the naked eye and undetectable by conventional visual inspection. This form of mineralisation requires specialised processing methods, including pressure oxidation or roasting, that are not used at standard gold operations. The discovery of this deposit style in Nevada during the 1960s fundamentally changed understanding of gold mineralisation globally."
Australia, Africa, and the Americas: Rounding Out the Top Ten
- Boddington Mine (Australia): Newmont's Boddington operation in Western Australia produced approximately 813,000 ounces in 2022, making it Australia's largest single open-pit gold mine. Significant copper by-product credits reduce effective production costs.
- Kibali Mine (DR Congo): The Barrick Gold and AngloGold Ashanti joint venture produced approximately 749,000 ounces in 2022. Notably, Kibali generates its own hydropower through a series of hydroelectric stations, achieving an unusual degree of energy self-sufficiency that materially reduces operating costs in a remote jurisdiction.
- Detour Lake (Canada): Now operated by Agnico Eagle following the Kirkland Lake Gold merger, Detour Lake produced approximately 732,570 ounces in 2022 and holds an undeveloped resource base of 29.1 million ounces, suggesting significant production upside with further development capital.
- Cortez (Nevada, USA): Part of the broader Nevada Gold Mines complex, Cortez produced approximately 731,700 ounces in 2022 as a hybrid underground and open-pit operation benefiting from Nevada's established regulatory and infrastructure environment.
- Pueblo Viejo (Dominican Republic): The Barrick/Newmont joint venture produced approximately 713,300 ounces in 2022, with expansion plans targeting increased throughput and positioning the Caribbean Basin as a meaningful contributor to global gold supply.
- Lihir (Papua New Guinea): Operated by Newmont and located within an ancient volcanic crater on Lihir Island, this operation produced approximately 701,800 ounces in 2022. Its resource base of 56.0 million in-situ ounces ranks it second among all producing mines by contained gold.
The World's Largest Undeveloped Gold Deposits
When ranking the world's gold mines and deposits by total in-situ resource rather than production, the landscape shifts dramatically. The largest undeveloped deposits dwarf most operating mines in terms of contained ounces, yet geological scale does not automatically translate into development viability. According to data available via the Wikipedia list of largest gold mines by production, several major assets have historically cycled between development stages, further illustrating the complexity of bringing large deposits to production.
| Rank | Deposit | Location | In-Situ Resource | Status |
|---|---|---|---|---|
| 1 | Pebble | Alaska, USA | 107.3 million oz | Contested, environmental review |
| 2 | KSM | British Columbia, Canada | 64.0 million oz | Advanced exploration |
| 6 | Snowfield | British Columbia, Canada | 35.0 million oz | Pre-development |
| 10 | Detour Lake | Ontario, Canada | 29.1 million oz | Now in production |
| 19 | Brucejack | British Columbia, Canada | 17.1 million oz | Now in production |
| 23 | Courageous Lake | Northwest Territories, Canada | 11.4 million oz | Advanced exploration |
| 26 | Galore Creek | British Columbia, Canada | 10.7 million oz | Pre-development |
| 27 | Hammond Reef | Ontario, Canada | 10.5 million oz | Pre-development |
The Pebble Deposit: 107 Million Ounces That May Never Be Mined
The Pebble deposit in Alaska holds an estimated 107.3 million ounces of in-situ gold resources, placing it far ahead of any other undeveloped deposit globally. Yet it represents one of the most striking examples in modern mining history of the gap between geological endowment and investable value.
Pebble sits adjacent to the Bristol Bay watershed, which supports one of the world's most productive wild sockeye salmon fisheries. The intersection of a world-class mineral deposit with a world-class ecological resource has produced a regulatory and legal standoff spanning decades. Environmental opposition, combined with the deposit's relatively low average grade, has repeatedly prevented the project from advancing through permitting.
"At a processing rate of 200,000 tonnes per day, Pebble's mine life could theoretically extend beyond 100 years. Yet its proximity to Bristol Bay has made it among the most contested mining projects in North American history. Investors have learned, often at significant cost, that geological scale and investment merit are entirely separate questions when environmental complexity is this severe."
This dynamic is not unique to Pebble. It reflects a broader pattern across giant low-grade deposits globally: the sheer volume of ore required to recover economic gold quantities means that infrastructure footprint, water usage, and tailings management become proportionally more contentious as deposit size increases.
Canada's Extraordinary Undeveloped Gold Inventory
Canada leads all nations in the number of identified gold deposits exceeding the 1-million-ounce threshold, driven by prolific geology across British Columbia, Ontario, Quebec, and the Northwest Territories. British Columbia alone hosts several of the world's most significant undeveloped gold assets:
- KSM (Seabridge Gold): At 64.0 million ounces, the KSM deposit in northern British Columbia ranks second globally among undeveloped projects, though its remote location and capital intensity present formidable development challenges.
- Snowfield: Holding approximately 35.0 million ounces, Snowfield represents another substantial British Columbia resource requiring significant infrastructure investment to bring to production.
- Galore Creek: The 10.7 million ounce copper-gold project in northwestern British Columbia has been co-developed by NovaGold Resources and Teck Resources, with infrastructure access remaining a key development constraint.
Ontario contributes Hammond Reef at 10.5 million ounces, while the Northwest Territories hosts Courageous Lake at 11.4 million ounces, both remaining in pre-development stages. The transition of Detour Lake from this undeveloped list into active production at over 730,000 ounces annually demonstrates that Canadian deposits can successfully make this journey when geology, capital, and permitting align.
National Gold Production Rankings: Country-Level Analysis
Country-level rankings reveal dynamics that individual mine rankings cannot capture. The top gold-producing countries show considerable variation in how national output is structured, with China producing roughly 10% of global gold output annually across more than 127 operating mines, none of which individually reach the global top ten. This distributed production model contrasts sharply with Uzbekistan, where a single mine at Muruntau delivers over 80% of national output. Data from the World Gold Council's production statistics further highlights how dramatically national output structures differ across jurisdictions.
| Country | Approximate Share of Global Output | Notable Characteristics |
|---|---|---|
| China | ~10% | 127+ operating mines, no single mine in global top 10 |
| Russia | ~9% | Olimpiada alone ~2 million oz per year, geopolitical risk premium |
| Australia | ~9% | Boddington flagship, strong regulatory environment |
| Canada | ~6% | Leads in deposits exceeding 1 million oz, Detour Lake, Agnico Eagle |
| USA | ~6% | Nevada dominates via Carlin Trend and Cortez |
| Uzbekistan | ~4% | Muruntau single-mine dominance |
| Ghana | ~4% | West Africa's leading producer |
| DR Congo | ~3% | Kibali driving production growth |
| Indonesia | ~3% | Grasberg transitioning underground |
| Papua New Guinea | ~2% | Lihir and Hidden Valley |
South Africa's decline from its former position as the world's dominant gold producer represents one of the most significant structural shifts in modern mining history. Decades of deep-level underground extraction have exhausted the highest-grade reef ore bodies, while rising costs and infrastructure challenges have progressively eroded competitiveness. South Africa, which once produced the majority of the world's annual gold supply, now sits outside the global top five by national output.
Canada presents a different paradox: despite leading the world in the count of deposits exceeding 1 million ounces, its national production share of approximately 6% reflects the fact that much of this inventory remains undeveloped. The country's regulatory rigour, environmental standards, and capital requirements create longer development timelines than some competing jurisdictions, though they also produce operations with greater long-term social licence and asset stability.
The Grade Depletion Dynamic and Its Investment Implications
The 0.40 g/t Au gap between the average grade of currently producing mines and the global undeveloped deposit pipeline is one of the most consequential structural trends in the gold mining sector. It is not simply a geological observation; it is a forward-looking cost signal. Consequently, current gold exploration trends increasingly focus on deeper, more technically complex targets as the shallow, high-grade inventory diminishes.
Lower-grade ore processing requires proportionally greater energy consumption, water usage, reagent inputs, and capital investment per recovered ounce. All-in sustaining costs (AISC) for future gold supply are therefore structurally higher than those of the current producing base, even before accounting for inflation in labour, equipment, and energy.
The mechanism driving this trend is straightforward: exploration has been conducted for centuries, and the most accessible, highest-grade deposits were identified and developed first because their economics were most compelling. What remains in the undeveloped pipeline reflects geology that was historically passed over, either because grades were insufficient at earlier gold price levels, because metallurgy was too complex for available technology, or because locations were too remote for viable infrastructure development at historical capital costs.
"A deposit ranked in the global top 10 by in-situ ounces does not automatically represent a superior investment. Jurisdiction, metallurgical complexity, infrastructure access, and permitting timelines all determine whether large resource endowments translate into economic value. Pebble's 107.3 million ounces, for example, remains entirely stranded from a capital deployment perspective despite its extraordinary geological scale."
The next major ASX story will hit our subscribers first
Investment Considerations: What Rankings Reveal for Capital Allocation
Tier-1 Assets and Valuation Premiums
Mines and deposits that consistently appear at the top of global rankings by production output typically command valuation premiums relative to smaller peers, reflecting lower unit cost structures, greater operational leverage to gold price, and longer mine lives. The concentration of tier-1 assets among a small number of major operators including Barrick Gold, Newmont, Agnico Eagle, and Polyus reflects both the capital required to develop and sustain such operations and the organisational complexity of managing them.
Joint ventures have emerged as a critical mechanism for unlocking tier-1 assets. Kibali, Pueblo Viejo, and the Nevada Gold Mines complex all involve partnerships between major producers, allowing capital, technical expertise, and risk to be shared across operations that would be prohibitively complex or expensive for any single company to manage independently. For investors seeking exposure to these dynamics, gold mining stocks offer varying degrees of leverage to tier-1 asset performance depending on portfolio composition.
Jurisdiction Risk as an Invisible Variable
Production rankings present mine output in a standardised format that can obscure significant differences in political, regulatory, and operational risk. The Olimpiada mine's position at the top of global production rankings does not eliminate the geopolitical risk premium associated with Russian-domiciled assets for international investors. Similarly, Kibali's impressive technical performance in the Democratic Republic of Congo must be weighed against the broader risks of operating in one of the world's most challenging jurisdictions.
Investors using global mine rankings as a primary analytical tool should, however, treat jurisdiction as a critical filter applied before, not after, assessing production metrics or resource estimates.
The Undeveloped Pipeline as a Forward Supply Signal
The aggregate resource inventory held within the undeveloped deposit pipeline provides a long-range signal about the future trajectory of gold supply. With average grades of 0.66 g/t Au across undeveloped deposits and many of the largest projects facing significant environmental or permitting barriers, the pathway from current exploration inventory to future production is neither linear nor guaranteed.
For gold price modelling purposes, the structural difficulty of converting undeveloped low-grade inventory into operating mines supports a sustained cost floor for gold supply, which has historically been a constructive backdrop for gold prices over multi-year cycles.
Frequently Asked Questions: Ranking the World's Gold Mines and Deposits
What is the largest gold mine in the world by annual production?
The Olimpiada mine in Krasnoyarsk, Russia, operated by Polyus PJSC, produced approximately 1,998,000 troy ounces in 2022, representing the highest single-mine annual output recorded globally.
What is the largest undeveloped gold deposit in the world?
The Pebble deposit in Alaska holds an estimated 107.3 million ounces of in-situ gold resources. It remains in a prolonged permitting and environmental review process with no confirmed development pathway.
Which country has the most gold deposits exceeding 1 million ounces?
Canada leads all nations in the number of identified deposits exceeding the 1-million-ounce threshold, with significant concentrations in British Columbia, Ontario, Quebec, and the Northwest Territories.
How many gold mines are operating globally?
Approximately 189 producing gold mines have been identified globally, drawn from a total of 439 deposits exceeding 1 million ounces of gold, the majority of which remain undeveloped.
What is the average grade of a producing gold mine?
The global average grade for active producing gold mines is approximately 1.06 g/t Au, compared to 0.66 g/t Au for undeveloped deposits globally.
Why do undeveloped deposits carry lower average grades than producing mines?
Higher-grade deposits were historically the first to be discovered and developed because their economics were most favourable at lower gold price levels and with simpler processing technology. The remaining undeveloped pipeline therefore skews toward lower-grade, more technically complex mineralisation requiring advanced processing methods and higher capital investment per recovered ounce.
What is the difference between a production ranking and a resource ranking?
Production rankings measure annual output in troy ounces, reflecting operational performance. Resource rankings measure total contained in-situ gold, reflecting long-term geological endowment. A mine can rank first in annual production while holding substantially fewer total ounces than a large undeveloped deposit ranked lower on the resource list. Using both metrics together provides a more complete picture of asset quality.
Disclaimer: This article is provided for informational and educational purposes only. It does not constitute financial advice or a recommendation to buy or sell any security or investment product. Historical production figures and resource estimates are drawn from publicly available sources and may have been updated since publication. All investment decisions should be made with reference to independent financial advice and current company disclosures. Resource and reserve estimates are subject to material uncertainty and should not be treated as guarantees of future production or economic outcomes.
Want To Know Which ASX Gold Discoveries Could Be The Next Tier-1 Asset?
Discovery Alert's proprietary Discovery IQ model delivers real-time alerts the moment significant mineral discoveries are announced on the ASX, instantly translating complex geological data into actionable investment opportunities — explore historic discovery returns to understand the potential scale of early-mover advantage, then begin your 14-day free trial at Discovery Alert to position yourself ahead of the broader market.