
August 8, 2026
The Invisible Cost Dividing the Gold Sector
Every tonne of rock moved, every litre of diesel burned, and every kilowatt-hour of electricity consumed at a gold mine leaves behind an emissions signature. For most of the industry's history, that signature was an afterthought. Today, it is becoming one of the most consequential financial variables in the sector, quietly reshaping how capital is allocated, how assets are valued, and which producers gain access to the most competitive financing terms.
The metric at the centre of this shift is gold miners carbon intensity, measured in tonnes of CO₂ equivalent per ounce of gold produced (tCO₂e/oz). What began as an environmental reporting obligation has evolved into a hard screening criterion embedded in institutional mandates, sustainability-linked debt structures, and equity portfolio construction frameworks. Understanding how this metric works, where producers stand relative to one another, and what drives the differences between them is no longer optional for serious investors in the gold sector.
When big ASX news breaks, our subscribers know first
What Carbon Intensity Actually Measures in a Mining Context
Carbon intensity in gold mining is a normalised efficiency metric. It does not measure total emissions in absolute terms; it measures how many tonnes of greenhouse gases are released for every ounce of gold brought to market. This normalisation matters enormously because it allows meaningful comparisons between producers of vastly different scales.
Emissions are typically categorised across three scopes:
- Scope 1 covers direct combustion from diesel engines, blasting, and any on-site fuel burning
- Scope 2 captures indirect emissions from purchased electricity, reflecting the carbon content of the grid or generation source supplying the operation
- Scope 3 encompasses the broader value chain, including equipment manufacturing, reagent production, contractor activities, and downstream refining
Most industry reporting and institutional screening currently focuses on Scope 1 and Scope 2 combined, as these are the emissions most directly within an operator's control. However, Scope 3 frameworks are expanding under disclosure standards like TCFD and the ISSB's IFRS S2 climate standard, and forward-looking investors are beginning to scrutinise full-chain exposure.
Key Concept: Carbon intensity in gold mining is not simply an environmental reporting obligation. It is a financial variable that directly influences cost structures, access to capital, and long-term asset valuations. As carbon pricing mechanisms expand globally, high-intensity producers face a structurally widening cost disadvantage.
The Global Benchmark: Where the Gold Industry Actually Stands
Industry-Wide Carbon Intensity Averages Across Mine Types
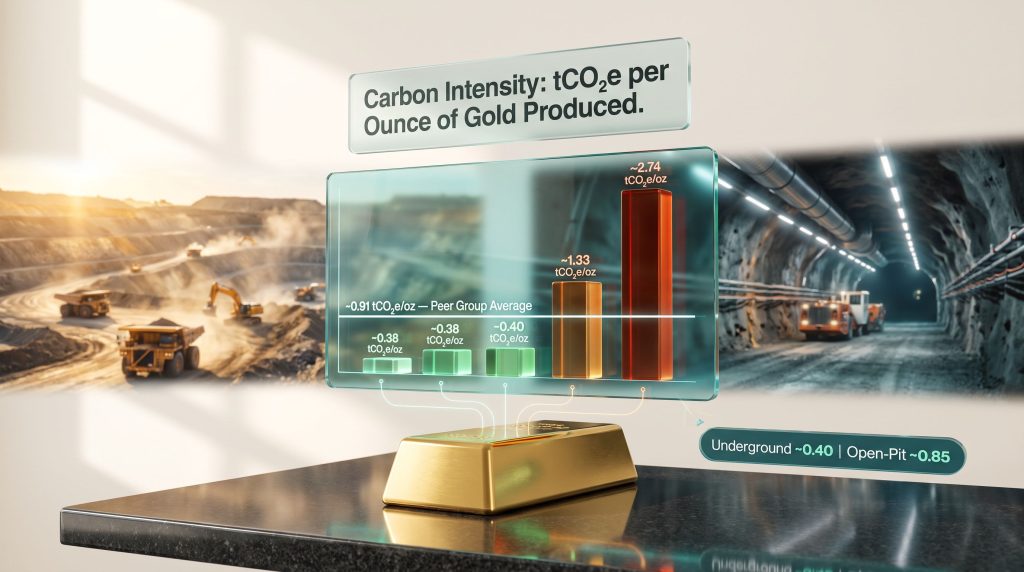
The peer-group average for gold producers currently sits at approximately 0.91 tCO₂e/oz, functioning as an informal institutional compliance threshold. This figure, consistent with S&P Global data which recorded approximately 0.792 tCO₂e/oz for primary gold mines in 2022 before updated peer-group calculations, has been trending downward as producers shift toward renewable electricity procurement and reduce Scope 2 exposure. Despite this trend, the variance across the sector remains extraordinarily wide.
| Mine Category | Average Carbon Intensity (tCO₂e/oz) | Key Driver |
|---|---|---|
| Global average (all mines) | ~0.79–0.91 | Mixed open-pit and underground |
| Open-pit mines | ~0.85 | High stripping ratios, diesel haulage |
| Underground mines | ~0.40 | Concentrated ore zones, lower waste |
| South African operations | ~3.25 | Deep-level, energy-intensive extraction |
| WA peer group range | 0.37–1.00 | Grid access, ore grade variation |
The range from below 0.40 tCO₂e/oz to above 3.0 tCO₂e/oz is not primarily a reflection of corporate ambition or sustainability intent. It reflects deep structural differences rooted in geology, geography, mining method, and energy access. This distinction is critical for investors: a company cannot simply decide to halve its carbon intensity through policy commitments alone. The pathway runs through asset-level engineering and geological reality.
Furthermore, understanding gold equities performance in the context of carbon intensity is becoming increasingly relevant for institutional portfolio managers seeking to differentiate between producers on more than just headline production metrics.
Why the 0.91 tCO₂e/oz Threshold Functions as an Institutional Screening Benchmark
ESG-aligned fund managers use the peer-group average as a compliance threshold when constructing climate-screened portfolios. Producers operating above this level face incremental capital cost penalties through several mechanisms:
- Higher borrowing costs through ESG-linked debt covenants that carry margin ratchets tied to emissions performance
- Exclusion from climate-aligned institutional mandates, particularly those originating from European pension funds and sovereign wealth vehicles
- Potential divestment pressure as portfolio managers rotate capital toward below-average performers
- Reduced access to sustainability-linked financing instruments, including green bonds and sustainability-linked loans
Producers below the benchmark gain the inverse advantages: preferential financing terms, a broader institutional shareholder base, and the beginning of a compounding valuation premium that only widens as carbon prices rise.
What Drives Carbon Intensity Differences Across Gold Operations?
The Structural Role of Ore Grade and Mining Method
If there is one variable that explains the carbon intensity spread across the gold sector more than any other, it is ore grade. The relationship is direct and unavoidable: lower-grade deposits require processing more rock per ounce of gold recovered, which means more diesel consumed in haulage, more energy expended in grinding circuits, and more reagents consumed in flotation and leaching.
Underground mines targeting high-grade, narrow-vein mineralisation average approximately 0.40 tCO₂e/oz, compared to roughly 0.85 tCO₂e/oz for open-pit operations. That differential of more than 50% is not explained by technology gaps or management quality. It is the direct outcome of processing volumes and ore selectivity.
The Diesel Dependency Problem
For remote and off-grid mining operations, diesel combustion dominates Scope 1 emissions. Diesel dependency creates a compound liability that is poorly appreciated outside specialist circles:
- It generates direct carbon emissions that drive intensity above peer benchmarks
- It creates exposure to fossil fuel price volatility, making operating cost forecasts structurally less reliable
- It imposes what analysts increasingly refer to as a stranded diesel cost, the ongoing premium remote operators pay relative to grid-connected peers with no clear near-term resolution pathway
This dual financial and environmental exposure means off-grid operators face growing pressure from both capital markets and cost competitiveness simultaneously.
Waste Rock Movement and Processing Intensity
High stripping ratios amplify both fuel consumption and carbon output per ounce in open-pit operations. A mine with a stripping ratio of 5:1 must move five tonnes of waste for every tonne of ore processed. At large-scale, low-grade operations, this can mean hauling tens of millions of tonnes annually using diesel-powered fleets.
Sensor-based ore sorting, a pre-concentration technology using colour and density sensors to reject barren waste rock before it enters the mill, represents one of the most commercially mature responses to this challenge. By reducing processed tonnage upstream of the mill, ore sorting simultaneously decreases grinding energy demand, flotation reagent consumption, water usage, and diesel trucking requirements. The technology delivers dual financial and ESG benefits: lower all-in sustaining costs and reduced carbon intensity. This is not a marginal improvement; for operations where barren material constitutes a significant fraction of mill feed, the downstream effects cascade across every energy-consuming step in the process chain.
How Major Gold Producers Compare on Carbon Intensity
A Comparative Emissions Intensity Ranking Across the Sector
The spread of reported carbon intensities across named gold producers illustrates the structural nature of the divide:
| Producer | Reported Intensity (tCO₂e/oz) | Variance vs. ~0.91 Benchmark | Primary Mine Type |
|---|---|---|---|
| Agnico Eagle | ~0.38 | −58% | Underground-dominant |
| AngloGold Ashanti | ~0.55 | −40% | Mixed underground |
| Serabi Gold | ~0.57 | −37% | Narrow-vein underground |
| Endeavour Mining | ~0.63 | −31% | Open-pit and underground |
| Peer Group Average | ~0.91 | Baseline | Mixed |
| Gold Fields | ~1.19 | +31% | Open-pit dominant |
| Barrick Gold | ~1.33 | +46% | Large open-pit |
| Fresnillo | ~1.51 | +66% | Open-pit polymetallic |
| Harmony Gold | ~2.74 | +201% | Deep-level South African |
Several observations stand out from this data. First, scale does not confer carbon efficiency. Agnico Eagle, a major producer by any measure, achieves sector-leading intensity through a portfolio dominated by underground operations with access to Canada's renewable-heavy electricity grid. Harmony Gold, by contrast, operates deep-level South African mines using aged infrastructure connected to one of the world's most carbon-intensive national grids, producing intensity levels more than three times the global average. This exposes Harmony to severe carbon taxation penalties and materially restricts its access to ESG-aligned debt refinancing.
Second, mid-tier and junior underground producers can structurally outperform billion-dollar majors on this metric. Serabi Gold, operating narrow-vein underground mines in Brazil's Tapajós region, reports 0.57 tCO₂e/oz, placing it alongside the sector's recognised ESG leaders and 37% below the peer group average of 0.91 tCO₂e/oz.
What the Fresnillo-to-Agnico Eagle Gap Reveals About Mine Design
The 1.13 tCO₂e/oz gap between Fresnillo at 1.51 tCO₂e/oz and Agnico Eagle at 0.38 tCO₂e/oz is one of the most instructive comparisons in the sector. This is not a compliance failure on Fresnillo's part. It is the structural engineering and geological outcome of operating polymetallic open-pit systems with complex, multi-stage processing circuits versus running a portfolio of high-grade underground operations in jurisdictions with low-carbon grid power.
This comparison underlines a principle that institutional analysts are increasingly applying to portfolio construction: carbon intensity must be evaluated at the asset level, not the corporate level. A company can have a strong sustainability report while still holding individual assets that carry significant carbon liability relative to peers. According to research on gold mining greenhouse gas emissions, abatement measures vary considerably by mine type, further reinforcing why asset-level analysis is essential.
Can Technology Close the Carbon Gap? Decarbonisation Pathways for Gold Miners
Grid Electrification: The Highest-Impact Intervention
Replacing diesel generation with grid-sourced electricity eliminates the largest single source of Scope 1 emissions at remote operations. When the connecting grid draws from renewable generation such as hydropower, wind, or solar, the compound benefit extends to Scope 2 reduction as well. Beyond the carbon benefit, grid electrification reduces exposure to diesel price volatility and improves operating cost predictability, which has direct implications for asset net present value.
The capital barrier is real. High-voltage transmission infrastructure competes directly with mine development budgets. For a junior producer executing underground development programs, this trade-off is not theoretical. Serabi Gold, for example, has been simultaneously managing approximately US$15 million in annual underground development at its Coringa project while progressing a grid connection strategy targeting connection to Brazil's renewable-heavy national network. Brazil's grid is predominantly hydropower-sourced, meaning successful connection would simultaneously reduce carbon intensity and operating costs by 2027.
Sensor-Based Ore Sorting
Colour and density sensors can reject barren waste rock before it reaches the mill, reducing processed tonnage per ounce and generating downstream reductions in grinding energy, flotation reagent consumption, water usage, and diesel trucking. This technology is particularly valuable for underground narrow-vein operations where waste dilution in development drives is unavoidable. The dual benefit of cost reduction and emissions reduction makes it one of the most commercially rational decarbonisation investments available at the mine level.
Renewable Energy Procurement and Hybrid Systems
Renewable energy in mining is increasingly being adopted as a practical intermediate pathway for operations that cannot achieve grid connection in the near term, through long-term power purchase agreements for solar, wind, or hydro generation. Hybrid diesel-solar systems at remote operations can reduce diesel consumption by 20 to 40 percent depending on solar irradiance and battery storage capacity. Battery energy storage systems also stabilise hybrid grids, reducing curtailment and enabling higher renewable penetration.
Battery-Electric Underground Fleet Electrification
Battery-electric load-haul-dump machines and underground trucks eliminate diesel exhaust at the working face. Beyond the direct Scope 1 reduction, electric LHDs reduce underground ventilation energy requirements because diesel exhaust gases are the primary driver of ventilation demand in deep underground mines. This creates a secondary emissions and cost benefit that is frequently underappreciated in surface-level analysis.
The next major ASX story will hit our subscribers first
Real-World Barriers to Decarbonisation in Remote Jurisdictions
Capital Allocation Conflicts
The central tension facing junior and mid-tier operators is that grid connection infrastructure competes directly with mine development capital. The financial mathematics are challenging: a producer allocating capital to underground development and mill expansion must weigh those investments against the multi-million-dollar cost of building high-voltage transmission corridors through remote terrain. For junior operators without the balance sheet flexibility of senior majors, this creates a sequencing problem with no obvious easy resolution.
Regulatory and Permitting Timelines
Environmental impact assessments for transmission corridors in ecologically sensitive biomes, particularly tropical rainforest regions like the Amazon, can require multi-year biodiversity monitoring programs before corridor approvals are granted at state and federal levels. This regulatory uncertainty compounds financing risk for operators attempting to fund grid connections through project-level debt, as lenders require greater certainty on timelines before committing capital.
Social License and Indigenous Community Engagement
Transmission corridors frequently cross indigenous territories, triggering formal consent obligations under national and international legal frameworks. This is not merely a procedural hurdle. It is a relationship management challenge that can span years and requires genuine, sustained investment in community trust.
Serabi Gold's experience in Brazil's Tapajós region illustrates this dynamic. The company has operated in the region for approximately two decades, cultivated relationships with indigenous community leaders over many years, invested approximately US$1 million in regional infrastructure, health, education, and environmental remediation, and operates an on-site nursery cultivating 1,201 native trees to reclaim historical workings. This sustained regional commitment, rather than a transactional approach to consent, is what creates a durable social licence advantage.
Strategic Insight: In remote jurisdictions, the social and regulatory pathways to grid electrification are often longer and more complex than the engineering pathway. Operators with established multi-decade regional presence face materially lower consent risk than new entrants, creating a structural competitive advantage in decarbonisation timelines.
How Carbon Intensity Is Reshaping Gold Equity Valuations
The ESG Screening Mechanism
Climate-aligned institutional mandates increasingly screen gold equities against peer-average carbon intensity thresholds. Divestment pressure is accumulating on high-emission producers from European institutional investors, pension funds, and sovereign wealth funds. The cost-of-capital differential this creates is not uniform: it operates through debt pricing via ESG-linked covenants and through equity valuation via the multiple compression that accompanies reduced institutional ownership.
Carbon Taxation Exposure: Translating Emissions Into Operating Costs
Carbon pricing mechanisms convert emissions intensity into a direct, quantifiable operating cost. The financial gap between a producer operating at 1.51 tCO₂e/oz and one operating at 0.38 tCO₂e/oz scales directly with the carbon price:
| Carbon Price (US$/tonne CO₂) | Cost Differential per Ounce (1.51 vs 0.38 tCO₂e/oz) |
|---|---|
| US$30 | ~US$33.90/oz |
| US$50 | ~US$56.50/oz |
| US$100 | ~US$113.00/oz |
As global carbon prices rise, this per-ounce cost gap widens structurally, with no corresponding offset for high-intensity producers unless they undertake capital-intensive transitions. The implication for free cash flow yield comparisons is significant: a producer with a projected 26% free cash flow yield but low carbon intensity carries a very different risk profile from a higher-intensity producer with a similar headline yield, once carbon cost scenarios are stress-tested across a 3 to 5 year horizon.
The Emerging Green Gold Premium
Low-emission gold producers are beginning to attract a compounding valuation advantage. The mechanism operates across multiple simultaneous channels:
- Lower energy costs relative to diesel-dependent peers
- Lower carbon tax liability per ounce as carbon prices rise
- Lower cost of capital through ESG-aligned financing access
- Broader institutional shareholder base including climate-mandate funds
- Potential premium in M&A processes as acquirers price carbon risk into asset valuations
In addition, gold M&A activity in 2025 is increasingly factoring carbon intensity into deal pricing, with acquirers applying higher risk discounts to assets that sit above peer-average emission thresholds.
Step-by-Step: How to Evaluate a Gold Producer's Carbon Intensity Profile
- Identify the reported tCO₂e/oz figure from the company's sustainability report or annual disclosure
- Benchmark against the peer-group average (~0.79–0.91 tCO₂e/oz depending on the reference dataset)
- Decompose by Scope to determine what proportion of emissions are Scope 1 versus Scope 2
- Assess the energy transition pathway, including whether the company has a funded grid connection plan, renewable PPA, or fleet electrification program
- Evaluate jurisdiction risk, considering local grid carbon intensity, regulatory environment, and carbon pricing exposure
- Stress-test under carbon price scenarios at US$30, US$50, and US$100 per tonne CO₂
- Compare AISC trajectory to determine whether decarbonisation investments are expected to reduce or increase all-in sustaining costs over a 3 to 5 year horizon
Open-Pit vs. Underground: A Structural Carbon Intensity Comparison
| Factor | Open-Pit Mining | Underground Mining |
|---|---|---|
| Average tCO₂e/oz | ~0.85 | ~0.40 |
| Primary emission driver | Diesel haul trucks, blasting | Ventilation, diesel LHDs |
| Ore grade dependency | Low grade = high intensity | High grade = low intensity |
| Waste rock movement | Very high stripping ratios | Minimal surface disturbance |
| Grid electrification potential | Moderate | High (fixed infrastructure) |
| Carbon tax exposure | High | Low to moderate |
| ESG screening outcome | Often above benchmark | Often below benchmark |
The Decade Ahead: Carbon Discipline as a Core Competitive Requirement
Regulatory Direction: Pricing, Border Adjustments, and Mandatory Disclosure
Global regulatory direction on carbon is consistent and accelerating. Expanding carbon pricing schemes, border carbon adjustment mechanisms targeting high-emission commodity imports, and mandatory climate disclosure frameworks under TCFD and ISSB standards are collectively converting what was previously a voluntary ESG metric into a mandatory financial variable with direct cost implications. The mining decarbonisation benefits that early movers are capturing — from lower energy costs to preferential financing — illustrate how regulatory alignment and commercial advantage are beginning to converge. Producers that have not begun structuring their operations around low gold miners carbon intensity will face compounding disadvantages as these mechanisms mature.
Embedding Carbon Discipline From Exploration Onward
The most sophisticated operators in the sector are no longer treating carbon intensity as a post-production reporting exercise. Forward-thinking exploration teams are prioritising high-grade underground targets over large-tonnage open-pit discoveries specifically to reduce future carbon liability. Acquisition due diligence now routinely includes carbon intensity screens to prevent portfolio-level valuation discounts.
This represents a genuine structural shift in how the gold sector allocates capital. The transition from carbon intensity as a disclosure metric to carbon intensity as a pre-investment screening criterion is still underway, but the direction is clear. Producers who internalise this shift early and build low-emission asset portfolios will carry durable competitive advantages that compound in value as regulatory and market pressures tighten over the next decade.
Consequently, gold investment trends in 2025 reflect a growing awareness among institutional allocators that carbon discipline is no longer peripheral to asset quality — it is increasingly central to it. The World Gold Council's carbon footprint working paper reinforces this view, providing a robust framework for estimating and benchmarking emissions across the gold value chain.
Further Exploration: Readers seeking additional perspectives on ESG screening in resource equities and carbon intensity benchmarking across the gold sector can explore related institutional analysis available through Crux Investor's Analyst's Notes series at cruxinvestor.com.
Disclaimer: This article contains forward-looking statements, financial projections, and carbon price scenario modelling that are inherently speculative. Past emissions performance does not guarantee future outcomes. Figures cited for individual producers are based on publicly reported data and may not reflect the most current reporting periods. This content is for informational purposes only and does not constitute financial advice. Investors should conduct independent due diligence before making investment decisions.
Want to Stay Ahead of the Next Major ASX Mineral Discovery?
Discovery Alert's proprietary Discovery IQ model delivers real-time alerts on significant ASX mineral discoveries, instantly translating complex data across more than 30 commodities into clear, actionable insights — giving subscribers a critical edge the moment opportunities emerge. Explore Discovery Alert's discoveries page to understand how historic mineral discoveries have generated substantial market returns, and begin your 14-day free trial today to position yourself ahead of the broader market.