July 21, 2026
When Mining Margins Become the Story: Understanding Gold Miners Fundamentals in a Historic Cycle
Every few decades, a commodity cycle reaches an inflection point where the underlying economics of production become more compelling than the commodity itself. The 1970s gold boom rewarded physical holders. The 2008–2011 cycle lifted miners alongside bullion. However, the current environment has created something qualitatively different: a structural compression of operating costs relative to gold prices so extreme that the profit mechanics of gold mining have been fundamentally rewritten. Understanding gold miners fundamentals in this environment is not simply an exercise in reading quarterly results. It is a window into one of the most powerful margin expansion stories the equity market has produced in modern history.
When big ASX news breaks, our subscribers know first
The Fixed-Cost Architecture That Makes Mining Margins Non-Linear
To understand why gold miners are generating earnings at a historically unprecedented pace, it helps to first understand the underlying cost architecture of a gold mine. Unlike manufacturing businesses where variable costs scale proportionally with output, gold mining operations are designed and costed at the construction phase. Processing plants are built to handle specific throughput volumes. Infrastructure, equipment fleets, and labour requirements are established based on those planned capacities. Once a mine is operating, those costs change very little from quarter to quarter regardless of how much gold ultimately comes out.
The primary variable that determines how many ounces emerge from that fixed-cost infrastructure is ore grade in mining, which measures the concentration of gold within the rock being processed. Higher-grade ore fed through a processing plant at constant throughput yields substantially more ounces against the same fixed cost base. This mechanism creates powerful operating leverage: when ore grades improve, output rises while unit costs fall simultaneously. When gold prices then rise on top of that dynamic, the per-ounce profit expansion becomes exponential rather than linear.
There are also meaningful variable costs within gold mining, particularly energy, reagents, and royalties. The reagent dimension is worth noting specifically in the context of recent geopolitical disruption. While copper recovery from ore relies heavily on sulfuric acid, gold heap-leach operations use cyanide as the primary solvent. This distinction meant that constraints on sulfur trade through the Strait of Hormuz had a materially different supply chain impact on gold miners compared to copper producers.
Energy exposure, primarily through diesel consumption, does create some cost sensitivity to crude oil prices. One major producer disclosed that even without hedging protection, a sustained crude oil price near $100 per barrel would add approximately $25 per ounce to 2026 unit costs, representing just a 1.4% increase at current operating scales. The fixed-cost dominance of mine economics makes energy price shocks far less damaging than they appear in headline commentary.
How Is the Gold Mining Sector Structured? A Tier-by-Tier Breakdown
The gold mining industry is stratified by annual production volumes, and those tiers carry very different investment characteristics. Understanding where a company sits within this structure is fundamental to assessing its earnings leverage, valuation, and risk profile. Furthermore, the types of gold mining stocks available to investors vary considerably across these tiers, from exploration-stage juniors through to globally diversified super-majors.
Defining the Four Production Tiers
| Production Tier | Annual Output Threshold | Quarterly Equivalent | Investment Profile |
|---|---|---|---|
| Small Juniors | Under 300,000 oz/year | Under 75,000 oz/quarter | Exploration-stage, high discovery optionality |
| Mid-Tier Miners | 300,000 to 1,000,000 oz/year | 75,000 to 250,000 oz/quarter | Growth-stage, high earnings leverage |
| Large Majors | Over 1,000,000 oz/year | Over 250,000 oz/quarter | Core index weighting, stable earnings base |
| Super-Majors | Over 2,000,000 oz/year | Over 500,000 oz/quarter | Dominant ETF positions, global diversification |
The VanEck Gold Miners ETF (GDX), which held approximately $29.4 billion in net assets as of mid-May 2026, concentrates its weighting heavily in the two largest tiers. The top 25 holdings within GDX represent 83.5% of total ETF weighting, with the majority being super-majors, majors, and larger mid-tier producers. Crucially, those two largest categories alone account for 50% of GDX's weighting.
Why Pure-Play Exposure Matters
One often-overlooked structural consideration involves whether ETF constituents are genuinely primary gold producers. A mining company that generates the majority of its revenues from copper, zinc, or lithium but also produces significant gold volumes does not provide pure-play exposure to gold price movements. When such companies occupy significant index weightings, they distort sector-level comparisons across quarters, particularly when their inclusion or exclusion changes the composition of the comparison period.
This matters enormously for interpreting quarterly data. A commonly cited benchmark for primary gold producer status is whether a company generates more than half of its quarterly revenues from gold. Companies that fall below this threshold, regardless of their gold production volumes, are diversified mining conglomerates rather than gold miners in a meaningful investment sense.
What Do All-In Sustaining Costs Actually Measure and Why Cash Costs Alone Are Misleading
The evolution of gold mining cost metrics reflects the industry's effort to provide investors with a meaningful picture of operational sustainability, rather than just short-term production viability.
The Difference Between Cash Costs and AISC
Cash costs represent the direct expenditure required to extract each ounce of gold from the ground and process it to saleable form. They function as a minimum viability floor, illuminating the gold price level below which a mine cannot remain operational. However, cash costs deliberately exclude the capital investment required to sustain a mine over time, including ongoing exploration to replace depleted reserves, sustaining capital expenditure to maintain equipment and infrastructure, reclamation obligations, and corporate administrative overhead.
The World Gold Council introduced All-In Sustaining Costs (AISC) in June 2013 specifically to address this gap. AISC adds all of those previously excluded categories onto the cash cost base, providing a complete picture of what it genuinely costs to keep a mining operation running at its current production tempo over an extended period. Cash costs typically represent approximately 78% of AISC, meaning the additional components are substantial rather than marginal.
The Hidden Royalty Effect
One of the least-discussed dynamics in gold mining cost analysis involves royalty obligations. Many mining operations carry royalty arrangements that require the producer to pay a percentage of revenues to landowners, governments, or streaming companies. Because these royalties are calculated as a proportion of gold revenues rather than fixed per-ounce amounts, they scale automatically with gold prices during bull markets.
This creates a counterintuitive situation: as gold prices rise, reported cash costs and AISC rise partly due to royalty escalation, even when underlying operational efficiency is constant or improving. For some producers, royalty payments represent a substantial fraction of total operating costs. One major producer disclosed that royalties accounted for one quarter of total operating costs in Q1 2026, with cash costs of $1,608 per ounce including royalties versus $1,201 per ounce excluding them.
At another producer, royalty payments surged 126.1% year-over-year to $52 million in Q1 2026. Mine-by-mine analysis revealed that higher royalties accounted for the large majority of the jump in unit mining costs from Q1 2025 to Q1 2026, in some cases representing between two-thirds and five-sixths of the total cost increase. This means that the headline AISC increase significantly overstates the deterioration in actual operational efficiency.
Key Analytical Point: When interpreting year-over-year AISC increases during gold bull markets, investors should decompose how much of the rise stems from operational cost inflation versus royalty escalation. The two have completely different implications for underlying profitability and operational health.
Seasonal Production Patterns and Their Cost Implications
Because unit costs are inversely related to production volumes, the structural seasonality of global gold output creates predictable quarterly cost fluctuations. The following pattern has held consistently across the past 15 years of global mine production data:
| Quarter | Average Sequential Production Change | Cost Implication |
|---|---|---|
| Q1 | -8.4% | Highest unit costs of the year |
| Q2 | +4.9% | Costs begin declining |
| Q3 | +6.2% | Peak output, lowest unit costs |
| Q4 | -0.0% | Stable before winter slowdown |
The Q1 weakness is explained by geography rather than operational failure. More than two-thirds of the planet's total landmass sits in the northern hemisphere, along with a proportional share of global gold mining operations. Winter conditions reduce operational efficiency across multiple dimensions: cold temperatures slow physical ore hauling, and reduced temperatures impair the chemical recovery processes used to extract gold from crushed ore in heap-leach operations.
Q1 2026 Gold Miners Fundamentals: A Record-Breaking Quarter Dissected
The Gold Price Environment
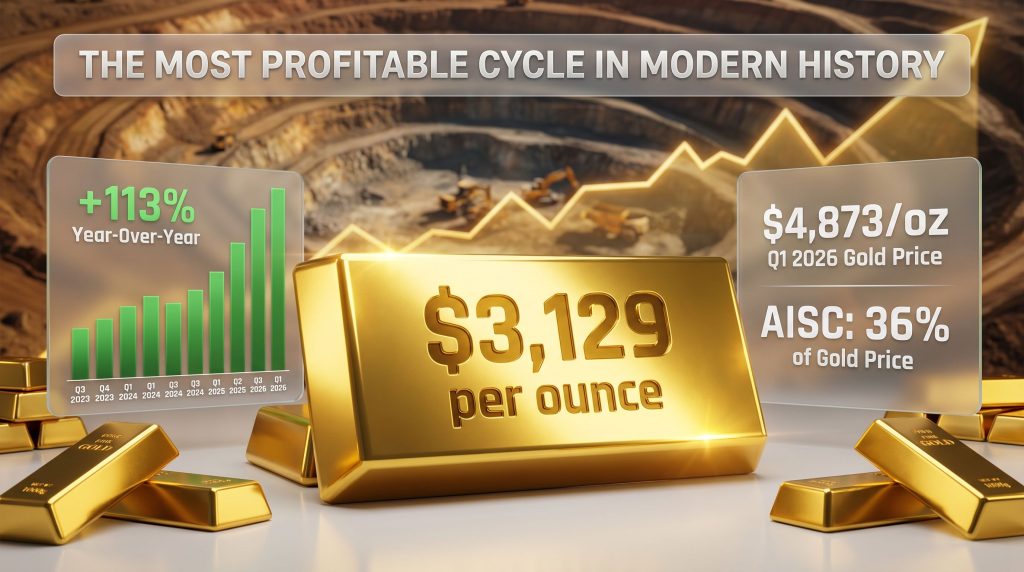
The quarterly-average gold price in Q1 2026 reached $4,873 per ounce, representing a 70.0% year-over-year increase from Q1 2025. This figure is critical to understanding miner profitability because it is the revenue base from which all per-ounce margins are calculated. While gold reached its peak levels during January before a geopolitically-driven correction in March compressed the quarterly close, the average across all trading days in the quarter remained at this historically unprecedented level. The relationship between gold and mining equities during this period has consequently produced earnings leverage that few analysts anticipated.
Production: Reading Past the Headline Decline
The top 25 GDX holdings collectively produced 7,230,000 ounces of gold in Q1 2026. The reported year-over-year decline of 10.7% appears alarming in isolation but is entirely attributable to two statistical anomalies rather than genuine operational deterioration.
The first anomaly involves a major South African producer that operates on a delayed reporting schedule, with its Q1 2026 results not yet available at the time of comparison. This company produced approximately 314,000 ounces in Q1 2025, establishing a prior-year comparison base that cannot be matched against an equivalent current-period figure.
The second anomaly involves a composition change: a large Chinese diversified mining conglomerate was removed from the GDX top 25 after years of inclusion. This conglomerate produced 613,000 ounces in Q1 2025 but represented only a fraction of its vast multi-commodity business spanning copper, zinc, lead, lithium, silver, and molybdenum. Removing both the unavailable current-quarter figure and the removed company's prior-year output from the comparison reveals that adjusted production growth for the remaining comparable producers was approximately +0.9% year-over-year. Global mine output, per World Gold Council data, grew 2.4% year-over-year in Q1 2026.
Cost Performance: Record in Absolute Terms, Record Low in Relative Terms
Average cash costs for the top 25 GDX holdings in Q1 2026 came in at $1,312 per ounce, representing a 17.5% year-over-year increase. This figure was skewed higher by one producer whose cash costs reached $2,032 per ounce due to acquisition-related accounting, specifically the allocation of purchase price to gold inventories following a completed acquisition. The company disclosed that this allocation added approximately $689 per ounce to reported cash costs, placing underlying operational costs near $1,343 per ounce. Excluding this outlier, the group average falls to approximately $1,267 per ounce, reflecting a more moderate 13.5% year-over-year increase.
Average AISC across the group reached $1,744 per ounce, an increase of 24.9% year-over-year, representing the largest annual increase recorded across 40 quarters of consistent sector-level analysis. This was also a new all-time high in absolute terms for sector-average AISC.
The critical context: Despite setting a nominal record, that $1,744 AISC represents just 36% of the Q1 2026 quarterly-average gold price of $4,873. In the five years preceding 2025, before the current gold bull market developed momentum, AISC averaged approximately 64% of prevailing gold prices. The compression from two-thirds to one-third represents one of the most dramatic structural improvements in sector profitability in the modern era of gold mining analysis.
How to Calculate Implied Unit Earnings: The Cleanest Measure of Gold Miner Profitability
Why Bottom-Line Accounting Profits Can Mislead
GAAP and IFRS earnings for major gold mining companies are routinely distorted by large non-cash charges including impairment write-downs on mines or deposits, acquisition-related amortisation, deferred tax adjustments, and fair value movements on derivatives. These items can swing reported profits dramatically from quarter to quarter without any relationship to underlying operational performance. When comparing across multiple quarters with varying ETF compositions, these distortions compound further.
Implied unit earnings resolve this problem by stripping the analysis down to its essential components: the revenue received per ounce of gold sold and the cost incurred to produce it. For investors assessing the gold price outlook for miners, this metric provides a far more reliable signal than headline accounting results.
The Q1 2026 Calculation
The arithmetic is straightforward:
- Quarterly-average gold price: $4,873 per ounce
- Average AISC (top 25 GDX holdings): $1,744 per ounce
- Implied unit earnings: $3,129 per ounce
This figure represents a 112.9% year-over-year increase from Q1 2025 and surpasses the previous record of $2,490 per ounce set just one quarter earlier in Q4 2025.
Eleven Consecutive Quarters of Accelerating Growth
What makes this result extraordinary is not the single-quarter achievement but the consistency of the trend that produced it. The following table shows year-over-year implied unit earnings growth across eleven consecutive quarters:
| Quarter | Year-Over-Year Implied Unit Earnings Growth |
|---|---|
| Q3 2023 | +87% |
| Q4 2023 | +47% |
| Q1 2024 | +31% |
| Q2 2024 | +75% |
| Q3 2024 | +74% |
| Q4 2024 | +78% |
| Q1 2025 | +90% |
| Q2 2025 | +78% |
| Q3 2025 | +83% |
| Q4 2025 | +106% |
| Q1 2026 | +113% |
Not a single quarter across this eleven-quarter span posted growth below 31%. No other major sector of the global equity market has demonstrated earnings growth of this magnitude and consistency over the same period. This is the core claim of the gold miners fundamentals case in the current cycle, and it is grounded entirely in verifiable operational data reported to securities regulators. According to gold miners' Q2 2025 fundamentals, these trends were already evident well before the Q1 2026 results confirmed their scale.
The next major ASX story will hit our subscribers first
Hard Accounting Results: What GAAP Reporting Confirms
While implied unit earnings provide the cleanest analytical signal, the GAAP results reported to regulators across the quarter confirm that operational profitability is translating into real accounting outcomes.
Total revenues for the top 25 GDX holdings in Q1 2026 reached $37,602 million, representing a 16.8% year-over-year increase. This figure understates actual revenue growth for two reasons: four major producers report on half-year cycles under the rules of their respective home-country regulators and are therefore excluded from quarterly comparisons, and the prior-year base period included the diversified Chinese conglomerate's substantial revenues, which inflated the comparable period.
Bottom-line reported earnings reached $14,393 million, up 92.2% year-over-year. Adjusting for large unusual one-time income statement items produces a very similar figure of $14,197 million, representing 90.7% year-over-year growth. The minimal difference between reported and adjusted figures is itself a meaningful signal: these earnings are primarily operational rather than accounting-driven, confirming that the profitability is genuine and repeatable rather than a consequence of one-time items.
Are Gold Mining Stocks Fairly Valued? The Valuation Disconnect Explained
The Counterintuitive Reality of Record Prices and Record-Low Valuations
GDX achieved a bull market advance of 347.1% from its October 2023 low through its late-February 2026 peak, over a period during which gold itself rose approximately 196.4%. The implied leverage ratio of approximately 1.8x sits below the historical 2x to 3x amplification that characterises typical gold bull markets, suggesting gold stocks have actually underperformed their metal on a leverage-adjusted basis despite recording historically large gains.
The explanation lies in the relationship between stock prices and earnings. When earnings grow faster than share prices over an extended period, the price-to-earnings multiple compresses even as the share price rises. This is precisely what has happened across the major gold mining sector, producing a cohort of undervalued mining stocks that trade at record-low multiples despite near-record share prices.
The trailing twelve-month average price-to-earnings ratio across the top 25 GDX holdings, as of Q1 2026 reporting, fell to 20.2x, described as the lowest level across at least 40 quarters of consistent sector-level tracking. This figure is typically skewed upward by royalty company multiples and occasionally by write-down-affected outliers, meaning the underlying valuation for operational producers is even more compressed. Furthermore, numerous major gold producers are trading at low-to-mid single-digit price-to-earnings multiples despite their share prices sitting near all-time highs.
| Metric | Major Gold Miners (Q1 2026) | Context |
|---|---|---|
| Average TTM P/E | 20.2x | Lowest level in at least 40 quarters |
| Implied Unit Earnings Growth (YoY) | +113% | Highest in at least 40 quarters |
| AISC as % of Gold Price | 36% | Record low vs. ~64% historical average |
| Bottom-Line Earnings Growth (YoY) | +92.2% | Record quarterly result |
| GDX Bull Market Leverage vs. Gold | 1.8x | Below historical 2x to 3x range |
Valuation Paradox: A stock can reach an all-time price high while simultaneously trading at its cheapest earnings multiple in a decade. This is not a theoretical scenario. It is precisely what the major gold mining sector is experiencing. Earnings have grown so much faster than share prices that the sector appears fundamentally undervalued relative to its current earnings power, despite stock prices that would have seemed extraordinary just three years ago.
What Does Q2 2026 Look Like for Gold Miner Fundamentals?
The Forward Earnings Case
With Q2 2026 already substantially underway at the time of Q1 reporting, the forward implied earnings estimate carries relatively low uncertainty compared to typical forecasting exercises.
Quarter-to-date gold in Q2 2026 is averaging approximately $4,702 per ounce, a consolidation below Q1's peak that is broadly healthy for the bull market. Despite this pullback, that level remains approximately 43% above Q2 2025's comparable average, establishing a substantial baseline for year-over-year earnings growth comparisons.
The average full-year 2026 AISC guidance across the top 25 GDX producers currently sits at $1,703 per ounce. Taking a conservative approach and assuming Q2 2026 average AISC comes in around $1,800 per ounce (accounting for any seasonal or cost pressures), implied unit earnings at the current gold price trajectory would be approximately $2,900 per ounce. This would represent year-over-year growth of approximately 56%, extending the sector's consecutive growth streak to a twelfth quarter.
The gold price level that would be required to eliminate year-over-year earnings growth entirely, given current cost structures, would need to involve a decline so severe it would effectively reverse nearly all of the current bull market's gains within six weeks. Given the structural demand drivers underpinning gold prices — including central bank accumulation programmes, currency debasement concerns, and persistent geopolitical risk premiums — no credible near-term scenario produces that outcome.
The Investment Case for Mid-Tier Miners: Where Earnings Leverage Is Greatest
Why Scale Doesn't Always Win
The largest gold producers offer stability, liquidity, and consistent index exposure. However, the most compelling earnings leverage in the current environment often resides further down the production scale. A mid-tier producer growing annual output from 200,000 to 400,000 ounces creates a dramatically different fundamental profile than a super-major maintaining 2,500,000 ounces of steady-state production.
The mechanics are straightforward: as a smaller producer expands throughput, its fixed costs are spread across a rapidly growing ounce base, compressing unit costs simultaneously with revenue growth. At higher gold prices, that margin expansion is amplified further. Super-majors with their vast existing operations simply cannot replicate this dynamic at scale. For a deeper examination of mid-tier and junior producer dynamics, Morningstar's guide to investing in gold miners provides useful context on valuation frameworks across the tier spectrum.
Comparing the Investment Case
| Factor | Large Majors and Super-Majors | Mid-Tier Producers |
|---|---|---|
| Earnings stability | Higher | More variable |
| Earnings leverage to gold price | Moderate (1.8x to 2.5x) | High (3x to 5x potential) |
| Liquidity and tradability | High | Moderate |
| Typical TTM P/E range | 15x to 25x | 10x to 20x with higher growth |
| Discovery and development upside | Limited | Significant |
| Capital deployment efficiency | Constrained by size | Highly efficient |
The current gold price environment disproportionately benefits producers across the cost spectrum, but the margin expansion effect is most powerful for producers whose costs were previously closer to gold prices. A mid-tier producer with AISC of $1,600 per ounce sees its per-ounce margin expand from roughly $400 at $2,000 gold to over $3,000 at current prices — a more than seven-fold expansion. A super-major operating at $1,200 AISC sees a proportionally smaller relative expansion from a larger starting base.
Junior and mid-tier gold miners tracked within the GDXJ ETF represent the smaller end of the production spectrum and carry additional optionality in the form of reserve discovery and development potential. In an environment of record gold prices, the economics of developing new deposits improve dramatically, potentially unlocking value that does not appear in current earnings multiples.
Frequently Asked Questions: Gold Miners Fundamentals
What is the difference between cash costs and all-in sustaining costs (AISC) in gold mining?
Cash costs cover the direct operating expenses required to extract and process each ounce of gold, representing the minimum price threshold for operational viability. AISC, the industry standard introduced by the World Gold Council in June 2013, builds on cash costs by adding sustaining capital expenditure, exploration investment, reclamation obligations, and administrative overhead. This produces a complete picture of what it costs to maintain a mining operation at its current production rate over time, rather than simply keeping it running on a day-to-day basis.
Why do gold mining stocks sometimes underperform gold prices during bull markets?
Gold stocks carry operational risks, cost inflation exposure, geopolitical and jurisdictional risk, and management execution uncertainty that physical gold does not. They are also equity instruments subject to broader market sentiment and valuation multiple expansion or contraction. When earnings grow materially faster than stock prices over extended periods, the P/E multiple compresses even as shares rise, creating situations where stocks appear significantly undervalued relative to their earnings power despite trading near all-time highs. This is precisely the dynamic the major gold mining sector is experiencing in 2026.
How does ore grade affect gold mining profitability?
Gold mining operations are predominantly fixed-cost businesses. The primary variable determining how many ounces are produced in any given quarter is the grade, or concentration, of gold in the ore being processed. Higher-grade ore fed through a constant-throughput processing plant yields more ounces against the same fixed cost base, simultaneously increasing revenue and reducing per-ounce costs. This double benefit makes ore grade the single most important geological variable in determining quarterly profitability.
Why is Q1 typically the weakest quarter for gold production?
The majority of the planet's landmass and gold mining operations are located in the northern hemisphere. Winter weather conditions in Q1 reduce operational efficiency through multiple mechanisms: cold temperatures slow physical ore hauling, and reduced temperatures impair the chemical recovery processes used in gold extraction, particularly in heap-leach operations. This seasonal pattern has produced an average sequential Q1 production decline of approximately 8.4% over the past 15 years of global mine output data.
What are implied unit earnings and why do analysts use them?
Implied unit earnings are calculated by subtracting average AISC from the quarterly-average gold price. The result represents the per-ounce profit margin across the sector. This metric provides a cleaner, more consistent measure of sector-wide profitability than reported GAAP earnings, which are frequently distorted by non-cash charges, asset write-downs, acquisition accounting, and one-time items. Implied unit earnings allow meaningful comparison across quarters regardless of index composition changes or company-specific accounting anomalies.
How do royalty obligations affect gold mining cost metrics during bull markets?
Royalties are typically calculated as a percentage of gold revenues rather than as fixed per-ounce fees, meaning they scale proportionally with gold prices. During bull markets, this creates automatic cost inflation in reported cash costs and AISC that has no relationship to operational efficiency. At some producers, royalty payments represent 20 to 25 percent of total operating costs. Consequently, when gold prices rise sharply, royalty costs rise in lockstep, inflating reported AISC and obscuring improvements in underlying operational performance. Investors should specifically examine royalty disclosures when comparing year-over-year cost trends during periods of rising gold prices.
Disclaimer: This article is intended for informational purposes only and does not constitute financial advice. All figures cited reflect reported operational and financial data from Q1 2026 earnings releases, World Gold Council Gold Demand Trends reports, and publicly available regulatory filings. Forward-looking statements including Q2 2026 earnings projections involve assumptions and uncertainties and should not be relied upon as predictions of actual outcomes. Past performance of gold prices or mining company earnings does not guarantee future results. Readers should conduct their own research and consult a qualified financial adviser before making any investment decisions.
Want to Catch the Next Major Gold Discovery Before the Market Does?
Discovery Alert's proprietary Discovery IQ model delivers real-time alerts on significant ASX mineral discoveries, instantly translating complex geological data into actionable investment opportunities — explore the historic returns that major mineral discoveries have generated to understand the scale of what early positioning can achieve, and begin your 14-day free trial today to ensure you are positioned ahead of the broader market.