August 12, 2026
The Second Half of a Precious Metals Bull Market Plays by Different Rules
Most investors understand that gold rises during periods of monetary stress, geopolitical uncertainty, and currency debasement. Fewer understand that the internal dynamics of a precious metals bull market shift dramatically as the cycle matures. The assets that lead in the early phase are rarely the ones that deliver the most explosive returns later. Recognising this rotation before it becomes consensus is one of the most powerful edges available to investors positioned in the sector.
Bullion tends to lead in the opening phase of a cycle, attracting sovereign buyers, central banks, and risk-averse capital seeking monetary shelter. Understanding gold's effect on mining equities is essential here, as equities often lag during this period due to cost inflation, capital expenditure pressures, and investor scepticism about operational execution. However, as the cycle matures and input costs stabilise, the operating leverage embedded in a gold miner's business model begins to express itself in increasingly dramatic ways.
This structural rotation from bullion leadership to equity outperformance is not a theory. It is a pattern that has repeated across multiple long-duration precious metals bull markets, and the evidence is accumulating that we are now entering precisely this inflection point. Furthermore, understanding gold-stock secular cycles helps investors anticipate these transitions before they become broadly recognised.
When big ASX news breaks, our subscribers know first
What Operating Leverage Actually Means in Practice
The concept of operating leverage is central to understanding why gold miners set to outperform represents a credible thesis rather than wishful thinking. At its core, operating leverage describes a situation where a fixed or slowly rising cost base allows profits to grow at a multiple of revenue growth.
For gold miners, the critical metric is All-In Sustaining Cost, or AISC, which captures the full cost of maintaining current production levels including labour, energy, royalties, sustaining capital, and administrative overhead. When gold prices rise but AISC remains relatively anchored, the entire price increment flows almost directly to the bottom line.
The mathematics are stark and worth examining carefully:
| Gold Price Scenario | Typical AISC (USD/oz) | Estimated Margin/oz | Margin Expansion vs. Base |
|---|---|---|---|
| $2,500/oz (base) | ~$1,350 | ~$1,150 | — |
| $3,000/oz | ~$1,380 | ~$1,620 | +41% |
| $3,500/oz | ~$1,400 | ~$2,100 | +83% |
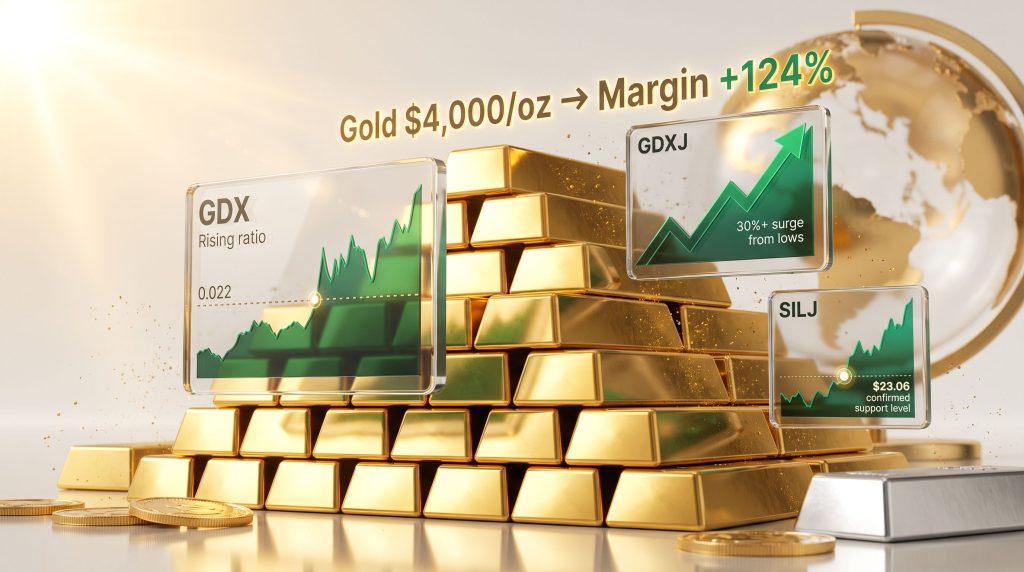
| $4,000/oz+ | ~$1,420 | ~$2,580 | +124% |
Illustrative figures based on industry-average AISC estimates. Individual producer results vary significantly.
What this table illustrates is that a 60% increase in the gold price from a $2,500 base to $4,000 per ounce can translate into a margin expansion exceeding 120% for a producer with a stable AISC. This is why equity markets, in theory, should price gold miners at significant premiums during advancing bull markets. That they frequently fail to do so until late in the cycle is precisely what creates the opportunity.
Energy Costs: The Swing Factor Investors Often Underestimate
Diesel and electricity typically account for 15% to 25% of a gold miner's total operating costs depending on the operation's location, depth, and processing method. When energy prices spike, they compress margins and undermine the operating leverage story. The inverse is equally true: when oil prices stabilise or decline, miners benefit disproportionately.
The current environment in 2025 and into 2026 has seen energy cost pressures ease relative to the peak inflationary period of 2022 and 2023. This stabilisation, combined with significantly higher gold prices, is amplifying the operating leverage effect at exactly the point in the cycle when equity markets are beginning to reward it. For a deeper look at how this plays out across different types of gold mining stocks, the distinctions between senior producers, juniors, and royalty companies are worth understanding.
July 2026 as a Cycle Inflection Point
Technical analysis of long-duration precious metals cycles reveals a consistent seasonal pattern: mid-year periods frequently coincide with demand troughs as physical buying from key consuming regions slows before the autumn and winter festival and gifting seasons reactivate. This cyclical demand vacuum can amplify price weakness during corrective phases, creating conditions that feel more structurally damaging than they actually are.
Analysts tracking the current cycle have pointed to July 2026 as a technically significant bottom across gold, silver, platinum, and mining equity indexes simultaneously. This kind of synchronised low across the precious metals complex is notable because it suggests a shared macro driver rather than idiosyncratic weakness in any individual market.
The historical parallel most frequently referenced is the 2006 mid-cycle correction in gold:
In 2006, gold underwent a sharp correction that prompted widespread predictions of a trend reversal. That correction ultimately formed a durable floor, and prices subsequently advanced for several more years, delivering returns that dwarfed the pre-correction rally. Analysts who held through the drawdown captured the bulk of the cycle's total return.
The structural similarities between 2006 and 2026 include price behaviour during the corrective phase, sentiment positioning at the low, and the relative performance of mining equities versus the underlying metal. These parallels do not guarantee an identical outcome, but they provide a coherent framework for interpreting current market dynamics. In addition, Schroders' analysis of the quiet boom in gold equities offers further institutional perspective on this structural shift.
Three Technical Signals Analysts Watch to Confirm a Cycle Bottom
- Synchronised lows across multiple metals — when gold, silver, and platinum form bottoms within weeks of each other, it reduces the probability of further structural deterioration.
- Mining equity indexes breaking above their cycle downtrend lines — this signals that institutional capital is rotating back into the sector ahead of the broader market recognising the shift.
- The GDX-to-gold ratio turning higher from a historically depressed level — this ratio is the most direct measure of whether miners are beginning to outperform the metal itself.
Reading the Mining Indexes: What the Data Is Showing
The GDX, which tracks senior gold producers, is the most widely followed benchmark for the sector. Its performance relative to bullion is expressed through the GDX-to-gold ratio, which measures how efficiently the equity market is pricing the leverage that miners offer to rising metal prices.
A rising GDX-to-gold ratio is the signature of the second half of a precious metals bull cycle. Analysts watching this ratio have identified a key breakout threshold above 0.022 as the level that would confirm a sustained leadership shift from bullion to miners.
| Index | Recent Confirmed Low | Key Resistance Level | Analyst Outlook |
|---|---|---|---|
| GDX (Senior Miners) | Mid-2026 | GDX:Gold ratio > 0.022 | Bullish — leadership shift expected |
| GDXJ (Junior Miners) | Mid-2026 | Prior all-time high | Bullish — 30%+ surge from lows |
| SILJ (Silver Juniors) | $23.06 confirmed | Prior cycle highs | Bullish — downtrend line broken |
Junior miners, tracked through the GDXJ, have historically delivered the highest leverage to gold price moves in a bull market. This is partly geological and partly financial: smaller producers operate with thinner capital buffers, meaning that cash flow improvements from higher metal prices have an outsized impact on equity valuations.
The GDXJ surged more than 30% off its mid-year low, a move that exceeded many near-term expectations, and which has left the index technically overbought in the short term. Some consolidation near current levels would not be unusual before the next leg higher.
Silver junior miners, tracked through SILJ, confirmed a bottom at $23.06 and subsequently broke decisively above the cycle downtrend line that had capped prices for an extended period. This breakout is technically significant: once a multi-month downtrend line is breached convincingly, prior resistance levels frequently become support, establishing a higher floor for the next advance.
The Long-Term Price Outlook: Where This Cycle Could End
The following price projections represent the views of independent technical analysts and should not be construed as financial advice. Precious metals markets are inherently volatile, and all long-term forecasts carry substantial uncertainty.
Technical analysis applied to the current precious metals cycle suggests that the 2026 correction represents approximately the halfway point of a decade-long bull market. If this structural assessment is correct, the implications for medium and long-term price targets are substantial.
- Gold is projected by some analysts to trade above $7,000 per ounce in the second half of 2027, with targets above $10,000 by the end of the decade representing the terminal phase of the bull cycle.
- Silver is expected to reach new all-time highs alongside gold in 2027, with the most explosive gains reserved for the final phase of the bull market around 2030 to 2031.
- Platinum is considered by cycle analysts to be one of the more compelling structural re-rating stories, with the expectation that it returns to parity with gold during the terminal bull phase.
The logic behind these targets rests on a well-documented feature of precious metals bull cycles: the terminal phase, typically the final 12 months of the cycle, accounts for a disproportionately large share of total cumulative returns. Investors who are not already positioned in mining equities when this phase begins frequently find it psychologically difficult to buy into rapidly rising markets.
The Valuation Gap: Why Mining Stocks Have Not Fully Priced In Higher Gold
One of the more counterintuitive features of the current environment is that gold mining equities continue to trade at discounts to their net asset values relative to historical norms, even after significant recent outperformance. The existence of undervalued mining stocks in this environment is the product of several compounding factors:
- Persistent underinvestment in the sector from institutional allocators who rotated away from mining equities during the long bear market of 2012 to 2018.
- Environmental, Social, and Governance (ESG) screening that has excluded many traditional mining equities from large institutional mandates.
- A broad perception of operational risk that has been reinforced by years of cost overruns, project delays, and earnings disappointments.
The irony is that these same headwinds have contributed to a decade of capital underinvestment in new mine development, which is now creating structural supply constraints that support higher long-term gold prices. Key valuation metrics worth monitoring include price-to-net asset value ratios for senior producers and enterprise value to EBITDA multiples across the sector. Both currently sit below historical cycle peaks, suggesting the re-rating process has meaningful runway ahead.
The next major ASX story will hit our subscribers first
Understanding the Risk Framework Before Committing Capital
Intellectual honesty requires acknowledging that the bull case for gold miners set to outperform is not without meaningful risks. A number of factors could disrupt or delay the expected outperformance:
| Risk Factor | Potential Impact | Mitigation Signal to Watch |
|---|---|---|
| Rising energy costs | Compresses AISC margins | Oil price trajectory; hedging disclosures |
| Gold price consolidation | Reduces operating leverage benefit | Bullion price holding above key support |
| Geopolitical disruption | Supply chain and input cost pressure | Freight and commodity input indexes |
| Currency appreciation (local) | Reduces USD-equivalent revenue | FX rate movements vs. USD |
| Operational underperformance | Earnings miss vs. consensus | Quarterly production reports |
Currency risk deserves particular attention from investors outside the United States. Non-USD producers, which include a large proportion of Australian, Canadian, and South African miners, generate revenue in US dollars but incur costs in local currencies. When local currencies strengthen against the dollar, the effective gold price received by these producers declines even if the USD gold price remains stable. Consulting the gold-silver ratio analysis for 2025 can also provide valuable context for assessing relative value across the metals complex.
Portfolio Construction: Building Exposure Across the Risk Spectrum
A structured approach to precious metals equity exposure benefits from thinking in tiers:
- Tier 1 — Bullion: Physical gold or gold-backed ETFs provide monetary hedge exposure without operational risk. Suitable as a capital preservation anchor.
- Tier 2 — Senior Producers: Large-cap gold miners tracked through GDX offer dividend income, lower volatility relative to smaller peers, and meaningful operating leverage to gold prices.
- Tier 3 — Junior Miners and Explorers: Tracked through GDXJ and SILJ, this tier offers the highest beta to gold and silver price moves but carries commensurately higher operational, geological, and financial risk.
- Tier 4 — Royalty and Streaming Companies: These entities finance mine development in exchange for the right to purchase future production at fixed prices, representing an often-overlooked middle ground in portfolio construction.
A tiered allocation across these categories allows investors to calibrate the balance between capital preservation and asymmetric upside capture according to their individual risk profiles and conviction levels.
Frequently Asked Questions: Gold Miners Set to Outperform
Why do gold miners outperform gold bullion during certain market phases?
Mining equities carry fixed and semi-fixed cost structures. When gold prices rise faster than production costs, profit margins expand at a multiple of the metal price increase. This operating leverage means that a 20% rise in gold can translate to a 50% or greater increase in miner earnings, driving equity revaluation.
What is the GDX-to-gold ratio and why does it matter?
The GDX-to-gold ratio divides the price of the senior miners ETF by the spot price of gold. A rising ratio indicates that mining equities are outperforming the metal itself, which has historically preceded accelerated gains across the broader precious metals equity sector. Furthermore, gold miners can outperform gold precisely because this ratio begins to inflect before broader market recognition occurs.
How do junior gold miners differ from senior producers?
Junior miners typically operate single assets or exploration-stage projects with limited production histories. They offer higher leverage to gold price moves but carry greater risks related to capital access, geological uncertainty, and operational execution. Senior producers, however, have diversified asset bases, established cash flows, and more predictable cost structures.
What macroeconomic conditions are most favourable for gold mining equities?
Rising or elevated gold prices combined with stable or declining input costs create the ideal operating environment for miners. Additional tailwinds include a weakening US dollar, negative real interest rates, elevated sovereign debt levels, and geopolitical uncertainty driving safe-haven demand.
How can retail investors access gold mining equity exposure?
Index ETFs including GDX for senior miners, GDXJ for junior miners, and SILJ for silver junior miners provide broad sector exposure without the single-stock risk associated with individual company selection. These instruments are liquid, transparent, and widely available through standard brokerage accounts.
Key Takeaways for Investors Monitoring the Cycle
The convergence of several independently bullish factors creates a structurally compelling case for gold miners set to outperform over the medium term:
- The mid-2026 correction appears to have formed a synchronised bottom across gold, silver, platinum, and mining equity indexes.
- Operating leverage is being amplified by stabilising input costs against a backdrop of historically elevated gold prices.
- Mining equity valuations remain below historical cycle norms relative to bullion, suggesting the re-rating process has significant remaining runway.
- Technical breakouts in SILJ and GDXJ, combined with an anticipated GDX-to-gold ratio inflection above 0.022, point toward a sustained leadership transition from bullion to equities.
- The terminal phase of the current bull cycle, expected around 2030 to 2031, has the potential to deliver disproportionate returns relative to the years preceding it.
Investors should remain attentive to the risk factors outlined above, monitor quarterly production and cost reports closely, and treat any near-term consolidation in mining indexes as consistent with the broader bull case rather than contradictory to it. Position sizing and diversification across the risk spectrum remain essential disciplines in a sector that rewards conviction but punishes overconcentration.
This article is intended for informational and educational purposes only and does not constitute financial advice. All price forecasts and cycle projections represent the analytical views of independent market commentators and should not be relied upon as the basis for investment decisions. Precious metals markets are volatile, and past cycle behaviour does not guarantee future outcomes. Readers are encouraged to consult a qualified financial adviser before making investment decisions.
Want to Identify the Next Major Mineral Discovery Before the Market Does?
Discovery Alert's proprietary Discovery IQ model delivers real-time alerts on significant ASX mineral discoveries, instantly translating complex geological data into actionable investment insights — giving subscribers a decisive edge during precisely the kind of precious metals bull cycle described above. Explore Discovery Alert's dedicated discoveries page to understand how historic mineral discoveries have generated substantial market returns, and begin your 14-day free trial today to position yourself ahead of the broader market.