
August 12, 2026
The Hidden Cost Multiplier Reshaping Mining Profitability
Few forces reshape mining economics as quietly yet decisively as energy price inflation. Unlike commodity price swings that draw immediate market attention, fuel cost escalation operates as a slow-moving margin compressor, eroding profitability well before it appears in quarterly earnings reports. Hormuz disruptions and diesel costs for mining operations represent precisely this kind of structural threat — one that requires moving beyond headline crude prices and examining the mechanics of refined-product markets, particularly diesel, which sits at the centre of virtually every tonne of ore moved anywhere in the world.
The current environment presents a case study in how a single geographic chokepoint can fundamentally alter the cost calculus for mining operations across multiple continents simultaneously. Furthermore, understanding crude oil price trends helps contextualise why diesel remains so persistently elevated even when broader crude inventories suggest relief should be forthcoming.
When big ASX news breaks, our subscribers know first
The Strait of Hormuz: A Refined-Product Bottleneck, Not Just an Oil Corridor
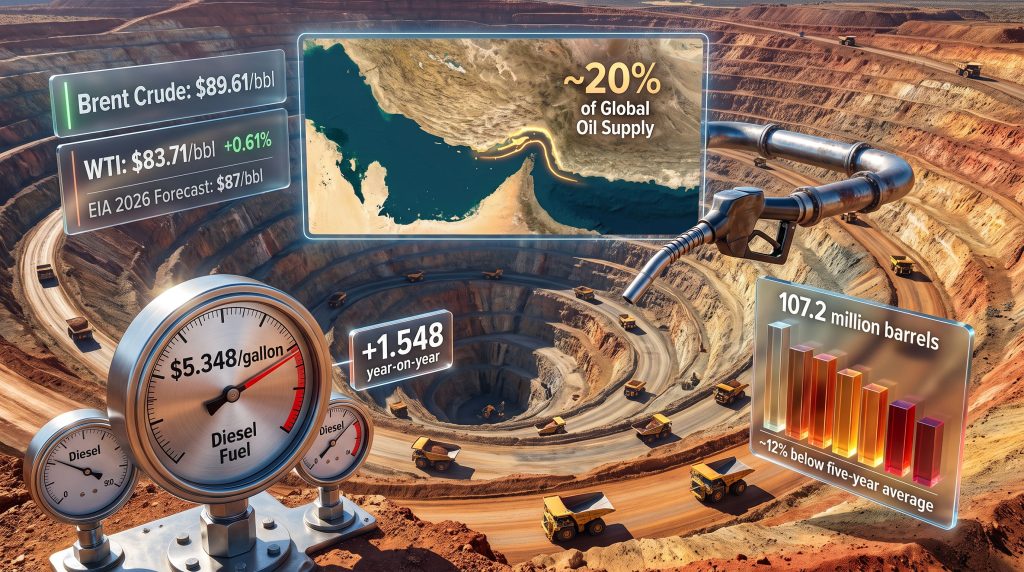
How One Waterway Controls a Fifth of Global Oil Supply
The Strait of Hormuz, at its narrowest point spanning roughly 33 kilometres of navigable water, functions as the arterial passage for approximately one-fifth of global oil supplies under normal conditions. The waterway connects the Persian Gulf production heartlands of Saudi Arabia, Iraq, Kuwait, the UAE, and Iran to export terminals feeding Asian, European, and North American refineries.
What makes the Strait structurally irreplaceable is the absence of adequate pipeline alternatives at scale. While Saudi Arabia's East-West Pipeline and the UAE's Abu Dhabi Crude Oil Pipeline provide partial bypass capacity, neither can absorb anywhere close to the full volume that transits the Strait under normal operating conditions.
When shipping attacks disrupt transit, the effective supply loss is not merely the volume of disrupted tankers. Rather, it is the systemic uncertainty premium that causes insurers, operators, and charterers to reprice all Hormuz-adjacent risk upward simultaneously. Consequently, oil market disruptions of this nature reverberate far beyond the Persian Gulf itself.
Why Diesel Bears the Heaviest Refinery Output Burden
Diesel's unique vulnerability to Hormuz disruptions stems from a structural characteristic of refinery economics that most market participants overlook. Unlike gasoline, diesel cannot be selectively ramped up within a refinery's output slate without corresponding changes to crude input volume and refinery configuration. The ratio between diesel, gasoline, jet fuel, and other products is largely determined by crude oil type and refinery design — not by a simple dial refiners can turn in response to price signals.
This inflexibility means that when global crude throughput falls due to supply disruptions, diesel production falls proportionally or even disproportionately. Many Middle Eastern crude grades are particularly well-suited to middle-distillate production, which compounds the problem. The consequence is a diesel market that tightens faster and more severely than gasoline markets when Hormuz is constrained.
"Diesel markets have structurally less supply-side flexibility than gasoline markets. When global refinery throughput contracts, middle-distillate output contracts at least as fast, and demand from transport, logistics, agriculture, and mining continues largely uninterrupted, creating the conditions for outsized price spikes."
The Transmission Mechanism: From Tanker Attacks to Mine Fuel Bills
According to analysis of the Hormuz diesel shock, the pathway from a shipping incident in the Persian Gulf to a higher diesel bill at a remote mine site in Western Australia or Nevada operates through three sequential layers:
- Crude oil availability contracts as tanker operators re-route, delay, or suspend Persian Gulf loadings following confirmed or threatened attacks
- Refinery crude inputs decline globally, particularly at Asian refineries most dependent on Middle Eastern crude grades, reducing total refined-product output
- Distillate inventories fall as supply drops while transport, agricultural, and mining demand remains inelastic in the short term, pushing spot and forward diesel prices higher
- Diesel price increases transmit directly into mine operating budgets through fuel supply contracts, spot purchasing, and logistics surcharges that reference diesel benchmarks
What Current Data Reveals About a Structurally Stressed Diesel Market
Brent at $89.61: What the Price Signal Actually Means
Brent crude futures for October delivery were trading at $89.61 per barrel as of August 2026, representing approximately 24% above pre-conflict price levels before hostilities began in late February. WTI crude added 0.61% to reach $83.71 per barrel, with Brent posting its sixth consecutive daily advance.
Critically, this price elevation is occurring despite a US commercial crude inventory build of 2.5 million barrels to 407.0 million barrels, with domestic production running at 13,804 thousand barrels per day. Under normal market logic, a crude inventory build of this magnitude should suppress prices. The fact that Brent continued climbing signals that markets are pricing geopolitical risk to supply continuity, not just current physical balance.
| Metric | Current Figure | Context |
|---|---|---|
| Brent Crude (Oct. Delivery) | $89.61/barrel | ~24% above pre-conflict levels |
| WTI Crude | $83.71/barrel | +0.61% on the day |
| US Commercial Crude Inventories | 407.0 million barrels | +2.5 million barrels week-on-week |
| US Distillate Inventories | 107.2 million barrels | ~12% below five-year average |
| Propane/Propylene Stocks | Significantly elevated | ~32% above five-year average |
| National Average On-Highway Diesel | $5.348/gallon | +$1.548 year-on-year |
| EIA 2026 Brent Forecast | $87/barrel | Revised up $5 due to Hormuz constraints |
The Crude-Diesel Divergence: Why the Inventory Build Provides No Relief
The most revealing data point in current petroleum market statistics is not the crude inventory build, but what is happening simultaneously in distillate markets. While crude inventories rose, distillate fuel inventories fell 3.5 million barrels to 107.2 million barrels, leaving them approximately 12% below the five-year seasonal average.
This divergence exposes the structural problem precisely. Crude is accumulating because the Hormuz disruption has disrupted both export flows and the confidence to move cargoes, yet refinery utilisation has simultaneously reached 96.5% of operable capacity — the highest crude input level since 2019. Refiners are processing near maximum throughput, yet diesel inventories continue declining.
The propane and propylene inventory picture reinforces this interpretation. Propane stocks running 32% above the five-year average while diesel runs 12% below reveals that refinery output is biased toward lighter products, with middle-distillate production failing to keep pace with demand regardless of crude input levels.
"When a refinery is running at 96.5% utilisation and diesel inventories are still falling, the market has effectively lost its primary safety valve. There is no meaningful spare capacity to redirect toward diesel production in response to price incentives."
Three Simultaneous Supply Shocks Compressing Global Diesel Availability
Why This Is Not a Single-Source Problem
Market participants who frame the current diesel tightness as solely a Hormuz problem are underestimating the scope of the supply challenge. Three distinct supply shocks are operating concurrently, each removing a different segment of global diesel availability:
- Russian export reductions have progressively removed one of Europe's historically significant diesel supply sources, forcing European buyers to source from further afield at higher freight costs
- Conflict-related operational restrictions on Saudi Arabian and Kuwaiti refinery throughput have reduced Middle Eastern refined-product export capacity independently of the tanker transit issue
- Chinese refinery processing cuts have reduced Asia-Pacific refined-product availability, tightening the regional market that previously served as a balancing mechanism for global distillate flows
The compounding effect of three simultaneous supply contractions explains why distillate inventories remain depressed even as crude builds. Each shock would be manageable in isolation; however, their concurrence is what is creating the structural tightness reflected in current prices.
OPEC's Conditional Position and the EIA's Extended Recovery Timeline
The US Energy Information Administration has revised its 2026 Brent forecast upward by $5 to $87 per barrel, specifically attributing the revision to Hormuz shipping constraints. More significantly, the EIA projects that Middle East production will remain below pre-conflict levels until at least early 2027, establishing a multi-quarter baseline of elevated fuel costs for mining operators planning ahead.
Senior oil market analyst June Goh of Sparta Commodities has noted that OPEC production increases remain conditional on the normalisation of two-way oil flows through the Strait of Hormuz. This means that diplomatic progress alone cannot unlock supply relief without verified shipping normalisation — a ceasefire announcement not accompanied by confirmed safe passage for tankers would provide limited practical relief to diesel markets.
Mining's Diesel Dependency: Understanding the True Exposure
Breaking Down the Energy Consumption Profile
Diesel's dominance within mining energy consumption is not widely appreciated outside the sector. The numbers reveal a degree of concentration that makes mining operations uniquely vulnerable to refined-product price shocks compared to most other industrial sectors.
| Energy Source | Share of Total US Mining Energy Use | Share of Materials Handling/Haulage |
|---|---|---|
| Diesel | ~34% | ~87% |
| Electricity | ~32% | Minimal for haulage |
| Natural Gas | ~22% | Minimal for haulage |
| Other Sources | ~12% | Remainder |
The critical insight embedded in these figures is the distinction between total energy use and haulage-specific energy use. While diesel accounts for approximately one-third of total mining energy consumption, it accounts for 87% of all energy used in loading and haulage operations. Since haulage is both the largest operational cost category and the most volume-sensitive, diesel price changes transmit into mine economics with an amplification effect that the aggregate energy share figure alone does not capture.
Open-Pit Operations: Maximum Diesel Exposure at Scale
Open-pit mining operations represented approximately 90% of US mines in 2024, meaning that the vast majority of production capacity carries maximum diesel exposure. The economics of open-pit mining are built around large-scale haulage fleets — typically 100-tonne-plus haul trucks running 24-hour shift cycles and consuming diesel at rates that translate directly into per-tonne operating costs.
The scale sensitivity of this exposure is illustrated by the benchmark established by large mining operations: a 10-cent movement in diesel price per gallon can translate into annual cost impacts exceeding $70 million for a large-scale open-pit producer. In addition, S&P Global has estimated that Hormuz-driven oil price increases could add approximately $1.54 per dry metric tonne to global mine costs through diesel expenses alone.
Comparing Diesel Risk Across Operation Types
| Operation Type | Diesel Intensity | Hormuz Exposure Level | Key Cost Driver |
|---|---|---|---|
| Large open-pit (remote) | Very High | Critical | Haulage fleet + power generation |
| Large open-pit (grid-connected) | High | High | Haulage fleet primary |
| Underground (mechanised) | Moderate | Moderate | Ventilation + equipment |
| Underground (manual/hybrid) | Low-Moderate | Lower | Equipment only |
| Processing-only facilities | Low | Low | Minimal direct diesel use |
Remote open-pit operations face what can be described as a triple diesel burden: haulage fleet consumption, on-site diesel power generation where grid connectivity is unavailable, and diesel-referenced freight surcharges on consumables and equipment delivered to site. Each layer compounds the base fuel price increase, meaning that the effective diesel cost impact at a remote open-pit mine can substantially exceed the headline pump price movement.
Can Precious Metals Revenues Absorb the Cost Shock?
With spot gold at $4,400.44 per ounce and silver at $65.30 per ounce, precious metals producers operating open-pit mines occupy a more defensible position than base metals producers facing flat or declining commodity prices. For a broader view of how these price movements affect sector performance, examining commodity price impacts across different mine types provides essential context.
"The critical variable for precious metals producers is not simply whether gold prices are high, but whether the per-tonne revenue improvement from elevated metal prices is outpacing the per-tonne cost escalation driven by diesel inflation. Operations where the commodity price tailwind exceeds the fuel cost headwind on a per-tonne basis retain margin integrity even in the current environment."
Base metals producers lacking equivalent commodity price support face a more challenging calculus. For copper, iron ore, or coal producers selling into markets not experiencing equivalent price inflation, the $1.54 per dry metric tonne diesel cost addition directly compresses already-thin margins.
Scenario Modelling: How Far Could Diesel Costs Move?
Scenario 1: Prolonged Hormuz Disruption (Brent $85–$90, No Diplomatic Progress)
Under a sustained disruption scenario with Brent remaining between $85 and $90 per barrel and no material progress toward Hormuz normalisation:
- National average on-highway diesel remains above $5.00 per gallon
- Haulage-heavy open-pit operations experience sustained margin compression with no near-term relief
- Low-diesel-intensity mines and operations with active fuel hedging programmes gain measurable competitive advantage
- Precious metals producers benefit from elevated spot prices providing partial cost offset
Scenario 2: Partial Diplomatic Resolution (Brent Falls Below $85)
A partial resolution scenario — perhaps including a ceasefire but without fully normalised shipping — would produce more moderate relief:
- Distillate inventories begin a gradual recovery trajectory toward five-year averages
- Gulf Coast ultra-low sulphur diesel retreats toward and potentially below $4.134 per gallon, the key reassessment threshold
- High-diesel-exposure open-pit operations become candidates for upward earnings estimate revisions
- The competitive advantage of low-diesel mines narrows but does not fully close
Scenario 3: Full Normalisation and OPEC Supply Restoration
Complete Hormuz normalisation paired with OPEC executing previously announced production increases would represent the most bullish scenario for mining cost structures:
- Diesel prices revert toward pre-conflict baselines over a 6–12 month period
- Fuel hedging premiums compress, reducing the cost advantage of hedged operators
- Haulage-cost advantages of low-diesel mines narrow significantly as the sector-wide cost differential closes
- Capital allocation toward mine energy transition programmes may face reduced urgency, though structural arguments for electrification remain independent of short-term fuel prices
The next major ASX story will hit our subscribers first
A Practical Framework for Measuring and Managing Diesel Exposure
Step-by-Step: Assessing Your Operation's True Diesel Risk Profile
Operators and investors seeking to quantify actual diesel exposure rather than relying on sector-average figures should follow a structured assessment process:
- Quantify diesel's share of total site energy consumption using operational energy audits and publicly available sustainability disclosures, comparing against the 34% sector average as a baseline
- Map haulage distances and fleet composition to identify the largest diesel consumption nodes within the operation, since haul distance has a squared relationship with fuel consumption at scale
- Calculate cost-per-tonne sensitivity to $0.10, $0.50, and $1.00 per gallon diesel movements, establishing a clear internal benchmark for earnings sensitivity
- Benchmark against sector peers using publicly available sustainability reports and EIA data to identify whether the operation sits above or below sector-average diesel intensity
- Evaluate hedging coverage relative to current forward diesel prices, assessing how much of the current price spike is absorbed by existing contracts versus flowing through to spot
- Identify electrification or alternative fuel pathways that could reduce structural diesel dependency over a 3–5 year horizon, independent of current price conditions
Using Sustainability Disclosures as a Diesel Screening Tool
One underappreciated analytical tool for comparing diesel exposure across mining companies is the sustainability disclosure, particularly Scope 1 emissions data disaggregated by energy source. Companies reporting higher diesel combustion intensity per tonne of ore processed carry proportionally higher exposure to Hormuz-driven cost inflation. This data, once extracted and normalised, provides a more precise exposure ranking than mine type alone.
Furthermore, mining electrification programmes increasingly feature in sustainability disclosures, making it possible to assess which operators are actively reducing their structural diesel dependency over the medium term.
The Case for Fuel Hedging in a Structurally Tight Market
In structurally tight diesel markets with a defined but uncertain recovery timeline, forward hedging programmes offer asymmetric value. The cost of locking in current forward prices is bounded by the hedge premium. However, the downside of remaining fully exposed to spot pricing in a scenario where Hormuz remains disrupted through 2027 could be substantial. Operators without hedging programmes face full exposure to the EIA's elevated $87 per barrel Brent forecast baseline. For a broader view of energy security considerations, forward planning around fuel supply has never been more consequential.
Weekly Metrics That Signal Diesel Market Direction
The EIA Weekly Petroleum Status Report as a Leading Indicator
For mining cost planners and resource sector investors, the EIA's Weekly Petroleum Status Report functions as the most actionable early warning system available. The specific metrics worth monitoring weekly include:
- Distillate fuel oil inventories: Two consecutive builds that narrow the current 12% deficit from 107.2 million barrels toward the five-year average represent a measurable demand-supply rebalancing signal
- Refinery utilisation rates: Any decline from the current 96.5% ceiling would signal either demand destruction or supply normalisation beginning to relieve output pressure
- Gulf Coast ultra-low sulphur diesel spot price: A sustained move below $4.134 per gallon serves as the clearest quantitative threshold for reassessing operating economics at high-diesel-exposure mines
- Brent crude front-month futures: $85 per barrel represents the structural boundary below which diesel cost relief begins to materialise in refinery economics
- Hormuz shipping incident frequency and severity: As the leading indicator of supply risk duration, shipping intelligence data provides early warning ahead of crude and distillate price movements
"The two-build rule provides a disciplined, data-driven framework for reassessing fuel-intensive mining operations. Rather than reacting to diplomatic headlines, waiting for two consecutive distillate inventory builds that narrow the 12% deficit — combined with Gulf Coast diesel falling below $4.134 per gallon — anchors reassessment decisions in measurable supply-demand data rather than geopolitical speculation."
FAQ: Hormuz Disruptions and Diesel Costs for Mining Operations
Why do Hormuz disruptions affect diesel prices more severely than gasoline prices?
Diesel markets have structurally less supply flexibility than gasoline markets. Because diesel is produced in a largely fixed ratio relative to other refinery outputs, and because refinery utilisation is already at 96.5%, there is no practical mechanism to increase diesel output independently. Meanwhile, diesel demand from transport, mining, agriculture, and logistics is highly inelastic in the short term, creating the conditions for outsized price responses to supply shocks.
How much can diesel disruptions add to a mine's operating costs at scale?
Industry analysis suggests that Hormuz-driven oil price increases could raise global mine costs by approximately $1.54 per dry metric tonne through diesel expenses alone. For large open-pit operations, a 10-cent per gallon movement in diesel price can translate into annual cost impacts exceeding $70 million, making fuel cost management one of the highest-leverage operational variables available to mine management teams. Detailed analysis of fuel cost impacts confirms that even partial Hormuz recovery keeps diesel costs structurally elevated.
Which mining operations carry the lowest exposure to Hormuz-driven diesel inflation?
Operations with shorter haulage distances, access to grid-connected electricity for power generation, active fuel hedging programmes covering a significant share of forward consumption, or meaningful progress toward haul truck electrification carry the lowest structural diesel exposure. Underground mines with lower equipment intensity also face considerably less direct diesel cost pressure than large open-pit operations conducting round-the-clock haulage.
What price level signals meaningful diesel cost relief for mining operators?
A sustained Brent crude price below $85 per barrel, combined with two consecutive weekly distillate inventory builds and Gulf Coast ultra-low sulphur diesel falling below $4.134 per gallon, would represent a measurable threshold for reassessing fuel cost assumptions at high-diesel-exposure operations.
When is Middle East oil production expected to return to pre-conflict levels?
The EIA projects that Middle East production will remain below pre-conflict levels until at least early 2027, with any recovery contingent on the normalisation of Strait of Hormuz shipping lanes. This timeline establishes a multi-quarter baseline of structurally elevated diesel costs for operations without hedging protection.
Key Takeaways for Mining Cost Planners and Resource Investors
Hormuz disruptions and diesel costs for mining operations represent one of the most consequential cost-side stories in the resource sector today. The essential points to carry forward:
- Diesel accounts for approximately 34% of total US mining energy use and 87% of materials-handling energy, making it the single most operationally critical fuel input across the sector
- US distillate inventories sit 12% below their five-year average at 107.2 million barrels, with refinery utilisation at 96.5% leaving virtually no production buffer
- Brent at $89.61 per barrel, approximately 24% above pre-conflict levels, is transmitting directly into national average on-highway diesel now at $5.348 per gallon — a year-on-year increase of $1.548
- Three simultaneous supply shocks — Russian export reductions, Middle Eastern refinery restrictions, and Chinese processing cuts — are compounding the Hormuz effect on global diesel availability
- Middle East production recovery is not expected until early 2027, sustaining elevated diesel costs well beyond the current quarter
- Open-pit precious metals producers at current spot prices of $4,400.44 per ounce for gold and $65.30 per ounce for silver are better positioned to absorb diesel inflation than base metals producers selling into flat commodity markets
- The two-build rule — two consecutive distillate inventory builds narrowing the 12% deficit combined with Gulf Coast diesel below $4.134 per gallon — provides a clear, data-driven trigger for reassessing high-diesel-exposure operations
- Mines with shorter haulage distances, fuel hedging coverage, or electrification programmes in progress hold a structural cost advantage likely to persist through at least the first half of 2027
The U.S. Energy Information Administration's Weekly Petroleum Status Report is the primary source for distillate inventory, refinery utilisation, and diesel price data referenced throughout this analysis. Readers seeking to track the metrics outlined in this article can access the report directly through the EIA's public data portal.
Want to Stay Ahead of the Next Major Mineral Discovery Amid Rising Mining Costs?
While diesel inflation and geopolitical disruptions continue to compress margins across the sector, the most significant returns in resource investing have historically come from identifying transformative mineral discoveries at the moment of announcement — precisely what Discovery Alert's proprietary Discovery IQ model is built to deliver, scanning ASX announcements in real time and converting complex geological data into actionable opportunities. Explore how historic discoveries have generated exceptional market returns and begin a 14-day free trial to position ahead of the broader market.