August 1, 2026
The Hidden Wealth Cycle Rewriting the Rules of Gold Equity Investing
Most investors who track commodities fixate on the spot price of gold as the primary signal of sector health. This is an understandable reflex, but it increasingly misses the more important story unfolding beneath the surface. The real transformation happening in the gold mining industry is not about where gold prices are trading today. It is about what happens when a capital-intensive, historically undisciplined industry spends a decade fixing its foundations, and then gets handed the widest operating margins in its modern history.
That is precisely the situation facing the gold mining sector in 2025 and 2026. Gold miners generating record free cash flow are doing so not because of a speculative spike, but because the structural mechanics of the business have fundamentally changed. Understanding this shift requires looking beyond the headline gold price and into the operating economics that now define the sector.
When big ASX news breaks, our subscribers know first
How a Decade of Austerity Built the Foundation for Today's Cash Flow Boom
The gold mining industry's relationship with capital discipline has historically been troubled. During the bull market of 2009 to 2012, major producers responded to rising prices by pursuing large, expensive acquisitions at inflated valuations, approving high-cost development projects, and growing their workforce and cost bases at rates that outpaced revenue growth. When gold prices corrected sharply after 2012, the sector was left with bloated balance sheets, overpriced assets, and in some cases existential financial pressure.
The painful period between 2014 and 2018 served as a forced restructuring. Management teams were replaced, portfolios were rationalised, marginal operations were sold or suspended, and debt reduction became a primary objective. All-in sustaining cost (AISC) methodologies were adopted industry-wide to create greater transparency and accountability around true operating costs. The World Gold Council's introduction of the AISC reporting standard in 2013 was a pivotal moment, giving investors a far more honest picture of what it actually costs to pull an ounce from the ground.
The result of that prolonged correction is now visible in the financial results being reported across the sector. Companies that survived the lean years emerged leaner, more efficient, and far more conservative in their capital allocation philosophies.
The Free Cash Flow Numbers That Are Redefining the Sector
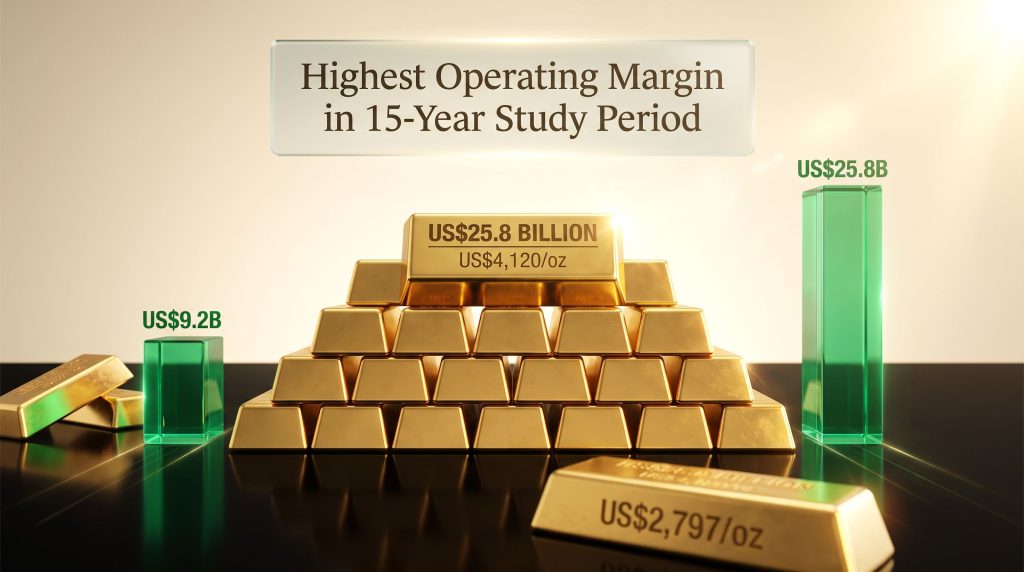
The scale of the current cash flow generation across the gold mining industry is historically without precedent. According to data from Metals Focus, the world's leading gold producers collectively generated US$25.8 billion in free cash flow in 2025, compared to US$9.2 billion in 2024. That is an increase of approximately 180% year over year, and it represents the highest operating margin recorded across the firm's 15-year study period.
| Metric | 2024 | 2025 |
|---|---|---|
| Sector-Wide Free Cash Flow | US$9.2 billion | US$25.8 billion |
| Weighted-Average Realised Gold Price (Q4) | ~US$2,600/oz (est.) | US$4,120/oz |
| Weighted-Average Cash Cost | ~US$1,200/oz (est.) | US$1,323/oz |
| Operating Margin Profile | Moderate | Highest in 15-Year Study |
The mathematics of the current environment are straightforward but staggering. With a weighted-average realised price of US$4,120 per ounce against sector cash costs averaging approximately US$1,323 per ounce, producers are retaining a spread of roughly US$2,797 per ounce produced. That margin profile is structurally different from any prior gold bull market, including the 2009 to 2012 cycle, where a surge in gold prices was largely offset by simultaneous cost inflation across labour, energy, and materials.
What makes the current cycle particularly notable is that cost structures have remained relatively anchored even as revenues have surged. This reflects the operational discipline embedded during the lean years, as well as the benefit of technology adoption, mine optimisation, and the natural operating leverage of well-managed fixed-cost operations running near full capacity. Furthermore, the relationship between gold price and mining equities has rarely been more favourable for producers than it is today.
What Is Driving Margin Expansion Beyond the Gold Price?
Several concurrent factors are amplifying the free cash flow effect beyond simple price leverage:
- Disciplined AISC management across tier-one producers has kept cost growth well below the rate of revenue growth
- Reduced debt servicing burdens following years of systematic balance sheet repair have freed up operating cash flow that was previously absorbed by interest payments
- Technology-driven efficiencies in areas including autonomous haulage, remote operations, and predictive maintenance have structurally lowered unit costs at many operations
- Mine optimisation through selective high-grading and improved metallurgical recovery rates has increased the value extracted per tonne of ore processed
- Portfolio rationalisation has concentrated production in lower-cost, higher-quality assets, lifting sector-wide averages
A Producer-by-Producer Breakdown of Record Cash Generation
The scale of cash generation is not confined to one or two outliers. It spans the sector's major producers across multiple jurisdictions, demonstrating that the FCF surge is a structural industry phenomenon rather than a company-specific achievement. Gold miners' record cash flow is also fuelling capital migration down the market cap ladder, as larger players redirect capital toward emerging opportunities.
| Producer | FCF Result | Period | Notable Capital Return |
|---|---|---|---|
| Newmont | US$7.3 billion | Full Year 2025 | Net cash position achieved |
| Barrick Gold | US$3.87 billion | Full Year 2025 | Dividends and buybacks |
| Agnico Eagle | US$1.335 billion | Q2 2026 (record quarter) | US$625 million returned to shareholders |
| AngloGold Ashanti | US$1.2 billion | Record quarter | Dividend increase declared |
| Kinross Gold | ~US$837.5 million | Q2 2026 (4th consecutive record) | ~40% of FCF returned to shareholders |
Agnico Eagle: Balancing Returns and Reinvestment at Scale
Agnico Eagle's Q2 2026 result stands out even within the context of broader sector records. Generating US$1.335 billion in free cash flow in a single quarter while simultaneously returning US$625 million to shareholders demonstrates that, at current gold prices, the largest producers can fund shareholder returns and long-life project development from operating cash flow alone, without requiring equity dilution or debt.
The company's ongoing advancement of the Odyssey, Hope Bay, and Upper Beaver projects reflects a strategic view that the current cash flow environment should be partially deployed into building the next generation of production capacity. Odyssey in particular is noteworthy from a geological perspective: it is an underground expansion beneath the existing Canadian Malartic open pit in Quebec, targeting high-grade ore zones at depth. The transition from open-pit to underground mining at this scale is technically complex, and the ability to self-fund this development from operating cash flow is a direct consequence of today's margin environment.
Kinross Gold: Four Consecutive Quarterly Records and a Growing Net Cash Position
Kinross reported approximately US$837.5 million in free cash flow for Q2 2026, its fourth consecutive quarterly record. Its net cash position expanded to US$1.9 billion, a figure that would have been almost unimaginable for the company during its heavily leveraged years following the 2010 to 2012 acquisition cycle. The decision to return roughly 40% of free cash flow directly to shareholders signals management confidence in the sustainability of current earnings levels.
The Lobo-Marte project in Chile deserves particular attention from a geological standpoint. It is positioned as a future low-cost heap leach operation targeting oxide gold mineralisation, a deposit type that typically offers lower capital intensity and faster ramp-up timelines compared to conventional milling operations. If developed as anticipated, it could meaningfully lower Kinross's long-term AISC profile.
Alamos Gold: Generating Cash Even Through Operational Disruptions
Perhaps the most instructive data point in the current cycle is Alamos Gold's Q2 2026 result. Despite reducing production guidance at its Young-Davidson operation in Ontario following seismic activity, the company still generated US$143.5 million in free cash flow during the quarter and continued funding its Island Gold District expansion entirely from internal cash flows. This illustrates the depth of the margin buffer at current gold prices: even operations running below optimal capacity are generating substantial free cash.
The Three Pillars of Capital Allocation in the Current Cycle
Strategic context: A critical distinction between the current gold bull market and prior cycles is how producers are deploying their surplus cash. Rather than chasing production growth through overpriced acquisitions or approving marginal, high-cost projects, the industry's capital allocation framework has matured considerably.
Pillar 1: Shareholder Returns
- Agnico Eagle returned US$625 million to shareholders in a single quarter
- Kinross committed approximately 40% of FCF directly to shareholder distributions
- Sector-wide dividend increases and buyback programmes are attracting income-focused institutional capital
- Special dividends are becoming more common as producers seek to distribute excess cash without increasing base dividend obligations
Pillar 2: Balance Sheet Fortification
- Multiple major producers have crossed into net cash territory, eliminating financial leverage risk
- Debt reduction lowers the cost of capital for future project financing
- Cleaner balance sheets also improve resilience against gold price corrections, providing a buffer that did not exist during the 2014 to 2016 downturn
Pillar 3: Long-Life Project Investment
- Internal funding of growth projects removes the need for dilutive equity raises
- Agnico Eagle advancing Odyssey, Hope Bay, and Upper Beaver from operating cash flow
- Kinross developing Lobo-Marte as a future low-AISC operation
- The geological quality of these pipeline assets matters: producers are prioritising long-life, high-grade deposits over short-life, low-grade alternatives that deliver near-term production at the expense of future value
In addition, gold sector M&A trends indicate that disciplined consolidation activity is becoming another avenue through which well-capitalised producers are deploying surplus cash flows strategically.
The Valuation Paradox: Record Cash Flow, Underappreciated Sector
One of the more striking anomalies in current financial markets is the gap between the cash flow metrics being reported by gold miners and the investor attention those results are receiving. In virtually any other sector, the kind of free cash flow yields now available in gold equities would attract significant capital rotation. Yet institutional and retail investor flows continue to favour technology and AI-linked equities, many of which trade at substantial premiums relative to their current earnings. The gold mining valuation paradox remains one of the most compelling anomalies in today's equity markets.
Bank of America's decision to maintain a constructive stance on gold equities even after lowering its 2026 gold price forecast is a meaningful signal. It suggests that at least some major institutional analysts are shifting their valuation framework away from gold price momentum and toward fundamental cash generation capacity. This is the same analytical evolution that transformed how energy sector investors evaluated oil majors during the 2021 to 2023 free cash flow boom, when companies like Shell, BP, and ExxonMobil generated record cash and aggressively returned capital to shareholders.
Why the AI Valuation Premium Creates a Relative Opportunity
The contrast between sector valuations is worth examining directly. Many technology and AI-linked companies trade on forward earnings multiples that price in years or decades of future growth expectations. Gold miners, by contrast, are generating current, realised free cash flow at record levels, with that cash being returned to shareholders in real time. Consequently, the quiet boom in gold equities is attracting increasing attention from value-oriented institutional investors seeking alternatives to stretched technology valuations.
Important disclaimer: The analysis above reflects current market conditions and does not constitute financial advice. Past performance of gold equities does not guarantee future returns. Valuations and free cash flow generation are subject to significant change based on gold price movements, operating cost inflation, and company-specific factors.
The next major ASX story will hit our subscribers first
Technical Analysis: How to Properly Evaluate Gold Miner Free Cash Flow
For investors unfamiliar with mining sector financial analysis, headline FCF figures can be misleading without contextual adjustment. The following framework provides a more rigorous approach:
| Metric | Why It Matters |
|---|---|
| FCF Yield (FCF divided by market cap) | Measures value relative to cash generation capacity |
| FCF Conversion Rate | FCF as a percentage of operating cash flow, testing earnings quality |
| Capital Return Ratio | Percentage of FCF returned to shareholders, signalling management confidence |
| Net Debt / EBITDA | Balance sheet health relative to earnings power |
| AISC per Ounce | The most reliable benchmark for operational cost efficiency |
| Reserve Replacement Rate | Ensures FCF is not being generated by depleting assets without replacement |
Step-by-Step: Evaluating a Gold Miner's FCF Quality
- Identify the reported FCF figure and confirm whether it is levered (after debt service) or unlevered (before financing costs)
- Adjust for sustaining capital expenditure to ensure AISC includes all costs required to maintain current production levels
- Separate growth capex from sustaining capex, since growth investment builds long-term net asset value and should not be penalised in FCF quality analysis
- Calculate FCF yield by dividing annualised FCF by the current market capitalisation, then compare against sector peers and broader equity market benchmarks
- Evaluate capital allocation history to determine whether management has a track record of value-accretive decisions or value-destructive acquisitions
- Stress-test FCF at lower gold prices by modelling cash generation at US$3,000/oz and US$3,500/oz to understand downside resilience
A Critical but Underappreciated Metric: Reserve Replacement Rate
One area that many investors overlook when analysing gold miner FCF is the reserve replacement rate. A producer can generate exceptional free cash flow in any given year by mining its existing reserves without replacing them through exploration or acquisition. This approach flatters near-term FCF but hollows out the long-term asset base.
Investors should track whether producing companies are replacing at least 100% of the ounces they mine each year through reserve additions, ensuring that today's cash generation does not come at the expense of tomorrow's production capacity. In this context, gold exploration trends suggest that many well-capitalised producers are now directing surplus cash toward meaningful exploration programmes.
This is particularly relevant in the current environment, where elevated gold prices create an incentive to mine at higher throughput rates, which can deplete reserves faster than exploration programmes can replenish them.
Macroeconomic Forces Sustaining the Margin Environment
The macroeconomic backdrop supporting gold miner profitability is more nuanced than simply a high gold price. Several structural forces are at work simultaneously.
Central bank gold demand has provided a consistent demand floor beneath the gold price. Institutions from China, India, Poland, and multiple other emerging market central banks have been systematic buyers over the past three years. BMO Capital Markets has noted that China's gold reserves could potentially surpass United States holdings within a five-year timeframe, a structural demand dynamic that has no historical precedent in the modern era.
Safe-haven demand and real yield tension create an ongoing push-pull dynamic. Higher real yields increase the opportunity cost of holding non-yielding gold, creating a natural ceiling on price momentum. However, gold has demonstrated an ability to sustain levels above US$4,000 per ounce even in a higher-for-longer rate environment, suggesting that structural demand factors are partially offsetting traditional rate sensitivity.
Supply constraints are also building. Average ore grades at producing mines globally have been declining for decades as high-grade deposits are depleted and new discoveries trend toward lower-grade, more geologically complex mineralisation. This structural supply tightening supports a higher long-run equilibrium gold price independent of short-term macro factors.
How Gold Price Consolidation Near US$4,000 Still Supports Exceptional Margins
Even without a further gold price breakout, the mathematics of current production economics remain compelling. At US$4,000 per ounce against sector average cash costs of approximately US$1,323 per ounce, producers retain an operating margin of roughly US$2,677 per ounce. This compares favourably against any prior gold cycle when adjusted for historical cost structures, and it means that current capital return programmes can be sustained without requiring gold to push materially higher.
Frequently Asked Questions: Gold Miners and Free Cash Flow
Why are gold miners generating record free cash flow right now?
The combination of gold prices trading above US$4,000 per ounce and disciplined cost management has created the widest operating margins in at least 15 years. With sector cash costs averaging approximately US$1,323 per ounce, producers are retaining over US$2,600 per ounce produced at current price levels, a margin profile that directly translates into gold miners generating record free cash flow.
Which gold miner generated the most free cash flow in 2025?
Newmont led the sector with US$7.3 billion in free cash flow for full-year 2025, followed by Barrick Gold at US$3.87 billion. On a single-quarter basis, Agnico Eagle reported US$1.335 billion in Q2 2026, a company record.
What is the difference between free cash flow and earnings for gold miners?
Free cash flow represents the actual cash generated after all operating costs and capital expenditure have been paid. It is the real cash available for dividends, buybacks, debt repayment, or project reinvestment. Net income can be significantly distorted by non-cash items including depreciation of mining assets, impairment charges on acquired properties, and hedging book adjustments. For mining companies with large fixed asset bases, FCF is generally considered a more reliable indicator of financial health and capital return capacity than reported earnings.
What risks could materially reduce gold miner free cash flow?
- A sustained decline in gold prices, particularly below US$2,500 per ounce
- Unexpected escalation in operating costs driven by labour, energy, or materials inflation
- Geopolitical disruptions to mine operations in higher-risk jurisdictions
- Regulatory changes affecting royalty rates or tax regimes in key mining countries
- Technical failures or geological challenges reducing production throughput
- Aggressive and overpriced M&A activity, a historical destroyer of value in the sector
Are gold miners a good investment during a gold price consolidation phase?
Gold miners can remain highly profitable during consolidation, provided gold prices stay well above production costs. At current cost structures, prices would need to fall significantly before the sector's FCF generation would be materially impaired. Current consolidation near US$4,000 per ounce still supports exceptional margins. This should not be construed as financial advice. Individual circumstances vary and investors should conduct their own due diligence.
The Emerging Investment Case: Cash Flow Compounders in an Unexpected Sector
The investor profile being attracted to gold equities is quietly changing. Historically, the sector drew speculative capital seeking leveraged exposure to gold price movements. Today, the combination of record FCF generation, improving balance sheets, net cash positions, and disciplined shareholder return programmes is drawing a different type of buyer: value-oriented and income-focused institutional investors who evaluate companies on fundamental cash generation metrics.
This shift mirrors a broader pattern observed in the energy sector following the 2020 to 2021 restructuring, when oil majors emerged from the pandemic downturn as genuine cash flow machines and attracted a new cohort of income investors who had previously avoided the sector entirely. Gold miners appear to be at an early stage of a similar rerating process.
The key structural tailwinds reinforcing the long-term thesis include:
- Central bank demand providing a durable floor beneath gold prices independent of Western investment sentiment
- Declining ore grades at global producing mines constraining future supply growth and supporting long-run pricing power
- Geopolitical uncertainty sustaining safe-haven demand across multiple investor bases simultaneously
- A limited pipeline of large-scale, low-cost new discoveries, meaning existing producers with high-quality reserve bases hold an increasingly scarce asset
The primary risks that could disrupt the current cycle remain gold price correction, cost inflation, and management teams reverting to the value-destructive acquisition behaviour that defined the prior bull market. Investors with longer time horizons who monitor these risks carefully will find that the gold mining sector's current free cash flow story is one of the more compelling value propositions available in today's equity market.
For readers seeking additional perspectives on gold market dynamics, precious metals sector earnings analysis, and macroeconomic developments affecting gold prices, Kitco News provides ongoing coverage from a dedicated team of financial journalists specialising in the sector.
Want to Catch the Next Major ASX Gold Discovery Before the Market Does?
Discovery Alert's proprietary Discovery IQ model delivers real-time alerts on significant ASX mineral discoveries, transforming complex geological data into actionable investment insights — so subscribers can identify opportunities in gold and other commodities ahead of the broader market. Explore historic discoveries and the returns they generated, then begin a 14-day free trial to position ahead of the next major find.