May 11, 2026

The Hidden Mechanics of Gold Mining Profitability: Why Price Matters More Than Volume
Most investors instinctively focus on production volumes when evaluating a gold mining company. More ounces out of the ground means more revenue, and more revenue should mean more profit. It is a logical assumption, but it fundamentally misunderstands how the economics of gold mining actually work. The more revealing variable is not how many ounces a miner produces in any given period, but rather the spread between what it costs to produce each ounce and the price at which that ounce can be sold. When that spread expands dramatically, the financial impact on a producer's bottom line can be extraordinary, and the numbers behind Caledonia Mining EBITDA growth led by gold price gains in Q1 2026 offer one of the clearest real-world demonstrations of this principle in recent African mining history.
When big ASX news breaks, our subscribers know first
Understanding Operational Leverage in Gold Mining
The concept of operational leverage is foundational to understanding why gold miners can generate earnings growth that dramatically outpaces the percentage gain in the underlying commodity price. Unlike technology companies or consumer businesses where costs scale with activity, a gold mine carries a largely fixed cost structure in the short term. Underground labour forces cannot be rapidly resized. Electricity supply agreements, reagent contracts, and maintenance schedules run on fixed or semi-fixed terms. Corporate overhead does not fluctuate quarter to quarter.
This structural reality creates a powerful asymmetry. When the gold price rises by a meaningful percentage, total revenue climbs at or near that rate. Meanwhile, total operating expenditure changes only marginally. The incremental revenue generated above the existing cost base flows almost entirely into EBITDA and pre-tax profit, which is why earnings growth percentages so frequently dwarf the commodity price percentage gain that triggered them. This dynamic is a core reason why gold price leverage matters so profoundly to mining equity investors.
Why Revenue Growth Alone Understates the Story
Consider the mechanics step by step:
- Establish the cost floor: A mine's operating costs, covering labour, energy, processing reagents, mine maintenance, and sustaining capital, define the minimum revenue threshold needed to generate profit.
- Apply a commodity price increase: Rising gold prices lift revenue without a proportional increase in the underlying cost structure.
- Observe the marginal flow-through: Because fixed costs do not move in lockstep with revenue, the incremental dollar above the cost floor flows directly to EBITDA.
- Calculate the leverage ratio: A modest revenue percentage gain translates into a significantly larger EBITDA percentage gain, because the percentage base for EBITDA is smaller than the percentage base for revenue.
This is the core asymmetry that makes gold miners behave more like leveraged instruments on the gold price than simple commodity businesses. A company with stable costs and rising prices will always show earnings growth that exceeds the commodity price gain on a percentage basis.
The Cost-Price Spread as the True Profitability Signal
Mining analysts frequently focus on the all-in sustaining cost (AISC) metric, which was introduced by the World Gold Council in 2013 as a standardised measure encompassing on-mine operating costs, sustaining capital expenditure, royalties, and corporate overhead. The AISC margin, defined as the realised price minus the AISC per ounce, is the single most informative ratio for understanding a gold producer's per-unit profitability and the sensitivity of that profitability to commodity price movements.
When AISC margins expand as a proportion of the realised gold price, earnings leverage intensifies. When gold prices were trading near US$1,300 per ounce in 2018 and a producer's AISC was US$1,000 per ounce, the margin was US$300 per ounce, representing approximately 23% of the realised price. A 10% price increase to US$1,430 per ounce would lift that margin to US$430 per ounce, a 43% improvement in per-unit profitability from a 10% price move. This non-linear relationship between commodity prices and earnings is the defining characteristic of gold mining economics.
Caledonia Mining Q1 2026: What the Numbers Reveal
Against this conceptual backdrop, the Q1 2026 results from Caledonia Mining Corporation PLC provide a textbook case study. Proactive Investors reports that Caledonia Mining posted record profits as the gold price surge tripled cash flow. The headline metrics across the quarter capture a business whose earnings expansion dramatically outpaced both its revenue growth and its production performance.
| Financial Metric | Q1 2026 | Q1 2025 | % Change |
|---|---|---|---|
| Revenue | US$66.43 million | ~US$56.15 million | +18.3% |
| EBITDA | US$33.87 million | ~US$22.55 million | +50.2% |
| Profit After Tax | US$18.91 million | ~US$11.16 million | +69.4% |
| Free Cash Flow | US$12.28 million | US$4.86 million | +152.7% |
| Basic EPS | US$0.80 | ~US$0.45 | +77.8% |
Revenue grew 18.3% year-on-year. However, EBITDA grew 50.2%. Profit after tax surged 69.4%. Free cash flow more than doubled, climbing 152.7%. Basic earnings per share increased by 77.8%. Each successive metric in the profitability chain expanded by a larger percentage than the one before it, a direct illustration of operational leverage working through the income statement in sequence.
The Gold Price Tailwind Driving This Performance
The average realised gold price achieved by Caledonia in Q1 2026 was US$4,816 per ounce, representing a year-on-year increase of 66.3%. Against an AISC of US$2,765 per ounce sold, this implies a margin of approximately US$2,051 per ounce, a profitability buffer that would have seemed remarkable compared to the operating environments of even a few years prior.
What makes this performance particularly striking is that gold production at the Blanket Mine declined by 20.9% to 14,767 ounces during the period. Consolidated sales volumes totalled 13,784 ounces. Despite producing and selling substantially fewer ounces than in the prior year, revenue still grew 18.3% and EBITDA expanded more than 50%. The gold price environment did not merely compensate for lower volumes; it overwhelmed the volume headwind entirely. This case exemplifies why the gold outlook for miners in 2025 and beyond has attracted such significant investor attention.
| Cost Metric | Q1 2026 Value | Realised Price | Margin Per Ounce |
|---|---|---|---|
| On-Mine Cost | US$1,740/oz | US$4,816/oz | US$3,076/oz |
| AISC | US$2,765/oz | US$4,816/oz | US$2,051/oz |
Why Gold Production Declined at Blanket Mine
Understanding the source of the production shortfall is important for contextualising both the quarter and the forward outlook. The Blanket Mine in Zimbabwe operates as a deep underground gold mine, and like all underground operations, it is subject to the variability of ore grade access at any given point in time.
Grade Dilution and Its Cascading Economic Effect
During Q1 2026, access to higher-grade sections of the Blanket orebody was constrained. This caused the head grade, the concentration of gold in ore delivered to the processing plant, to fall from 3.1 grams per tonne (g/t) to 2.5 g/t, a decline of approximately 19%. This single variable triggered a cascade of negative downstream effects:
- Lower head grade means less gold is present per tonne of ore processed
- With less gold entering the circuit, metallurgical recovery efficiency effectively declines on a per-unit basis even if recovery rates remain constant
- Total gold recovered per quarter falls, reducing the ounces available for sale
- Fixed costs are now spread across fewer ounces, pushing the cost-per-ounce metrics significantly higher
- On-mine costs climbed to US$1,740 per ounce sold, reflecting this fixed-cost dilution effect
- AISC, encompassing a broader range of charges, reached US$2,765 per ounce sold
It is worth understanding why grade variability in underground mines is so consequential. Unlike open pit operations where grade can be managed through selective mining of large ore volumes, deep underground mines operate in narrower, more geologically constrained stoping environments. When development work exposes ore zones of lower grade than planned, the mine cannot simply redirect to higher-grade areas immediately; development infrastructure must be progressively advanced to access those zones, a process that takes time.
Recovery Trajectory and the Path Forward
Remedial measures to restore access to higher-grade ore zones were implemented during the quarter, and production metrics showed progressive month-on-month improvement within Q1 2026 itself. This improvement extended into April 2026, providing early evidence that the grade constraint was a temporary disruption rather than a structural geological problem. Full-year production guidance for the Blanket Mine was maintained at 72,000 to 76,500 ounces, with management indicating output is expected to be weighted toward the second half of the year. This back-half loading implies a meaningful acceleration from Q1's 14,767-ounce run rate, requiring significantly stronger performance across the remaining three quarters to reach the lower end of the guided range.
Multi-Year Financial Trajectory: Mapping the Earnings Expansion
The Q1 2026 result does not exist in isolation. It represents the latest data point in a multi-year earnings expansion that has been driven primarily by the gold price cycle. Furthermore, it illustrates how record gold prices have materially transformed producer economics across the sector.
| Period | Revenue | EBITDA | Realised Gold Price | Production |
|---|---|---|---|---|
| FY 2025 | US$267.7M | US$125.3M | US$3,383/oz | Stable |
| Q3 2025 | US$71.4M | US$33.5M | US$3,434/oz | 19,106 oz |
| Q1 2026 | US$66.43M | US$33.87M | US$4,816/oz | 14,767 oz |
One data comparison within this table is particularly instructive. In Q3 2025, Caledonia produced 19,106 ounces and generated EBITDA of US$33.5 million at a realised price of US$3,434 per ounce. In Q1 2026, the company produced 14,767 ounces, approximately 4,339 fewer ounces, yet generated EBITDA of US$33.87 million. A production decline of nearly 23% produced essentially flat EBITDA because the gold price was 40% higher. This single comparison encapsulates the price-leverage relationship more clearly than any theoretical explanation.
The ability to generate equivalent EBITDA with substantially fewer ounces is the defining advantage of operating in a historically elevated gold price environment. For African producers with relatively fixed cost structures, the current pricing cycle represents a transformational margin opportunity.
The Bilboes Gold Project: Building Beyond a Single Asset
The Blanket Mine has been the foundation of Caledonia's operations for decades, but the company's long-term growth ambitions are anchored in the Bilboes gold project, also located in Zimbabwe. A feasibility study for Bilboes was published in November 2025, establishing the technical and economic parameters for development. In January 2026, Caledonia completed a US$150 million convertible senior notes offering to fund early-stage development work and project financing preparations.
Financing discussions are progressing across two parallel workstreams: an interim facility to support near-term development expenditure and a broader project finance facility designed to fund the construction phase. The significance of Bilboes to Caledonia's investment thesis is considerable:
- It would transform the company from a single-asset producer reliant on Blanket into a multi-asset Zimbabwe-focused gold business
- At current gold prices substantially above the assumptions used in initial feasibility planning, the project economics are materially more favourable than when development parameters were originally established
- Successful financing and development would represent a step-change in production capacity, fundamentally expanding the company's revenue and EBITDA ceiling
- The convertible notes structure is designed to preserve balance sheet flexibility, avoiding equity dilution while securing capital for development activities
The project development timeline and ultimate financing outcome remain subject to negotiation and market conditions. Investors should treat Bilboes development milestones as forward-looking indicators that carry execution and financing risk, particularly given the capital-intensive nature of greenfield project development in sub-Saharan Africa.
The next major ASX story will hit our subscribers first
Deep-Level Drilling at Blanket: The Geological Foundation
While the financial headlines dominate near-term investor attention, the geological work occurring below the Blanket Mine carries equal strategic importance for long-term value. Deep-level drilling programmes at Blanket have been generating results that support the continuity of three key orebodies at depth: the Blanket, Eroica, and Lima structures.
In underground gold mining, resource continuity at depth is the geological underpinning of mine life. A mine extracts value by progressively accessing ore zones as development infrastructure advances downward. When drilling confirms that an orebody extends deeper than current reserve estimates, it has two important effects:
- It reduces geological risk associated with future capital investment in shaft deepening and level development
- It supports long mine life assumptions that underpin project finance discussions, sustaining capital planning, and equity valuation models
The Blanket orebody in particular has demonstrated this characteristic across its operational history, with successive drilling campaigns extending the economic depth of the resource. Positive results from the current deep-level programme reinforce the geological case for ongoing investment in Blanket's underground infrastructure.
Gold at Historically Elevated Levels: What It Means for African Producers
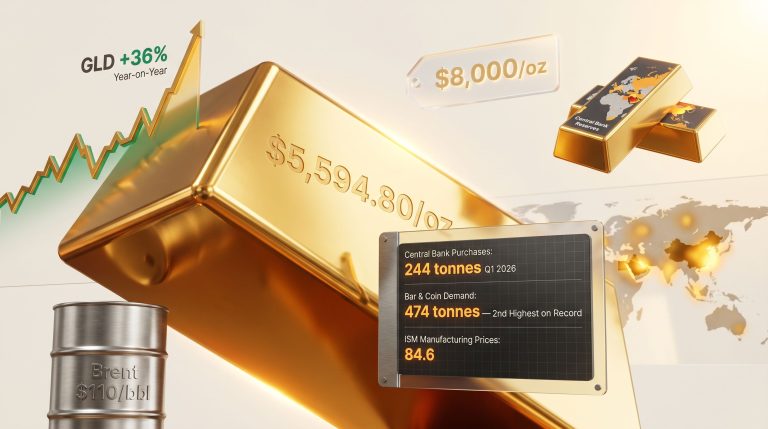
The macro environment that produced Caledonia's Q1 2026 performance reflects a gold market operating at levels that would have been difficult to model with confidence even a few years ago. Gold had been trading in the US$1,800 to US$2,100 range for much of 2022 and 2023, before a significant structural re-rating began in late 2023 and accelerated through 2024 and into 2025.
The drivers most frequently cited by commodities analysts and financial institutions for sustained gold price strength include:
- Sustained and accelerating central bank gold demand, particularly from emerging market central banks seeking to diversify reserve holdings away from US dollar-denominated assets
- Persistent geopolitical uncertainty across multiple regions creating safe-haven demand
- Structurally elevated inflation expectations in key economies that support gold as a store of value
- A gradual de-dollarisation trend in global trade and finance that increases the relative attractiveness of non-currency reserve assets
For African gold producers operating with relatively fixed cost structures, this pricing environment creates exceptional conditions for margin expansion. The AISC margin of US$2,051 per ounce achieved by Caledonia in Q1 2026 represents a profitability buffer that absorbs operational disruptions, funds development capital, and supports shareholder returns simultaneously. It is worth noting that gold price cycles are inherently cyclical and that current elevated pricing does not guarantee sustained future performance. Investors should factor price cycle risk into any assessment of mining company earnings trajectories.
Shareholder Returns in a High-Gold-Price Environment
Strong operating cash generation creates the foundation for capital returns to shareholders, and Q1 2026 demonstrated Caledonia's commitment to this allocation principle. Basic earnings per share reached US$0.80 for the quarter, an increase of 77.8% year-on-year. The board approved a quarterly dividend of US$0.14 per share, payable on 5 June 2026.
Free cash flow of US$12.28 million for the quarter, more than double the prior year's US$4.86 million, provides the liquidity foundation underpinning these returns. The combination of strong per-share earnings growth, dividend maintenance, and substantial free cash flow generation reflects a business generating cash well in excess of its operating and sustaining capital requirements. Furthermore, this performance is consistent with the broader opportunity identified among undervalued gold miners whose earnings power has outpaced their equity market re-rating.
The dividend yield and payout sustainability are naturally contingent on the gold price environment remaining supportive. Should gold prices normalise significantly from current elevated levels, the free cash flow available to support distributions and development investment would contract accordingly. This is the inherent trade-off in resource company investment: the same leverage that amplifies earnings in rising price environments works in reverse when commodity prices fall.
Key Takeaways: What Q1 2026 Teaches Us About Gold Mining Economics
Caledonia Mining EBITDA growth led by gold price gains in Q1 2026 offers a concentrated lesson in how gold mining profitability actually functions under favourable commodity conditions. According to African Mining Market, the 50% EBITDA growth achieved by Caledonia stands as one of the most compelling demonstrations of operational leverage seen across the African gold sector in recent quarters. In summary:
- Operational leverage is the dominant profit driver when cost structures are stable; a 66% price gain generated a 50% EBITDA increase despite a 21% production decline
- Grade variability is manageable in a high-price environment but can create significant unit cost pressure that erodes margins when commodity prices are lower
- The AISC margin is a more informative indicator than production volume when assessing earnings quality and sustainability
- Deep-level drilling programmes at Blanket underpin the geological case for long-term mine life, supporting both sustaining capital investment and future project finance discussions
- Bilboes represents the structural growth catalyst that would move Caledonia beyond its current single-asset production ceiling
- Shareholder returns accelerated materially, with free cash flow more than doubling and EPS growth of 77.8% confirming the earnings power of the current gold price environment
This article is for informational purposes only and does not constitute financial advice. Past financial performance is not necessarily indicative of future results. Mining operations involve geological, operational, and financial risks. The gold price environment described reflects a specific period and is subject to change. Investors should conduct independent due diligence and seek qualified financial advice before making any investment decisions.
Want To Catch the Next Major ASX Gold Discovery Before the Market Does?
Discovery Alert's proprietary Discovery IQ model delivers real-time alerts the moment significant mineral discoveries are announced on the ASX, translating complex geological and commodity data into clear, actionable investment opportunities — exactly the kind of edge that matters when gold price leverage can turn a modest price move into extraordinary earnings growth. Explore how historic mineral discoveries have generated substantial returns and begin your 14-day free trial today to position yourself ahead of the broader market.