July 10, 2026
The Structural Case for Metals Has Never Been Stronger — Here Is Why Most Investors Are Missing It
Investor psychology in commodity markets follows a predictable arc. Capital floods in during euphoria, retreats during correction, and sits on the sidelines during the most asymmetric entry windows. The current moment in the bull market in gold and mining stocks sits squarely within that third phase — a period where structural fundamentals are compounding quietly while mainstream capital remains fixated elsewhere. Understanding why this is happening, and what it means for positioning, requires stepping back from the noise of short-term price moves and examining the mechanics that underpin this metals cycle.
When big ASX news breaks, our subscribers know first
The Macroeconomic Architecture Behind the Current Metals Supercycle
Sovereign Debt and the Currency Debasement Imperative
The overriding force driving this cycle is not speculative momentum — it is arithmetic. Decades of expanding fiscal deficits across the world's major economies have produced debt-to-GDP ratios that cannot be resolved through growth alone. When a sovereign borrower reaches the point where servicing existing debt consumes an ever-larger share of tax revenue, the policy toolkit narrows dramatically.
The only politically viable path that avoids outright default is the maintenance of negative real interest rates — rates that sit structurally below the prevailing rate of inflation — which gradually erodes the real value of the debt load over time.
This is not a tail risk scenario. It is the base case, and it has direct implications for hard asset allocation. Metals and mining equities function as a structural hedge against precisely this type of prolonged fiat currency erosion. The investment thesis is not built on a trading catalyst — it is built on the long-term arithmetic of sovereign balance sheets that cannot be repaired without meaningful currency debasement.
How Negative Real Rates Translate Into Commodity Outperformance
Historical precedent is instructive here. The 1970s and the 2000s both produced multi-year, multi-cycle bull markets in gold, silver, and base metals, and both were characterised by sustained periods of negative real interest rates. What makes the current environment structurally distinct is the scale of the underlying debt problem.
Debt-to-GDP ratios across the G7 are materially higher than in any prior comparable period, which suggests the duration of the negative real rate environment — and therefore the duration of the structural tailwind for metals — could extend well beyond what prior cycles would suggest.
The overriding issue is debt and deficits, and that demands significant currency depreciation over the long term. Therefore, metals and mining are going to benefit. — Brian Lungman, Gold Newsletter, as cited by Palisades Gold Radio
This framing matters because it separates the current bull market from cyclical commodity trades driven by short-term supply disruptions or demand spikes. The metals complex is benefiting from a macro regime shift, not a temporary imbalance. Furthermore, the gold price forecast from multiple institutional analysts supports the view that this repricing still has significant runway remaining.
Where Are We in the Gold Bull Market Cycle?
Defining the Three Phases of a Precious Metals Bull Market
Positioning within a bull market cycle requires a clear framework. Precious metals bull markets have historically unfolded across three distinct phases, each with identifiable characteristics:
| Phase | Characteristics | Typical Drivers |
|---|---|---|
| Phase 1 — Accumulation | Institutional and sovereign buying; retail absent | Central bank purchases, macro hedge demand |
| Phase 2 — Participation | Western institutional and retail capital enters | ETF inflows, speculative positioning, broader media coverage |
| Phase 3 — Euphoria | Public participation accelerates; mining stocks surge | Equity re-rating, M&A acceleration, junior exploration boom |
Current market signals suggest the transition from Phase 1 into Phase 2 is actively underway. The GDX (Gold Miners ETF) broke out of a 13-year technical consolidation pattern spanning 2011 to 2024 — a structural signal that has historically preceded the most explosive phase of a bull cycle. The XAU-to-gold ratio, which measures mining equity performance relative to physical gold, has traded in a historically compressed range for over a decade, pointing to significant re-rating potential that has not yet been realised.
The Disbelief Phase and Why It Creates the Best Entry Points
One of the least discussed but most important features of commodity bull markets is the disbelief phase — the extended window during which prices advance meaningfully without attracting broad retail participation. This mirrors the dynamics observed in the early 2000s gold bull market, where substantial gains were accumulated before the mainstream investment community took notice.
The implication for investors is counterintuitive: the highest-conviction entry opportunities tend to emerge precisely when public awareness is lowest and short-term volatility is highest. A 24% correction in gold mining stocks from February 2026 highs — set against gold's own 13% decline over the same period — has been characterised by sector analysts as a normal cyclical reset rather than a structural break in the trend.
During the 2000s gold bull market, intra-year corrections of 20 to 25% were common, even in years where the sector finished strongly positive on a full-year basis. Conviction through volatility was the defining trait of investors who captured the full cycle.
Analyst consensus from firms including Haywood Securities supports this view, noting that gold equities currently trade at a price-to-cash-flow multiple of 9.6x, only marginally above the five-year average of 8.35x, despite dramatically higher gold prices and historically unprecedented margin profiles. BMO Capital Markets has revised gold equity price targets upward by 15% and copper equity targets by 19%, reflecting both commodity price upgrades and margin expansion recognition. According to Sprott's analysis of gold, silver and miners, the bull market in gold and mining stocks remains structurally intact and considerably underappreciated by mainstream investors.
The Central Bank Demand Dynamic: From Price Driver to Price Floor
How Sovereign Gold Buying Has Evolved Through This Cycle
For approximately the first 18 months of the current bull market, central bank purchases functioned as the primary driver of gold price appreciation. This created an unusual dynamic: central banks do not purchase mining equities or silver, which explains why precious metals equities and silver initially lagged the performance of physical gold — a pattern that confused many investors expecting the traditional leverage relationship to hold.
As Western institutional capital has re-entered the market, the price-setting mechanism has shifted. Central bank gold demand now functions more as a structural price floor than an active marginal driver. Poland has emerged as a significant sovereign buyer in recent quarters, reflecting a broader geopolitical trend toward diversification away from dollar-denominated reserve assets.
China's People's Bank of China recorded its largest reported monthly gold purchase since 2023 in May of that year, with credible reporting suggesting substantial additional volume moves through unreported channels.
The East-West Price Discovery Dynamic
The current price-setting architecture for gold involves a structural tension between Western traders and Eastern accumulators. Western market participants have broadly classified gold as a risk asset, meaning that macro stress events — rising oil prices, hawkish central bank signals, geopolitical disruptions — trigger indiscriminate selling across equities, gold, silver, and other assets simultaneously.
Eastern buyers, particularly Chinese institutions and sovereign entities operating what appears to be a systematic dollar-cost averaging programme, absorb these Western-driven price dislocations. The pattern is clear: when gold prices dip, Eastern tonnage purchases increase; when prices are elevated, purchase volumes moderate. The net effect is a structurally ratcheting upward trend line, with Western volatility effectively creating Eastern accumulation windows.
Strategic implication: Investors who understand this east-west dynamic can reframe short-term corrections as structurally engineered buying opportunities rather than signals of trend reversal.
Gold Equity Valuation: The Margin Revolution Markets Have Not Yet Priced
Why This Cycle Is Structurally Different From 2008 to 2011
During the 2008 to 2011 gold bull market, input cost inflation consumed most of the margin benefit that rising gold prices should have delivered to producers. Oil prices surging toward $140 per barrel meant that the large fuel-intensive fleets powering open-pit mines absorbed the incremental cash flow that the gold price increase generated. Miners offered minimal leverage to gold price appreciation as a result.
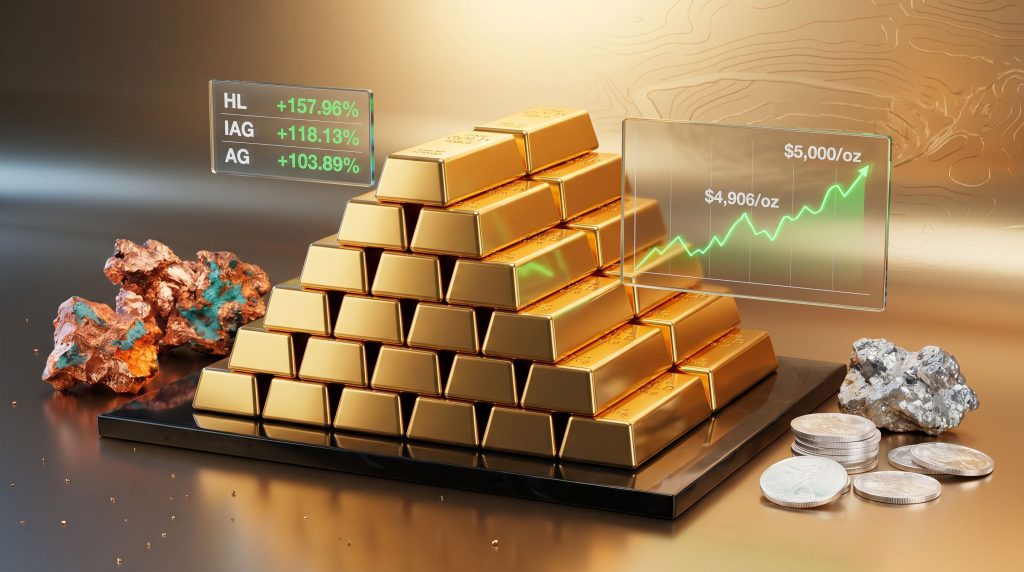
The current cycle has inverted this dynamic. Input cost inflation has materially lagged gold price appreciation, producing margin profiles that are historically unprecedented for the sector. With gold forecast by Haywood Securities to average $4,906/oz in 2026 and $5,000/oz in 2027, the margin expansion still ahead is substantial — and as yet largely unrecognised by a broader market that remains focused on technology sector narratives.
Analyst Price Targets and Valuation Benchmarks
| Metric | Current Level | Implication |
|---|---|---|
| Gold equity P/CF multiple | 9.6x | Near five-year average despite record margins |
| Five-year average P/CF | 8.35x | Minimal premium assigned to current profitability |
| Haywood gold price forecast (2026) | $4,906/oz | Significant margin expansion still ahead |
| Haywood gold price forecast (2027) | $5,000/oz | Structural, not cyclical, repricing anticipated |
| BMO gold equity target revision | +15% | Commodity price and margin upgrade reflected |
| BMO copper equity target revision | +19% | Supply constraint premium being priced in |
Top Performing Gold and Silver Mining Stocks: 1-Year Return Analysis
The following mining equities have led the current bull market cycle during what analysts characterise as the early-to-middle phase — before the full sector re-rating has occurred:
| Ticker | Company | 1-Year Return |
|---|---|---|
| HL | Hecla Mining Co. | +157.96% |
| SSRM | SSR Mining Inc. | +125.04% |
| IAG | Iamgold Corp. | +118.13% |
| AG | First Majestic Silver Corp. | +103.89% |
| GOLD | Barrick Gold Corp. | +87.83% |
These returns have been generated during a phase analysts describe as preceding the most significant equity re-rating event. The implication is that the performance leaders of Phase 1 may not be the same as the outsized performers of Phase 2 and Phase 3.
The Junior Mining Opportunity: Cashed Up, Drills Turning, and Ready to Deliver
Why the Junior Sector Is Entering Its Most Productive Phase
One of the most important and underappreciated structural developments in the current bull market is the financial rehabilitation of the junior exploration sector. For years, many exploration and development companies could not justify the cost of active drilling programmes in a market environment that would not reward discovery results. Instead, they executed lower-cost preparatory work that rarely attracts market attention: geological mapping, geochemical surveys, geophysical analysis, and systematic drill target refinement.
That calculus has fundamentally changed. The bull market in gold and mining stocks has allowed junior companies to rebuild balance sheets to the point where multi-year drill budgets are now fully funded without requiring near-term dilutive capital raises. The transition from preparation to active drilling represents one of the most significant near-term catalysts for the sector, with drill results from high-quality, well-defined targets capable of generating substantial re-rating events.
A particularly important observation from experienced sector analysts is that the previous summer delivered some of the best broad-market drill results seen across the junior mining sector in many years. With drilling campaigns now expanding and results pending from a number of high-profile plays, the information flow into the market is set to increase materially.
How to Evaluate Junior Mining Management at Industry Conferences
Rapid management assessment is a skill that separates experienced sector participants from generalist investors. A practical framework for conference due diligence:
-
Ask questions where you already know the correct answer — particularly questions where the accurate answer may not be commercially flattering to the company. This tests whether management will sacrifice accuracy for a favourable narrative.
-
Probe for downside scenarios explicitly — quality management teams can articulate clearly what could go wrong and how they would respond. Evasion on this question is a significant red flag.
-
Assess track record specificity — ask about prior discoveries, prior companies run, and prior capital allocation decisions. Vague answers warrant scepticism.
-
Evaluate geological scale and optionality — projects sized to move the needle for a major acquirer are structurally more valuable than those suited only to junior-scale production.
-
Understand the financing pathway — in the current environment, developers with quality projects have genuine optionality between attracting acquisition interest and self-financing development. The ability to credibly say "we will develop it ourselves" fundamentally changes negotiation dynamics.
The Acquisition Premium Dynamic: A New Negotiating Reality
A critical insight that distinguishes the current cycle from prior periods is the genuine shift in developer negotiating leverage. Four to five years ago, a junior developer claiming it could independently finance a $200 to $300 million capital expenditure project would have been dismissed as posturing. Today, with gold margins running near 80% at current prices, that claim carries real credibility.
The consequence is structural upward pressure on acquisition premiums. When a developer can credibly threaten to proceed independently rather than accept a below-intrinsic-value takeout offer, the floor on acquisition pricing rises. This dynamic benefits all shareholders in quality development-stage companies, regardless of whether an acquisition ultimately materialises.
Risk Consideration: Acquisition timelines are inherently uncertain. Investors in development-stage companies must assess whether the underlying project economics justify the holding period even in the absence of a near-term acquisition event.
The next major ASX story will hit our subscribers first
The Copper Investment Thesis: Structural Certainty in a Supply-Constrained World
Why Copper Represents the Most Structurally Certain Bull Case in the Metals Complex
Among all metals in the current bull market environment, copper presents what experienced analysts describe as the most structurally certain bull case. The demand trajectory for copper is driven by electrification, energy transition infrastructure, and industrial modernisation — applications that cannot be substituted away from copper at meaningful scale. This creates a demand curve of a type that has rarely, if ever, been seen for a single commodity in modern industrial history.
The copper supply crunch is equally compelling on the supply side, and arguably more durable. The average copper development project requires 15 to 16 years from discovery to first production. This means that even a dramatic price signal sent to the market today cannot generate meaningful incremental supply for well over a decade. Furthermore, many copper projects that have been in various stages of development for 15 or more years remain pre-production, illustrating that capital availability alone does not resolve the systemic timeline constraints embedded in copper project development.
How to Evaluate Copper Junior Investments
The evaluation framework for copper junior companies differs in important ways from gold-focused equivalents:
-
Grade is the primary value determinant — high-grade copper deposits command disproportionate valuation premiums and are viable at a wider range of copper price environments.
-
Scale creates a specific challenge — large copper porphyry projects with capital expenditures of $800 million to $1 billion or more are typically beyond the independent financing capacity of smaller companies, and attempting to finance them can cause severe shareholder dilution.
-
The optimal junior copper strategy involves securing a 20 to 30% minority stake in a large porphyry project and negotiating to be carried as far as possible toward a bankable feasibility study. This structure provides acquisition premium exposure without the full capital intensity of development.
-
Set-and-hold discipline — given the structural nature of the copper supply deficit, experienced analysts advocate for finding quality copper plays and maintaining positions through volatility rather than attempting to trade around short-term price moves.
The Silver Investment Case: Monetary Heritage Meets Industrial Scarcity
Why Silver Is the Highest-Leverage Play in the Current Precious Metals Cycle
Silver has historically outperformed gold in the latter stages of precious metals bull markets, delivering amplified returns — and amplified drawdowns — relative to gold. This leverage relationship has held across multiple cycles, making it one of the more reliable historical patterns in commodity investing.
What distinguishes the current silver environment from prior cycles is the emergence of a structural industrial demand variable that has not been present before. For many years, sophisticated silver analysts dismissed industrial demand as a meaningful price driver, arguing that silver's value was primarily determined by its monetary heritage and investment demand at the margin. That assessment is no longer applicable.
Within the near term, industrial demand for silver — driven by solar panel manufacturing, electronics, electric vehicles, and medical applications — is projected to absorb the entirety of annually mined silver supply. The silver supply deficits that have emerged through consecutive years of above-ground inventory depletion have materially altered the structural supply-demand equation in ways that prior cycles simply did not feature.
The Dual Demand Convergence
The resulting dynamic creates an unusual and structurally bullish demand architecture:
-
Monetary demand (investment flows, ETF purchases, physical coin and bar buying) has historically been the marginal price-setter for silver.
-
Industrial demand (where manufacturers require silver at virtually any price to maintain production continuity) is now competing directly with monetary investors for a supply base that cannot accommodate both at current production volumes.
-
When industrial buyers — who face essentially inelastic demand for silver in their production processes — compete with investment buyers for a supply-constrained commodity, the resulting price dynamics are structurally bullish in a way that is qualitatively different from prior silver bull markets.
Cycle timing note: Silver typically lags gold in the early phases of a precious metals bull market, then dramatically outperforms during the acceleration phase. Gold's sustained advance above prior all-time highs is historically the signal that silver's outperformance phase is approaching.
Critical Minerals: Sovereign Security Premium and the Tungsten Opportunity
Why Tungsten Remains Under the Radar Despite Exceptional Performance
Among the critical minerals complex, tungsten stands out as a commodity that has delivered exceptional price performance over the past 12 to 24 months while remaining largely outside mainstream investment awareness. The strategic importance of tungsten is increasingly recognised by Western governments actively working to address domestic and allied-nation supply chain development, given that supply is heavily concentrated in China — a geopolitical supply security dynamic that mirrors the rare earth elements situation.
The price appreciation already witnessed in tungsten — significant multiples from cycle lows — has not eliminated the bull case. Western investor involvement in the market brings the same volatility dynamics seen in gold and silver: periods of correction that test conviction but do not negate the underlying structural story. For investors with the patience to hold through that volatility, the multi-year bull case for tungsten remains intact.
A Critical Minerals Investment Framework
| Factor | Why It Matters |
|---|---|
| Jurisdiction alignment | Sovereign offtake and financing structures only available to allied-nation projects |
| Supply concentration risk | Commodities with China-dominant supply chains carry geopolitical scarcity premiums |
| Industrial inelasticity | Critical minerals with no viable substitutes command structural price premiums |
| Government participation visibility | Price floor agreements and equity stakes reduce downside risk and improve financing terms |
It is important to note that while sovereign governments including the United States have been active in pursuing critical mineral supply security through various mechanisms, any specific project-level implications of this policy environment should be verified on a company-by-company basis rather than assumed as a blanket benefit.
Navigating Volatility: Maintaining Conviction Through Bull Market Corrections
A Risk Management Framework for the Current Cycle
The mechanics of bull market corrections in precious metals and mining stocks are well established historically. Western speculative capital exits during macro stress events, creating temporary price dislocations that longer-duration, structurally positioned investors absorb. Seasonal patterns typically produce weakness in mid-summer, followed by renewed strength entering the autumn period — a pattern that has repeated consistently across multiple cycles.
A practical risk management framework for participating in the bull market in gold and mining stocks:
-
Distinguish between cyclical corrections and structural reversals — use macro fundamentals (real interest rate trajectory, central bank policy direction, sovereign debt dynamics) as the primary analytical filter, not short-term price action.
-
Maintain position sizing discipline — junior mining stocks can deliver 300 to 500% returns across a bull market cycle but require genuine tolerance for 30 to 50% intra-cycle drawdowns.
-
Prioritise quality over momentum — high-grade projects with experienced, transparent management teams outperform across full cycles, not just in momentum phases.
-
Use seasonal weakness as an accumulation framework — mid-year weakness in precious metals has historically represented superior entry points relative to autumn strength periods.
-
Avoid over-trading — the most significant returns in mining bull markets accrue to investors who maintain positions through volatility, not those who attempt to time short-term moves precisely.
The lesson of history in a bull market is to buy the dips. Current conditions, combining a seasonal low with broader market consolidation, represent precisely the type of environment where long-duration investors have historically accumulated positions that delivered the largest gains in subsequent phases. — Brian Lungman, Gold Newsletter, as cited by Palisades Gold Radio
Frequently Asked Questions: Bull Market in Gold and Mining Stocks
Is it too late to invest in gold mining stocks?
Analyst consensus from Haywood Securities and BMO Capital Markets suggests the current bull market in gold and mining stocks remains in its early-to-middle phase, with the most significant equity re-rating still ahead. Gold equities trade near their five-year average price-to-cash-flow multiple despite record margins, indicating the market has not yet fully priced in the current profitability environment. Gold is forecast to average $4,906/oz in 2026 and $5,000/oz in 2027, implying further margin expansion for producers. For a broader perspective on where the cycle currently sits, gold stocks to watch in a structural bull market provide useful context on the relative positioning of individual equities.
Why have mining stocks underperformed physical gold in this bull market?
The early phase of this bull market was driven predominantly by central bank gold purchases — a buyer class that does not purchase mining equities or silver. This suppressed the typical leverage that mining stocks provide to gold price appreciation. As Western institutional capital reasserts control over price discovery, mining stocks are expected to resume their historical role as leveraged proxies for gold price movements.
What makes the silver bull case different this cycle?
Unlike prior precious metals cycles, industrial demand for silver is now projected to absorb the entirety of annual newly mined supply within the near term. Combined with depleted above-ground inventories and the re-emergence of monetary investment demand, this creates a dual-bidder dynamic for a supply-constrained commodity that is structurally distinct from any prior silver bull market.
This article is for general informational purposes only and does not constitute investment advice, a solicitation, or an offer to buy or sell any securities. All forecasts, price targets, and analytical frameworks referenced involve inherent uncertainty. Past performance of any asset class, sector, or individual security is not indicative of future results. Readers should conduct independent research and consult a licensed financial adviser before making any investment decisions. References to analyst price targets and forecast figures from Haywood Securities and BMO Capital Markets are included for informational context only and do not constitute endorsement of those forecasts.
Want to Know Which ASX Mining Stocks Could Deliver the Next Major Discovery?
Discovery Alert's proprietary Discovery IQ model scans ASX announcements in real time, instantly identifying significant mineral discoveries across gold, silver, copper, and critical minerals — turning complex data into actionable opportunities before the broader market reacts. Explore historic discovery returns that illustrate the extraordinary upside potential this bull market can deliver, and begin your 14-day free trial at Discovery Alert to position yourself ahead of the next major re-rating event.