July 14, 2026
The Hidden Architecture of Gold's Price: Why Policy Signals Matter More Than Rate Decisions
Every major gold bull cycle in modern financial history has been shaped less by the rates themselves and more by the anticipation of where rates are going. Investors who focus exclusively on whether the Federal Reserve moves its benchmark rate by 25 basis points are watching the wrong variable. Understanding gold's next move and Fed interest rates requires examining forward guidance, dot plot revisions, and the subtle language choices of central bank communication.
This distinction separates reactive trading from informed positioning, and it has never been more relevant than in mid-2026. Furthermore, investors who grasp this nuance are far better placed to navigate periods of acute policy uncertainty.
When big ASX news breaks, our subscribers know first
Why Fed Policy Is the Single Most Powerful Force Behind Gold Prices Right Now
The Inverse Relationship Between Interest Rates and Gold
Gold generates no yield. It pays no dividend, earns no coupon, and produces no cash flow. This fundamental characteristic means that its attractiveness as an asset rises and falls in direct proportion to the yield available on competing assets, particularly U.S. Treasuries.
When real interest rates climb, the opportunity cost of holding gold increases. Investors can earn a meaningful return simply by holding inflation-protected government securities, which consequently diminishes gold's relative appeal. However, when real rates fall, or when investors expect them to fall, that calculus reverses sharply.
The critical distinction here is between nominal rates and real rates. Gold primarily responds to real yields, which are nominal yields minus inflation expectations. A nominal rate of 4% paired with 3.5% inflation creates a real yield of just 0.5%, which is far less punishing for gold than a nominal rate of 3.5% with 1% inflation.
Tracking the 10-year Treasury Inflation-Protected Securities (TIPS) yield is therefore a more reliable leading indicator for gold direction than watching the federal funds rate in isolation. The gold and bond dynamics relationship has strengthened considerably during the post-2022 era of elevated monetary policy uncertainty, as investors have become acutely sensitive to shifts in the inflation-rate dynamic.
Where the Federal Reserve Stands in July 2026
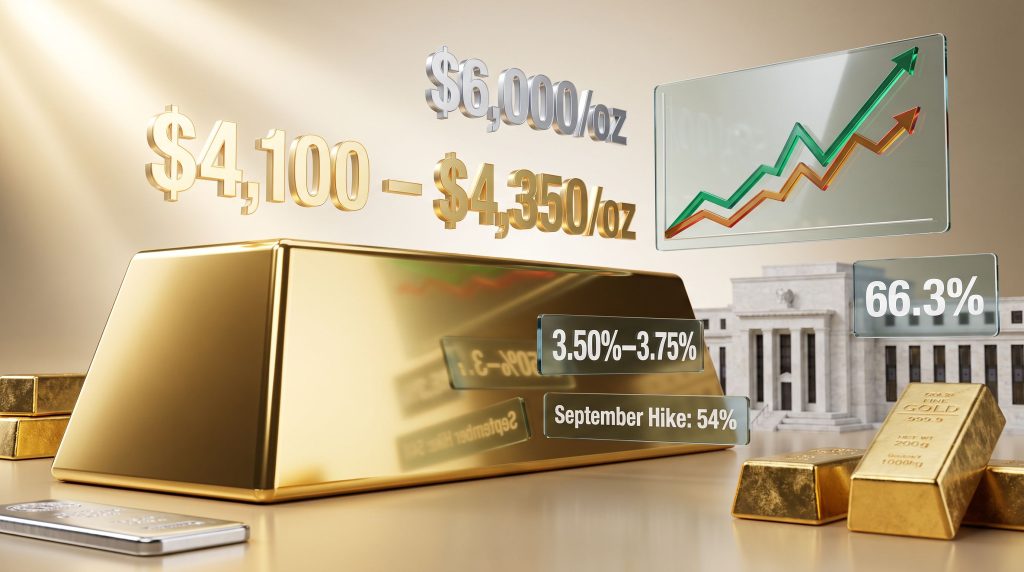
The current federal funds rate target range sits at 3.50% to 3.75%, a level that reflects the cumulative tightening cycle of recent years. Market pricing as of mid-July 2026 implies a 66.3% probability that the Fed holds rates steady at its upcoming meeting, meaning most participants have already assigned a hold as their base case.
More telling is the trajectory of September 2026 expectations. The probability of a rate hike at that meeting has declined from 66% to approximately 54% following softer-than-expected labour market data, suggesting the tightening cycle may be approaching its terminal phase without a definitive pivot.
The Fed's dot plot now projects an end-2026 rate of 3.8%, revised upward from a prior projection of 3.4%, and no rate cuts are currently priced into 2026. In addition, understanding Fed interest rates and gold outlook through the lens of real yields and dollar guidance provides further clarity on this evolving picture.
The July 2026 Fed decision is unlikely to hinge on the rate move itself. Markets have already priced in a hold. The real market-moving variable will be the tone of policy guidance and any revisions to the dot plot projections.
What Is Gold Actually Doing Right Now? A Price Structure Analysis
Gold's Current Trading Range and Key Technical Levels
Gold has been navigating a zone of significant technical volatility. The metal briefly tested $4,150 per ounce before retreating below $4,100, a move that reflects the tug-of-war between structural bullish fundamentals and near-term rate uncertainty. For traders and long-term investors alike, the price structure in this range carries meaningful implications.
The most closely watched technical zone is the $4,200 to $4,250 per ounce support band. A sustained break below this level on a closing basis could accelerate selling pressure as algorithmic and momentum-driven strategies pile into short positions. Near-term resistance is identified at $4,350 per ounce, a level that would likely require a dovish Fed catalyst or a significant deterioration in U.S. economic data to clear convincingly.
Silver's price action has added a layer of complexity to the precious metals picture. Having briefly approached $60 per ounce, the white metal pulled back sharply, experiencing proportionally larger declines than gold. Furthermore, the gold-silver ratio analysis reveals that this amplified volatility in silver relative to gold is characteristic of risk-off episodes where industrial demand fears temporarily override structural supply-demand dynamics.
The Two Forecasting Camps: Bearish vs. Bullish Scenarios for Gold in 2026
The range of analyst forecasts for gold through end-2026 is unusually wide, reflecting genuine uncertainty about the Fed's policy path and geopolitical developments.
| Scenario | Forecast Range | Key Trigger |
|---|---|---|
| Bearish | $2,875 to $2,994/oz by end-2026 | Fed rate hikes solidify; hawkish dot plot revision |
| Base Case (Hold) | $4,100 to $4,350/oz consolidation | Rates unchanged; mixed macro signals persist |
| Bullish | Up to $6,000/oz by Q4 2026 (J.P. Morgan) | Dovish Fed pivot plus geopolitical de-escalation |
J.P. Morgan's $6,000 per ounce target for Q4 2026 represents one of the most aggressive bullish forecasts on record for the metal, contingent on both a Fed policy shift and meaningful resolution of geopolitical conflicts. This is a scenario-based projection, not a consensus view, and should be interpreted accordingly.
Disclaimer: Price forecasts cited above represent analyst projections and do not constitute financial advice. Gold markets involve significant risk and actual outcomes may differ materially from forecasts.
What Forces Are Competing for Control of Gold's Direction?
The Four-Factor Framework Driving Gold in Mid-2026
Understanding gold's price action requires mapping the competing forces simultaneously at work. The following framework summarises the primary directional drivers as of July 2026.
| Driver | Directional Bias | Current Status (July 2026) |
|---|---|---|
| Fed Rate Hike Probability | Bearish for gold | September hike odds declining, now approximately 54% |
| Rate Cut Expectations | Bullish for gold | No cuts projected for 2026 |
| U.S. Dollar Trajectory | Bearish for gold | Dollar firming on hawkish Fed undertones |
| Geopolitical Risk Premium | Bullish for gold | Iran conflict dynamics reducing safe-haven urgency |
How the Fed's Internal Division Is Creating Market Uncertainty
The June FOMC meeting minutes revealed a more fractured policy committee than markets had fully anticipated. Two distinct camps have emerged within the Fed:
- One faction continues to advocate for additional rate increases, citing inflation that remains above the 2% target and services-sector price pressures that have proven remarkably persistent
- A second faction argues that labour market deterioration, which is becoming visible in softening payroll growth and rising unemployment claims, justifies either a prolonged pause or an eventual move toward easing
- This internal disagreement has removed the clarity that markets typically rely on to position efficiently, translating directly into elevated volatility across precious metals
- The disconnect between these two camps also means that post-meeting statements and press conferences carry amplified market-moving potential
For instance, gold price forecasts published earlier this year anticipated precisely this kind of internal Fed division as a key source of near-term uncertainty.
The Role of Fed Chair Kevin Warsh
Markets are paying close attention to the communication style and policy signals emerging from Fed Chair Kevin Warsh. His approach to forward guidance will heavily influence how investors interpret incoming data.
A hawkish statement or an upward revision to the dot plot could trigger an immediate gold selloff, while any language that signals a genuine pause or hints at future accommodation could catalyse a sharp rally in bullion prices. In a market environment where the rate decision itself is largely pre-priced, the words matter more than the numbers. According to FX Empire's analysis of the Fed's next major move, forward guidance language has historically been the dominant catalyst for sharp gold price shifts.
Why Gold's Structural Demand Story Hasn't Changed
Central Bank Accumulation: The Multi-Year Trend That Keeps Supporting Gold
Beneath the day-to-day volatility driven by Fed speculation lies a structural demand dynamic that has been building for several years. Central bank gold demand has remained sustained and systematic, with institutions consistently adding to reserve holdings across multiple consecutive years.
The primary motivation driving this trend is reserve diversification, specifically the desire to reduce exposure to U.S. dollar-denominated assets. Gold offers central bank reserve managers a non-sovereign, liquid store of value that cannot be frozen through unilateral sanctions, cannot be devalued through monetary policy decisions made in Washington, and carries no counterparty risk.
These characteristics have become increasingly valued in a geopolitically fragmented world. This structural demand provides a meaningful floor beneath gold prices that short-term rate volatility alone cannot easily displace. On the supply side, annual global gold mining output sits at approximately 2,600 tonnes per year, and supply growth is inherently constrained by the long lead times and capital intensity required to bring new mines into production.
Industrial and Emerging Demand Drivers for Silver
Silver's near-term price weakness has obscured a fundamentally strong long-term industrial demand picture. The metal's unique physical properties, including its unmatched electrical conductivity, make it effectively irreplaceable across several high-growth sectors.
Key growth sectors driving silver consumption over the coming decade include:
- Solar energy infrastructure, where silver paste is used in photovoltaic cell manufacturing
- Electronics and semiconductor manufacturing, where silver's conductivity is critical
- Artificial intelligence data centre buildout, which requires substantial quantities of electronic components
- Defence and aerospace applications, where silver is used in high-performance electrical systems
- Power grid modernisation and expansion projects globally
The current price weakness in silver relative to these demand fundamentals reflects short-term economic anxiety rather than any structural deterioration in the metal's long-term demand outlook.
The divergence between silver's weak near-term price action and its demonstrably robust industrial demand trajectory creates a potential medium-term opportunity for investors who can distinguish between cyclical price pressure and fundamental demand growth.
How Should Investors Interpret Gold's Volatility? A Strategic Framework
Understanding Consolidation Phases in a Macro-Driven Bull Market
Gold's history offers important context for the current environment. Periods of elevated volatility during monetary policy uncertainty have frequently preceded significant directional moves in the metal, in both directions. What distinguishes productive consolidation from genuine trend reversal is whether the underlying fundamental drivers remain intact.
In the current cycle, those fundamentals — namely central bank accumulation, constrained mine supply, reserve diversification demand, and inflation uncertainty — remain structurally intact. Volatility during a period of acute policy ambiguity is a feature of gold markets, not a signal of structural breakdown.
Disciplined long-term investors have historically used high-volatility windows as accumulation opportunities rather than exit triggers. This behavioural pattern reflects a key insight: price volatility and fundamental value diverge most sharply at precisely the moments when short-term uncertainty is highest.
The Inflation Data Catalyst: What to Watch
Upcoming U.S. CPI and PCE data releases represent the next major directional trigger for gold's next move and Fed interest rates expectations. Two scenarios define the range of outcomes:
Scenario A: Cooling Inflation
Reduces pressure on the Fed to continue hiking, lowers the probability of a September rate increase, softens the U.S. dollar, and provides a bullish catalyst for gold. This scenario also increases the probability that rate cuts eventually appear on the horizon for 2027.
Scenario B: Sticky Inflation
Reinforces the hawkish faction's case within the FOMC, increases September hike probability back toward or above 60%, strengthens the U.S. dollar, and creates downward pressure on gold. This scenario could push prices toward or below the critical $4,200 support zone. Furthermore, the gold safe-haven demand dynamic would likely be overshadowed by rate pressures in this environment, complicating the bullish case considerably.
Step-by-Step: How to Assess Gold's Next Move Using the Rate-Policy Framework
- Monitor the Fed's dot plot revisions, not just the rate decision itself, as these reveal the committee's forward rate path expectations
- Track real yield movements on 10-year TIPS as a leading indicator for gold direction, since gold responds to real rather than nominal rates
- Watch the U.S. Dollar Index (DXY) closely, since sustained dollar strength typically creates a headwind for gold denominated in dollars
- Assess central bank buying data from the World Gold Council quarterly reports to gauge structural demand continuity
- Evaluate the geopolitical risk premium present in gold prices, recognising that escalation adds a safe-haven bid while de-escalation removes it
- Review upcoming inflation prints carefully, since the CPI and PCE trajectory will directly shape Fed guidance language at the next meeting
The next major ASX story will hit our subscribers first
A Lesser-Known Dynamic: When Geopolitical Risk and Rate Risk Pull in Opposite Directions
One of the more underappreciated complexities in the current gold market is the simultaneous presence of two forces that normally move in isolation. The Iran conflict has historically been expected to generate pure safe-haven demand for gold. However, if military conflict creates inflationary pressure through energy price spikes, it also reinforces the case for the Fed to maintain a hawkish stance.
This creates a situation where geopolitical risk simultaneously supports gold through the safe-haven channel and pressures it through the rate channel. This dynamic partially explains why gold's response to Middle East escalation in 2026 has been more muted and more volatile than historical precedents might suggest.
The net directional impact depends on which channel dominates, and that calculation shifts with every data release and every central bank communication. As noted by Bullion by Post's analysis of the gold-rate relationship, this dual-channel mechanism has become one of the defining features of modern gold price behaviour. Understanding it helps explain why investors tracking only geopolitical headlines are likely to misread the market's behaviour.
Decision Matrix: Gold's Directional Outlook Under Key Scenarios
| Fed Signal | Inflation Data | Geopolitical Outcome | Gold Likely Direction |
|---|---|---|---|
| Hawkish / Rate Hike | Sticky / Hot | De-escalation | Strongly Bearish |
| Hold / Neutral | Cooling | Ongoing Tension | Mildly Bullish |
| Dovish / Pivot Signal | Cooling | De-escalation | Strongly Bullish |
| Hold / Neutral | Sticky | Escalation | Mixed / Volatile |
Frequently Asked Questions: Gold's Next Move and Fed Interest Rates
Will gold go up or down if the Fed raises interest rates?
Historically, gold prices tend to decline when the Fed raises interest rates, because higher real yields increase the opportunity cost of holding non-yielding assets and the dollar typically strengthens. However, when rate hikes are already widely priced into markets, the actual announcement often produces a muted or counter-intuitive response. The more significant driver is whether the rate decision surprises relative to expectations.
What is the current gold price outlook for 2026?
As of July 2026, gold is trading in the $4,100 to $4,350 per ounce range. Forecasts for end-2026 are sharply divergent. Bearish scenarios project a decline to $2,875 to $2,994 per ounce if the Fed resumes hiking. Bullish forecasts, including J.P. Morgan's published target, project prices reaching $6,000 per ounce if the Fed pivots dovish and geopolitical tensions ease. These are scenario-based projections and not guarantees of future performance.
What is the probability of a Fed rate hike in July 2026?
Market pricing as of mid-July 2026 suggests a 66.3% probability that the Fed holds rates steady at the current 3.50% to 3.75% range. The probability of a September 2026 hike has declined to approximately 54%, down from 66%, following softer-than-expected labour market data.
Why are central banks buying so much gold?
Central banks have been systematically diversifying foreign exchange reserves away from U.S. dollar assets, a trend that has accelerated over the past several years. Gold offers a non-sovereign, liquid store of value that is not subject to unilateral sanctions or currency debasement risk, making it strategically attractive for reserve managers operating in an increasingly multipolar geopolitical environment.
What is the critical support level for gold right now?
Technical analysts have identified $4,200 to $4,250 per ounce as a critical support zone. A sustained close below this range could open the door to a more significant selloff, potentially targeting the $4,100 level and potentially lower depending on the macro catalyst.
Does geopolitical risk always push gold higher?
Not always. While geopolitical crises typically trigger safe-haven demand that supports gold, the relationship is nuanced. If a conflict generates inflationary pressure that forces the Fed to maintain a hawkish stance, the resulting rate and dollar pressure can partially offset or even outweigh the safe-haven bid. This dual-channel dynamic is precisely what is being observed with the Iran conflict developments in mid-2026, making gold's next move and Fed interest rates more intertwined than ever.
Key Takeaways for Investors Watching Gold and the Fed in 2026
- The Fed's policy communication tone and dot plot revisions carry more market-moving potential than the rate decision itself in the current environment
- Gold's structural demand fundamentals, including central bank accumulation, constrained mine supply at approximately 2,600 tonnes annually, and reserve diversification trends, remain intact regardless of short-term volatility
- Silver's industrial demand trajectory is fundamentally strong across solar, AI infrastructure, electronics, and defence sectors, despite cyclical price weakness driven by economic uncertainty
- The $4,200 to $4,250 per ounce support zone is the most critical technical level to monitor in the near term, as a sustained break below it could accelerate selling pressure
- The dual-channel effect of geopolitical conflict on gold — simultaneously supporting it through safe-haven demand and pressuring it through inflation-driven rate expectations — is a sophisticated dynamic that many retail investors fail to account for
- Investors with a medium-to-long-term horizon should consider current volatility as a potential positioning window rather than a signal of structural deterioration in the gold bull case
This article is for informational purposes only and does not constitute financial or investment advice. All price forecasts are forward-looking statements subject to material uncertainty. Past performance of gold or any asset is not indicative of future results. Readers should seek independent financial advice before making investment decisions.
Want to Know Which ASX Gold Explorers Could Benefit From the Next Major Discovery?
Discovery Alert's proprietary Discovery IQ model scans ASX announcements in real time, instantly identifying significant mineral discoveries — including gold — and translating complex data into actionable insights for investors at every experience level. Explore historic discovery returns to understand how major finds have generated substantial market returns, and begin your 14-day free trial at Discovery Alert to position yourself ahead of the broader market.