May 20, 2026
Why Energy Markets and Monetary Systems Are Inseparable Forces in History
Few relationships in macroeconomics carry as much explanatory power as the connection between energy supply disruptions and the gold and oil embargo impact on gold prices. This is not a simple cause-and-effect story. It is a chain reaction that moves through inflation, currency credibility, central bank behaviour, and ultimately the demand for hard assets as a store of value. Understanding how oil shocks transmit into gold prices requires looking beyond headline correlations and examining the deeper monetary architecture that connects these two commodities across five decades of economic history.
The oil-gold link is structural, not coincidental. Both assets are priced in US dollars, meaning any sustained weakness in the dollar's purchasing power affects both simultaneously. When energy supply tightens and inflation rises faster than central banks respond, the real value of paper currency erodes. Gold, as a non-sovereign asset with no counterparty risk, historically absorbs that monetary anxiety with precision.
When big ASX news breaks, our subscribers know first
The Transmission Mechanism: From Oil Shock to Gold Rally
How Supply Disruptions Cascade Through an Economy
An oil supply disruption does not simply raise petrol prices. It triggers a sequence of economic pressures that ripple outward through transportation costs, manufacturing inputs, food production, and consumer prices broadly. As businesses absorb higher energy costs, those costs get passed to consumers. Inflation accelerates. Purchasing power declines. Furthermore, if the central bank fails to raise interest rates fast enough to offset that inflation, real yields — the nominal interest rate minus the inflation rate — turn negative.
Negative real yields are gold's most powerful catalyst. When investors holding cash or bonds are effectively losing purchasing power in real terms, the opportunity cost of holding gold, which pays no yield, disappears. Gold becomes not just an inflation hedge but a rational portfolio anchor.
The framework that best captures this dynamic is the transmission chain: oil shock drives inflation higher, inflation outpaces policy response, real yields fall, and institutional as well as retail demand for gold accelerates. This mechanism has repeated across multiple historical cycles with remarkable consistency.
Direct Correlation vs. Macro-Transmission Correlation
It is important to distinguish between two types of commodity correlation. Direct price correlation means two assets move together on a daily or weekly basis. Macro-transmission correlation means two assets share a common causal pathway through the broader economy, even if their daily price movements diverge.
Gold and oil share a macro-transmission relationship. They do not march in lockstep on any given trading day, but when oil drives inflation into territory that overwhelms monetary policy, gold's response is historically dramatic. The key variable bridging the two is always real yields. Without a shift in real yields, an oil price move is simply a commodity event. When real yields fall materially, it becomes a gold catalyst.
What Does History Tell Us About Oil Embargoes and Gold Prices?
The 1973 OPEC Embargo: Shattering Post-Bretton Woods Confidence
The 1973 Arab oil embargo was a defining moment in modern monetary history. Arab oil-producing nations cut supply to Western economies in response to US support for Israel during the Yom Kippur War, triggering an oil price surge of approximately 213%. The downstream effect on Western economies was immediate and severe.
Gold responded with a 65% gain over the same period, eventually trading above $180 per ounce for the first time. However, the price move was not purely about inflation. The embargo exposed the fragility of the US dollar just two years after Nixon removed the United States from the gold standard in 1971. Confidence in the dollar's post-Bretton Woods credibility fractured, and gold absorbed the resulting monetary uncertainty.
The 1979 Iranian Revolution: Compounding Shocks Produce Exponential Outcomes
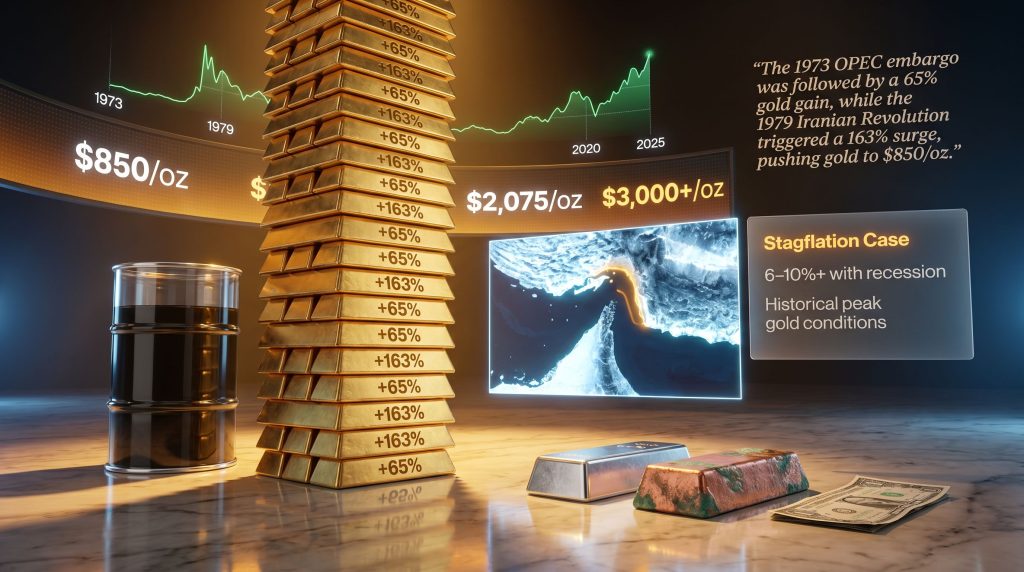
The second major oil shock of the decade arrived through Iran's revolution. Oil prices surged by approximately 119%, and this time gold's response was proportionally far larger, delivering a 163% gain and ultimately reaching a then-record $850 per ounce. The more powerful response was not accidental.
By 1979, a decade of monetary expansion had pre-loaded the system with inflationary pressure. When the second shock arrived, it detonated on already unstable ground. This historical episode illustrates a critical principle: repeated or sustained supply disruptions produce exponentially larger gold reactions than isolated single-event shocks, because the inflationary foundation built during the first cycle amplifies the second.
Comparative Historical Performance
| Event | Period | Oil Price Change | Gold Price Change | Peak Gold Price |
|---|---|---|---|---|
| 1973 OPEC Embargo | 1973–1974 | +213% | +65% | ~$180/oz |
| 1979 Iranian Revolution | 1979–1980 | +119% | +163% | ~$850/oz |
| COVID-19 Supply Collapse | 2020 | Demand crash | +35% | ~$2,075/oz |
| Post-2022 Middle East Tensions | 2022–2025 | Elevated volatility | +100%+ cumulative | $3,000+/oz |
According to historical gold and oil price data, the relationship between these two commodities across decades reinforces the macro-transmission framework described above.
The historical pattern is clear: the two oil embargos of the 1970s cumulatively paved the way for gold to travel from $35 per ounce to $850 per ounce, a journey driven not by a single event but by the sustained convergence of inflationary pressure, policy failure, and collapsing currency confidence.
How Did the COVID-19 Era Redefine the Oil-Gold Transmission Mechanism?
A Demand Shock That Behaved Like a Supply Embargo
The COVID-19 economic shock arrived from an entirely different direction, yet it produced a structurally identical macro environment to an oil embargo. When the pandemic began, gold was trading near $1,500 per ounce. Within less than a year, it had surpassed $2,000 per ounce, a move driven by the same transmission mechanism that characterised the 1970s.
Governments worldwide deployed unprecedented fiscal stimulus programmes. Central banks cut interest rates to near zero. Inflation expectations, initially suppressed, eventually repriced sharply higher as supply chains broke down and monetary expansion flowed into a constrained real economy. The policy response to the shock, rather than the shock itself, was the primary gold catalyst.
This insight matters enormously for interpreting the current environment. The inflation scenario initiated during COVID has not fully resolved. In addition, government spending has not contracted. In fact, the United States has entered what analysts describe as a structural era of approximately $2 trillion in annual fiscal deficits, a figure that represents a persistent debasement dynamic rather than a cyclical anomaly.
The Persistent Deficit Problem and Its Gold Implications
When fiscal deficits are this large and sustained, the monetary system faces a structural challenge. Financing deficits through debt issuance at elevated interest rates is politically and economically costly. The temptation for central banks to tolerate above-target inflation rather than tighten aggressively is historically well-documented.
This dynamic was already in place before any new oil shock emerged. Consequently, the addition of an energy supply disruption on top of an already deficit-expanded monetary base creates the conditions most favourable for gold appreciation across multiple timeframes. With gold above $3,000 already a reality in 2025, the structural case for continued appreciation remains compelling.
Is the Strait of Hormuz the New Oil Embargo?
A Physical Blockade vs. a Political Supply Cut
Approximately 20% of global oil supply transits the Strait of Hormuz. Iranian influence over this maritime corridor represents a qualitatively different type of supply risk compared to the 1973 embargo. The original OPEC embargo was a coordinated political decision — a choice that could be reversed through negotiation. A physical blockade of the Strait of Hormuz would be a structural, geographically constrained interruption that cannot be easily undone through diplomatic channels.
This distinction matters for gold investors. A political embargo ends when the political will to continue it dissolves. A physical chokepoint closure persists until military or logistical conditions change, a process that can take considerably longer. The uncertainty premium embedded in a Hormuz disruption is therefore potentially larger and more durable than any historical precedent. Monitoring crude oil price trends in this context becomes essential for understanding where gold may head next.
Stagflation: The Policy Maker's Nightmare and Gold's Greatest Catalyst
Oil-driven stagflation — the simultaneous occurrence of high inflation and slowing economic growth — presents central banks with an almost impossible choice. Raising rates aggressively to suppress inflation risks tipping an already slowing economy into deeper recession. Cutting rates to stimulate growth risks accelerating the inflation that the oil shock is already generating.
This policy paralysis is not theoretical. It defined the 1970s and produced gold's most dramatic multi-year bull market in modern history. When central banks are caught between two bad options and choose inaction or insufficient action, real yields remain suppressed, and gold benefits from both the inflation hedge dimension and the loss of confidence in institutional monetary management.
Comparing Historical and Modern Crisis Characteristics
| Factor | 1973 Embargo | 1979 Crisis | Modern Middle East Tensions |
|---|---|---|---|
| Duration | ~6 months | ~1–2 years | Ongoing / Indeterminate |
| Mechanism | Political supply cut | Revolution-driven | Physical chokepoint risk |
| Policy Response | Delayed rate hikes | Volcker shock (late) | Uncertain / Politically constrained |
| Gold Outcome | +65% | +163% | Structural bull case building |
What Role Does Federal Reserve Policy Play in the Oil-Gold Equation?
The Real Yield Framework Every Gold Investor Must Understand
Real yields are calculated by subtracting the inflation rate from nominal interest rates. When oil shocks drive inflation higher faster than central banks raise nominal rates, real yields fall toward or below zero. In this environment, gold's appeal relative to interest-bearing assets strengthens materially. The interplay between gold and bond dynamics further illustrates how this yield framework shapes portfolio allocation decisions.
The inverse relationship is equally instructive. When Federal Reserve Chairman Paul Volcker responded to 1970s inflation with aggressively high interest rates in 1980, real yields turned sharply positive, and gold entered a prolonged correction despite the ongoing inflationary environment. The Volcker shock is the primary historical counterexample demonstrating that oil-driven gold rallies can be interrupted by sufficiently forceful central bank action.
The critical question for the current cycle is whether the political and economic environment allows for a comparable response. US CPI readings in early 2025 show March at 3.3% and April at 3.8%, with the trend moving higher. Analysts note that these figures do not yet fully capture the lagged inflationary impact of elevated oil prices flowing through the broader economy, as oil price increases typically take 3 to 6 months to fully transmit into consumer price indices.
A Politically Constrained Central Bank as a Structural Gold Bullish Factor
A central bank perceived to be operating under political influence rather than purely in response to inflation data represents a structurally different environment from the Volcker era. If the Federal Reserve adopts a posture of looking through oil-driven inflation, and if that resolution takes years rather than months, the resulting period of negative real yields could sustain gold's bull market across a multi-year timeframe.
This scenario mirrors the 1970s policy environment more closely than any period since. The decade-long gold rally from $35 to $850 was not driven by a single decision. It was driven by an extended period during which monetary policy was insufficient to contain the inflation generated by successive oil supply shocks and expansionary fiscal policy.
The most dangerous macro environment for bond holders, and the most historically favourable for gold, occurs when a central bank tolerates above-target inflation over extended periods. The 1970s demonstrated that this policy configuration can sustain gold appreciation across an entire decade rather than a single cyclical move.
The next major ASX story will hit our subscribers first
De-Dollarisation and Central Bank Gold Buying: Structural Demand Amplifying the Oil Shock Effect
How Sovereign Reserve Diversification Is Changing the Gold Demand Equation
Central bank gold demand has been consistently elevated for multiple consecutive years, representing a fundamental shift in how sovereign wealth managers view reserve assets. The de-dollarisation dynamic — where nations reduce their holdings of US dollar-denominated assets and rotate into alternatives — has directed a substantial and growing share of that capital toward gold.
Gold's appeal as a reserve asset in a geopolitically fragmented world is straightforward: it carries no counterparty risk, cannot be frozen or sanctioned, and has no issuer whose policy decisions could impair its value. As geopolitical tensions between major economies intensify, these characteristics become more strategically valuable for sovereign wealth managers concerned about reserve asset security.
Currency Market Dynamics and the Thinness Problem
An often-overlooked dimension of the current environment is how thin currency markets can amplify price movements in ways that do not reflect fundamental economic strength or weakness. Recent observations of the ruble's appreciation against the US dollar in a heavily sanctioned, constrained market environment illustrate this principle clearly.
In a thin market with limited participants and constrained trading, price movements can be exaggerated far beyond what underlying economic fundamentals would suggest. This same thinness dynamic applies to gold markets during periods of concentrated demand. When sovereign buyers and institutional investors move simultaneously into gold during periods of geopolitical stress, the relatively limited supply of above-ground gold amplifies price responses. Understanding gold in the monetary system helps clarify why this dynamic is particularly pronounced during crisis periods.
De-Dollarisation Drivers and Their Gold Market Implications
| Driver | Mechanism | Gold Impact |
|---|---|---|
| Central bank reserve diversification | Reducing USD holdings, buying gold | Structural demand floor |
| Sanctions on major economies | Accelerates non-dollar settlement | Boosts gold's monetary role |
| Fiscal deficit expansion (US) | Weakens long-term dollar credibility | Increases gold's safe-haven premium |
| Middle East energy tensions | Inflation risk plus supply uncertainty | Near-term price catalyst |
Does Silver Follow Gold in an Oil Shock Environment?
Silver as a Leveraged Expression of Gold Sentiment
Silver is best understood as a derivative of gold sentiment rather than an independently driven commodity. It rarely initiates its own price narrative but consistently amplifies gold's directional moves, both upward and downward. This leveraged characteristic earns silver the informal description of gold with higher volatility, a characterisation that captures both its appeal and its risk profile.
One important structural distinction separates silver from gold: very few mines are built specifically to produce silver. Silver is primarily a byproduct metal, extracted as a secondary output from mines designed and financed to produce gold or copper. This byproduct status means silver supply cannot easily expand in response to rising prices, creating a structural inelasticity that supports prices during sustained demand periods.
Industrial Demand as a Secondary Bull Case for Silver
Unlike gold, which has limited industrial applications relative to its market size, silver has substantial and growing industrial demand driven by electrification, solar panel manufacturing, and electronics production. This industrial demand layer adds a separate fundamental support beneath silver's monetary and sentiment-driven price, particularly as global energy transition investments accelerate.
During the later stages of historical gold bull markets, silver has tended to outperform gold on a percentage basis. Investors who arrived late to a gold bull market have historically found silver a higher-volatility but potentially higher-return expression of the same macro thesis.
What Is Copper's Role in the Commodity Complex During Energy Transition?
Copper's Bull Case: Structural and Industrial Rather Than Monetary
Copper occupies a fundamentally different position in the commodity complex from gold and silver. Its bull case is not driven by monetary stress, inflation hedging, or geopolitical safe-haven demand. It is driven by the physical requirements of global electrification, including electric vehicle infrastructure, grid upgrades, and renewable energy systems that require exponentially more copper than the energy systems they replace.
This distinction has important implications for how copper responds to the same geopolitical events that catalyse gold. Copper's market is too large, too industrially integrated, and too globally dispersed to be dramatically affected by daily geopolitical headlines. Its story is a slowly unfolding structural narrative. However, this does not diminish the long-term investment case; it simply means copper operates on a different timeline and responds to different signals than gold or silver.
Comparing Investment Characteristics Across the Three Metals
| Metal | Primary Driver | Volatility Profile | Crisis Response | Long-Term Structural Case |
|---|---|---|---|---|
| Gold | Monetary stress, inflation hedge | Moderate | Strong safe-haven bid | De-dollarisation, central bank buying |
| Silver | Gold sentiment plus industrial demand | High | Leveraged gold move | Electrification, solar demand |
| Copper | Industrial demand, energy transition | Moderate | Limited crisis premium | EV infrastructure, grid expansion |
How Should Investors Read Current Inflation Data in the Context of Oil-Driven Pressures?
What Early 2025 CPI Readings Signal
The US CPI readings of 3.3% in March 2025 and 3.8% in April 2025 represent a directionally important upward trend. Critically, these figures do not yet capture the full lagged impact of sustained oil price elevation flowing through transportation, manufacturing, and consumer goods supply chains. Historical precedent indicates that oil price increases take approximately 3 to 6 months to fully embed themselves in official inflation measures.
If oil prices remain elevated or escalate further, the CPI readings in the second half of 2025 could materially exceed current levels. Some analysts project that inflation could reach 6% or higher in this scenario, a level that would significantly alter the calculus for both bond investors and central bank policy makers. Research published by US Global Investors supports the view that gold stands to be among the primary beneficiaries of sustained oil-driven inflation.
Inflation Trajectory Scenario Analysis
| Scenario | Oil Price Trajectory | Expected CPI Path | Implied Gold Response |
|---|---|---|---|
| Base Case | Elevated but stable | 4–5% by late 2025 | Continued gradual appreciation |
| Escalation Case | Hormuz disruption or supply shock | 6–8%+ | Accelerated rally potential |
| Resolution Case | Geopolitical de-escalation | CPI moderates | Consolidation and pullback risk |
| Stagflation Case | High oil prices with slowing growth | 6–10%+ with recession | Historical peak gold conditions |
Key Risk Factors That Could Interrupt a Gold Bull Market
The Rate-Hike Override: When Aggressive Policy Breaks the Cycle
Gold bull markets driven by oil shocks are not immune to interruption. The most historically significant counterforce is an aggressive central bank interest rate response that drives real yields sharply positive. The Volcker-era tightening cycle of 1980 demonstrated that sufficiently forceful monetary policy can break a gold bull market even when underlying inflationary pressures remain elevated.
The relevant question for 2025 is whether current political and economic conditions allow for a comparable response. The weight of analytical opinion suggests they do not, given the scale of existing government debt, the political sensitivity of recession risk, and the stated preference of policy makers to avoid aggressive tightening.
Bond Market Dynamics and the Hard Asset Allocation Case
Bond investors face a structural challenge in an inflationary environment. Fixed coupon payments lose real purchasing power as inflation rises, while the capital value of existing bonds falls as interest rates increase to adjust yield levels. This dynamic reduces the attractiveness of fixed income relative to hard assets during sustained inflationary periods.
The interaction between bond market dysfunction and gold demand is historically well-established. When real returns on sovereign debt turn negative, institutional capital seeks alternative stores of value, and gold historically absorbs a significant share of that rotation. Furthermore, academic research examining gold price drivers across economic cycles consistently identifies this bond-to-gold rotation as one of the most reliable structural patterns in financial markets.
The Mid-Market Gap: Where Gold Stock Analysis Creates Value
Why Coverage Gaps in Gold Equities Create Mispricing Opportunities
The gold equity market has a structural feature that creates persistent mispricing opportunities for informed investors. At one end of the spectrum, the largest producers such as Barrick, Newmont, and Kinross are covered by a large number of institutional analysts, resulting in relatively efficient pricing. At the other end, small explorers and junior miners typically receive no independent coverage whatsoever, relying instead on company-sponsored promotional material.
Between these two extremes sits a middle tier of companies that are too large to be ignored fundamentally but too small to attract meaningful institutional research coverage. This coverage gap creates conditions where data-driven, fundamentals-focused analysis can identify stocks that are materially mispriced relative to their underlying asset value and production profiles.
For investors willing to conduct rigorous analysis in this space, the potential for outperformance relative to gold itself is significant. Hard, fact-driven analysis that ignores promotional narratives and focuses on verifiable metrics has historically identified opportunities that index-following and large-cap-focused approaches miss entirely.
Frequently Asked Questions: Oil Embargoes, Inflation, and Gold Prices
Does an oil embargo always cause gold prices to rise?
Not automatically or immediately. Gold's response to an oil shock depends on whether the disruption generates sustained inflation that outpaces central bank responses, suppresses real yields, and undermines confidence in monetary policy credibility. When all three conditions align, as they did in the 1970s, the gold and oil embargo impact on gold prices can be historically significant. When central banks respond forcefully and early, the transmission to gold is interrupted.
How long does it take for an oil shock to affect gold prices?
The transmission timeline varies by channel. Gold responds quickly, often within weeks, to the sentiment and safe-haven dimensions of an oil shock. The larger, more sustained gains typically materialise over a 6 to 24 month window as inflation data confirms the macro impact and central bank credibility becomes a central market concern.
What is the difference between the 1973 oil embargo and a Strait of Hormuz closure?
The 1973 embargo was a coordinated political decision by OPEC member states that could theoretically be reversed through negotiation. A Strait of Hormuz closure would represent a physical blockade of a critical maritime corridor handling approximately 20% of global oil supply, a condition that cannot be resolved through diplomatic negotiation alone and would be harder to reverse quickly.
Why do central banks buy gold during periods of geopolitical stress?
Gold functions as a non-sovereign reserve asset with no counterparty risk. Unlike US Treasury bonds or dollar-denominated assets, gold cannot be frozen, sanctioned, or impaired by the policy decisions of any single government. During periods of geopolitical fragmentation and dollar reserve uncertainty, gold's neutrality becomes a strategic asset for sovereign wealth managers.
Is silver a better investment than gold during an oil shock?
Silver typically amplifies gold's directional move rather than leading it independently. During sustained gold bull markets, silver has historically delivered stronger percentage gains than gold, particularly in the later stages of a rally. However, silver also carries higher volatility and greater downside risk during corrections, making it a higher-risk, higher-potential-return expression of the same macro thesis.
How does a $2 trillion annual US deficit affect gold prices?
Persistent large-scale fiscal deficits, particularly when central banks are constrained from responding aggressively with higher rates, erode long-term confidence in the purchasing power of the currency. This structural debasement dynamic creates a persistent demand floor for gold as an asset whose supply cannot be expanded by government decree, regardless of fiscal conditions.
The Macro Architecture Supporting Gold in an Era of Energy and Monetary Stress
Five Converging Pillars of the Current Gold Bull Case
The current macro environment does not rest on a single catalyst. Instead, it rests on a convergence of structural and cyclical forces that, taken together, mirror the conditions that produced the most powerful gold bull market in modern history during the 1970s. Specifically:
- Historical precedent: the 1973 and 1979 oil shocks produced 65% and 163% gold gains respectively under comparable macro conditions involving inflationary pressure, policy delays, and currency credibility concerns.
- Inflation trajectory: US CPI trending toward 4% and potentially higher, with the full impact of oil prices not yet reflected in official readings.
- Policy constraint: political and economic conditions that limit the likelihood of a Volcker-style aggressive rate response, keeping real yields suppressed.
- Structural demand: central bank gold buying and the de-dollarisation trend providing a persistent institutional bid beneath gold prices regardless of near-term geopolitical developments.
- Geopolitical risk premium: the Strait of Hormuz scenario representing a physical supply disruption potentially more severe and durable than any historical embargo.
The Long-Duration Investment Thesis
What distinguishes the current environment from previous post-crisis gold rallies is the multi-year rather than cyclical nature of the supporting conditions. Fiscal deficits are structural, not temporary. De-dollarisation is a long-term sovereign strategy, not a short-term trade. Energy supply risk in the Middle East is geographically and politically entrenched, not a single-event shock with a clear resolution pathway.
Gold's role as a portfolio asset in this environment extends beyond crisis insurance. For investors concerned about the long-term purchasing power of paper currency in a world of persistent deficits, constrained monetary policy, and fragmenting geopolitical order, the case for meaningful hard asset allocation rests on a foundation that history suggests is both rare and durable. Indeed, understanding the gold and oil embargo impact on gold prices across five decades of monetary history provides a compelling framework for navigating what may be one of the most consequential macro environments of the modern era.
The clearest lesson from five decades of oil shocks and monetary history is that gold's most powerful rallies are not events. They are processes, driven by the slow accumulation of unresolved inflation, policy inadequacy, and the gradual erosion of confidence in the monetary system. The macro conditions visible in 2025 contain all three of these elements in varying and evolving degrees of intensity.
Want to Know When the Next Major Mineral Discovery Hits the ASX?
Discovery Alert's proprietary Discovery IQ model delivers real-time alerts on significant ASX mineral discoveries, instantly translating complex mineral data into actionable investment insights — ideal for investors seeking to capitalise on the macro forces reshaping commodity markets. Explore historic discoveries and their returns or start your 14-day free trial today to position yourself ahead of the broader market.