July 25, 2026
The Three-Variable Trap: Why Oil-Fueled Inflation Fears Pin Gold Near $4,000
Commodity markets have a long memory. Every major gold bull run in modern financial history has been shaped not by a single catalyst but by the collision of multiple macro forces arriving simultaneously and pulling in competing directions. When those forces are equally weighted, the result is not a trend but a compression zone, where price action becomes increasingly coiled until a dominant catalyst forces a resolution. That is precisely the environment gold finds itself in during late July 2026.
Oil-fueled inflation fears pin gold near $4,000, and understanding why requires unpacking three interlocking variables that are each capable of moving the market independently but are currently neutralising one another in a way that traps price action within a narrow and increasingly tense range.
When big ASX news breaks, our subscribers know first
Understanding the Macro Architecture Behind Gold's Current Deadlock
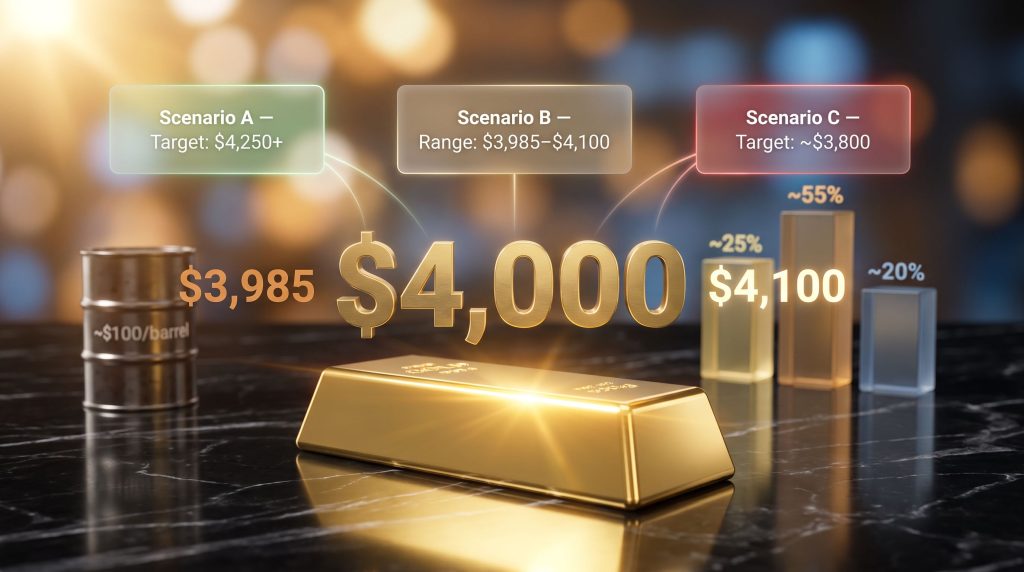
The $3,985 to $4,100 per ounce range that has contained gold through most of July 2026 is not arbitrary. It reflects the mathematical output of three macro forces that are simultaneously supportive and suppressive of price:
-
Variable 1: Energy market disruption driven by the ongoing US-Iran conflict, with crude oil price trends approaching $100 per barrel and threatening to breach that psychologically significant threshold
-
Variable 2: Inflation transmission risk, where rising energy input costs filter through manufacturing, logistics, and agriculture to push headline Consumer Price Index readings higher and extend the timeline for central bank rate normalisation
-
Variable 3: Federal Reserve policy ambiguity under a new leadership era characterised by reduced forward guidance, an historically hawkish baseline, and a marketplace still calibrating how the current chairman approaches decision-making under inflationary pressure
Each of these variables individually has the capacity to move gold by hundreds of dollars per ounce. Together, they are cancelling each other out, creating one of the more unusual and analytically challenging price environments in recent gold market history.
How Oil Prices Near $100 Per Barrel Reach the Gold Market
The relationship between crude oil and gold is frequently misrepresented as a simple positive correlation. In reality, the transmission mechanism is multi-step and conditional, and the direction of the effect depends heavily on the policy response it triggers.
The chain works as follows:
- Energy cost escalation raises producer input costs across nearly every sector of the global economy
- Broader CPI pressure builds as higher transport, manufacturing, and agricultural costs feed into consumer prices
- Extended rate-normalisation timeline emerges as central banks face persistent inflation that delays any pivot toward easier policy
- Dollar strengthening impulse develops as higher-for-longer rate expectations attract capital into USD-denominated assets
- Non-yielding asset pressure mounts as rising real yields increase the opportunity cost of holding gold
- Safe-haven offset partially counteracts this, as the same geopolitical instability driving oil prices also generates demand for protective assets including gold
The net outcome of this chain is not a directional move but a compression, where the supportive and suppressive effects arrive with roughly equal force. Furthermore, understanding the gold safe-haven dynamics at play helps contextualise why these opposing pressures create such a persistent equilibrium.
Why Cost-Push Inflation Behaves Differently for Gold
A critical nuance that many investors overlook is that not all inflation is equal in its effect on gold. The type of inflation matters enormously:
| Inflation Type | Primary Driver | Gold's Typical Response |
|---|---|---|
| Demand-pull | Strong economic growth | Moderately positive |
| Cost-push (energy shock) | Supply disruption | Mixed; policy-dependent |
| Stagflationary | Weak growth + persistent prices | Strongly positive |
| Monetary | Excessive money supply growth | Strongly positive |
The current environment is dominated by cost-push inflation originating in energy markets. This type of inflation creates a paradox for gold: it raises the headline numbers that would normally attract safe-haven buying while simultaneously generating the policy expectations that suppress gold's price performance.
Historically, the determining factor for gold during energy-shock inflation episodes has not been the size of the oil price increase but the speed and aggressiveness of the central bank response. Measured or delayed tightening has consistently allowed gold to sustain gains, while aggressive rate hiking cycles have tended to overwhelm safe-haven demand entirely, as observed during the 2022 Russia-Ukraine energy shock when the Federal Reserve's rapid tightening cycle effectively reversed gold's initial rally.
The Federal Reserve Factor: Forward Guidance Withdrawal and Its Market Consequences
The Federal Reserve's influence on gold markets in the current cycle extends beyond the conventional rate-expectations framework. Under the current Fed leadership, a structural shift in central bank communication has introduced a new and underappreciated source of market volatility.
Forward guidance — the practice of pre-signalling future policy decisions through carefully calibrated language — served for years as a mechanism for anchoring market expectations and reducing volatility around FOMC meeting dates. The effective withdrawal of this tool under the current chairman means that even outcomes carrying an 80% or higher probability in Fed funds futures markets carry greater-than-usual volatility risk around announcement windows. In addition, the central bank influence on gold pricing has become increasingly difficult to model without reliable forward guidance infrastructure.
Key policy dynamics currently shaping gold's price ceiling:
- Market-implied probability of a rate hold at the July FOMC meeting sits above 80% based on Fed funds futures pricing
- The current Fed chair's historical record reflects a lower tolerance for inflation overshoot, raising the probability of hawkish surprises relative to prior Fed eras
- The absence of forward guidance means that market participants cannot rely on pre-announced policy trajectories to smooth out positioning ahead of meetings
FOMC Scenario Matrix: Gold Price Implications
| FOMC Outcome | Market Probability | Expected Gold Response | Key Price Zone |
|---|---|---|---|
| Rate hold, neutral language | ~80% | Modest relief; limited upside | Tests $4,100 resistance |
| Rate hold, hawkish tone | ~12% | Downward pressure | $3,985 support critical |
| Surprise rate increase | ~5% | Sharp sell-off, extended decline | Potential toward $3,800 |
| Dovish pivot signal | ~3% | Strong rally, range breakout | Path toward $4,250+ opens |
Gold's Critical Price Architecture: What $3,985 and $4,100 Actually Represent
Price levels in commodity markets encode collective risk assessment across institutional, retail, and sovereign participants. The specific levels at which gold has repeatedly stalled in July 2026 are not coincidental.
$4,100/oz: The upper resistance zone has seen repeated failures, indicating active selling pressure and insufficient bullish conviction to overcome the macro headwinds described above.
$4,000/oz: The psychological floor has functioned as a gravitational anchor, attracting bargain hunting on each approach while preventing sustained positioning above the round-number threshold.
$3,985/oz: The technical breakdown threshold represents the level at which a confirmed close would remove the psychological support of the $4,000 handle, potentially accelerating selling pressure through stop-loss cascade effects.
$4,250/oz: The bull case target would require a meaningful combination of oil market relief, dovish Fed signalling, or a significant deterioration in broader risk sentiment to achieve. The broader gold price outlook suggests this level remains achievable but contingent on catalyst resolution.
Why Round Numbers Matter More Than They Should
The outsized influence of round-number price levels like $4,000 in commodity markets operates through three reinforcing mechanisms. Large institutional funds and algorithmic trading systems cluster stop-loss and take-profit orders around psychologically significant figures, creating mechanical support and resistance. Media coverage and retail investor attention intensify around major round numbers, amplifying participation and reinforcing the level's significance. Options market gamma concentration at major strike prices creates dealer hedging activity that mechanically acts as a price magnet, making departures from the level self-correcting in the short term.
Historical Precedents: What Energy Shocks Have Taught Gold Markets
Contextualising gold's current behaviour within historical energy shock episodes reveals important pattern information:
| Episode | Oil Price Change | Gold Response | Key Differentiator |
|---|---|---|---|
| 1973-74 OPEC Embargo | ~400% increase | Multi-year bull market | No independent central bank mandate; stagflation followed |
| 1979-80 Second Oil Crisis | ~150% increase | Gold peaked near $850/oz | Volcker rate shock eventually crushed the rally |
| 1990 Gulf War Spike | ~100% temporary spike | Brief rally, quickly reversed | Short-duration shock; rapid resolution |
| 2022 Russia-Ukraine Shock | ~60% increase | Initial rally reversed by Fed tightening | Aggressive tightening overwhelmed safe-haven demand |
| 2026 Middle East Disruption | Approaching $100/bbl | Range-bound near $4,000 | New Fed leadership; reduced forward guidance |
The 2022 episode is particularly instructive for the current environment. Despite genuine inflationary pressure and geopolitical uncertainty, the Federal Reserve's aggressive tightening campaign effectively neutralised gold's safe-haven premium within months. The current setup shares structural similarities, with the critical unknown being whether the Warsh Fed will respond with comparable aggression if inflation data deteriorates further.
However, the gold and bond dynamics across these historical episodes also reveal that periods of genuine stagflation — rather than simple cost-push inflation — consistently produced gold's most dramatic and sustained gains.
The next major ASX story will hit our subscribers first
The Two Catalysts That Could Break Gold's Compression Zone
Two scheduled macro events represent the most significant near-term triggers for a directional resolution:
Catalyst 1: July FOMC Interest Rate Decision (Wednesday)
The rate decision itself carries limited surprise risk given the 80%+ probability of a hold. The greater volatility exposure lies in the post-decision statement language and press conference tone. Any deviation from expected neutral framing — in either a hawkish or dovish direction — could trigger outsized price movement given the absence of forward guidance infrastructure to pre-absorb market reactions.
Catalyst 2: June PCE Price Index (Thursday)
The Personal Consumption Expenditures index is the Federal Reserve's preferred inflation measurement. A higher-than-expected reading would reinforce the oil-to-inflation transmission narrative and increase the probability of future tightening, placing renewed downward pressure on gold. A softer-than-expected print would reduce rate-hike probability and provide temporary support.
The sequencing of these two events matters. An FOMC hold followed by a hot PCE reading could create a particularly difficult environment for gold, as the market would need to simultaneously price in Fed inaction and rising inflation expectations for the next meeting cycle.
Portfolio Positioning Logic Under Three Macro Scenarios
Given the range-bound environment and the binary nature of the upcoming catalysts, investors face a positioning challenge that is less about directional conviction and more about scenario-based risk management.
| Scenario | Probability | Gold Allocation Logic | Primary Risk |
|---|---|---|---|
| Prolonged stalemate | ~55% | Maintain neutral; use $3,985 and $4,100 as directional triggers | Extended range; opportunity cost |
| Geopolitical relief + Fed neutrality | ~25% | Increase on confirmed break above $4,100 | False breakout risk |
| Escalation + hawkish surprise | ~20% | Reduce exposure; safe-haven floor partially limits downside | Rapid de-escalation could reverse positioning |
A stagflationary outcome — where oil disruption persists long enough to slow economic growth while keeping prices elevated — represents the scenario with the most dramatically positive implications for gold. Historical gold data from the World Gold Council suggests gold significantly outperforms in stagflationary environments. However, timing the transition from cost-push inflation to stagflation has proven extremely difficult in practice, and gold has sometimes underperformed in the early stages before the full stagflationary dynamic becomes clear to markets.
Frequently Asked Questions: Gold, Oil, and Inflation
Why is gold range-bound when inflation is rising?
The compression near $4,000 reflects competing forces of roughly equal strength. Oil-fueled inflation fears pin gold near $4,000 precisely because the same inflation generating safe-haven buying also creates rate-hike expectations that strengthen the dollar and penalise non-yielding assets. The net result is equilibrium rather than trend.
What would force a break above $4,100 or below $3,985?
A sustained move above $4,100 would likely require oil market relief, dovish Fed signalling, or intensifying risk-off sentiment. A confirmed break below $3,985 would most probably follow a hawkish Fed surprise, a stronger-than-expected PCE reading, or a meaningful dollar strengthening event.
Is $4,000 a reliable long-term support level?
The $4,000 level is a psychologically significant support zone reinforced by active bargain hunting and geopolitical safe-haven demand. Its durability as a long-term floor depends entirely on the resolution of the three macro variables currently compressing the range: oil market stability, Fed policy direction, and US dollar trajectory.
How does the PCE index specifically affect gold?
When PCE readings exceed consensus expectations, markets interpret this as increasing pressure on the Federal Reserve to maintain or raise interest rates. Higher rate expectations strengthen the dollar and increase the opportunity cost of holding gold, creating downward price pressure. A softer reading has the inverse effect, consequently reducing rate-hike probability and supporting the metal.
Disclaimer: This article is intended for informational and educational purposes only. It does not constitute financial advice, investment recommendations, or a solicitation to buy or sell any financial instrument. All scenario probabilities, price level references, and macro analysis are based on publicly available information and historical patterns. Investing in commodities and financial markets involves significant risk, including the possible loss of principal. Past performance is not indicative of future results. Readers should conduct their own independent research and consult a qualified financial adviser before making any investment decisions.
Want to Stay Ahead of the Next Major Commodity Market Move?
Discovery Alert's proprietary Discovery IQ model scans ASX announcements in real time, delivering instant alerts on significant mineral discoveries — turning complex market data into actionable opportunities for both short-term traders and long-term investors. Explore how historic mineral discoveries have generated substantial returns and begin your 14-day free trial today to position yourself ahead of the broader market.