July 25, 2026
The Fiscal Arithmetic That Makes Gold Impossible to Ignore Right Now
Most conversations about gold eventually arrive at the same crossroads: a dramatic headline forecast from a high-profile commentator, a sharp price correction from recent highs, and an investor trying to decide whether the dip is an opportunity or a warning. That decision framework, when applied to precious metals in 2026, requires separating three very different things from one another: the structural case for gold ownership, the near-term price mechanics driving current volatility, and the extreme price targets that generate clicks without necessarily generating returns.
Understanding how each of these layers operates independently is the foundation of any rational allocation decision. The Kiyosaki gold prediction conversation is useful precisely because it forces investors to confront all three at once.
When big ASX news breaks, our subscribers know first
What the Current Correction Actually Measures
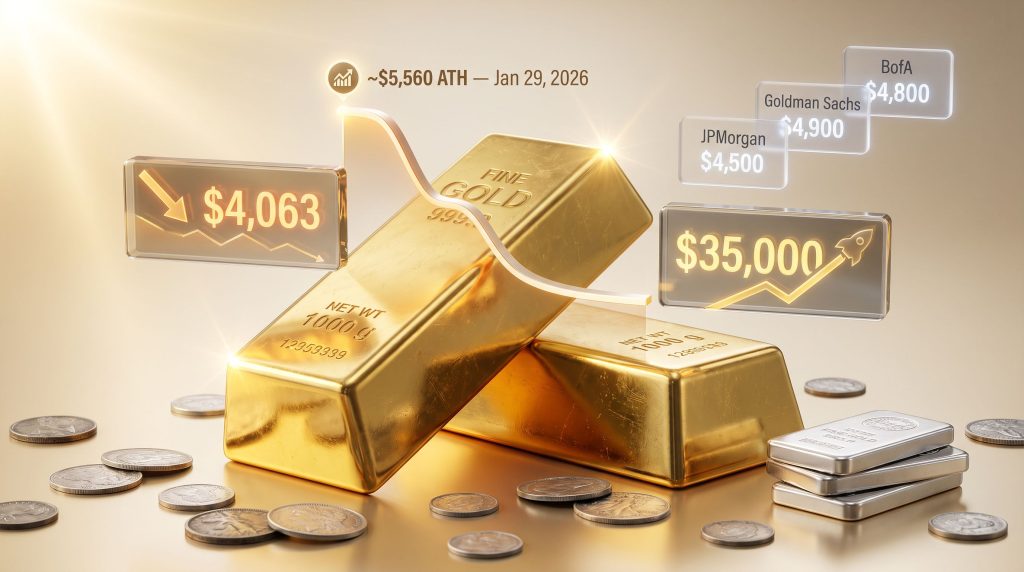
Gold set an intraday all-time high on January 29, 2026, reaching approximately $5,560 per ounce before beginning a multi-month decline. As of late July 2026, spot gold trades near $4,063 per ounce, representing a drawdown of roughly 27% from that peak (GoldSilver.com live price charts, July 24, 2026).
That figure is the operative number for investors asking the Kiyosaki gold prediction buy the dip or wait question. It is not a headline forecast. It is a verifiable market price sitting in a defined relationship to where every major institutional forecast currently points.
Why the Correction Happened: The Rate Sensitivity Mechanism
The mechanism behind the decline is specific and well-documented. Geopolitical escalation involving Iran and the United States in late February 2026 drove energy prices sharply higher. Rising oil prices push up headline inflation expectations, which in turn shift Federal Reserve rate policy assumptions from easing to holding or potentially tightening. When real yields on 10-year US Treasuries move higher, the opportunity cost of holding a non-yielding asset like gold increases. Capital rotates accordingly.
This is a cyclical dynamic, not a structural reversal. Goldman Sachs Global Commodities Research noted in its June 2026 revision that institutional gold demand driven by fiscal deficit concerns, which it described as a new category not present in prior gold cycles, remains intact as a demand floor. The rate sensitivity effect has temporarily overshadowed it, not eliminated it.
Is This Correction Consistent With Prior Bull Markets?
Pullbacks of 20 to 30 percent within broader gold bull markets are historically common. During the 2001 to 2011 bull market, gold experienced corrections exceeding 20% on multiple occasions before ultimately rising from approximately $250 to over $1,900 per ounce. Corrections of this magnitude reflect trader positioning and macro rate dynamics far more than they reflect changes in the underlying demand thesis.
The structural case for gold, grounded in central bank diversification, fiscal deterioration, and currency debasement dynamics, does not require a specific short-term price level to remain valid. It requires that the conditions producing those demand drivers continue to exist. As of mid-2026, they do.
Robert Kiyosaki's Gold Prediction: What It Is and What It Requires
Robert Kiyosaki, best known as the author of Rich Dad Poor Dad, posted a $35,000 per ounce gold target on March 16, 2026, framing it as a consequence of what he describes as a coming systemic financial collapse. In May 2026, he added a $200 per ounce silver target to his public forecast list. His longer-range targets from April 2025, calling for $30,000 gold and $3,000 silver by 2035, represent his multi-decade structural thesis.
These numbers require careful contextualisation. The $35,000 target is not a rate-adjusted, central-bank-flow-modelled projection. It requires a collapse of confidence in the US dollar as the global reserve currency, a low-probability event whose timing is structurally unknowable. However, understanding gold as a strategic investment helps frame why even conservative investors are paying attention to the direction of these forecasts.
Kiyosaki's Prediction Track Record: A Calibrated Assessment
What makes the Kiyosaki gold prediction conversation more than noise is that his directional calls have demonstrated genuine accuracy on multiple occasions. His record deserves honest evaluation rather than dismissal or uncritical acceptance.
| Prediction | Asset | When Made | Outcome |
|---|---|---|---|
| Gold to $3,300 | Gold | July 2024 | Achieved by August 2025 ✓ |
| Silver to $70 | Silver | Early 2025 | Reached $121.67 by January 2026 ✓ |
| $35,000 gold target | Gold | March 16, 2026 | Requires systemic collapse — no institutional model prices this |
| $200 silver target | Silver | May 2026 | Macro shock scenario — not a base-case forecast |
| $30,000 gold / $3,000 silver by 2035 | Both | April 2025 | Multi-decade structural thesis — unresolved |
Sources: Robert Kiyosaki public posts, X (formerly Twitter), March to May 2026
The consistent pattern across his record is directional accuracy combined with imprecision on timing and magnitude. His call for silver to reach $70 when it traded near $35 in early 2025 ultimately proved conservative, with silver reaching $121.67 in January 2026 (World Silver Survey 2026, Silver Institute/Metals Focus). His gold target of $3,300 was achieved on schedule.
His $35,000 figure occupies a different category. It is not wrong in the same way a directional call can be wrong. It is simply contingent on a scenario that cannot be assigned reliable timing and that sits entirely outside the quantitative range of any institutional forecasting model currently published.
Notably, Kiyosaki's near-term posture has recently shifted. Rather than buying indiscriminately on every dip, he has indicated he is waiting for technical confirmation before adding to his position, suggesting he is applying chart-based discipline alongside his macro conviction.
How Institutional Gold Forecasts Compare to the Kiyosaki Target
Major financial institutions model gold prices using real interest rates, dollar strength, ETF flow dynamics, and central bank gold demand data. Their 2026 year-end targets cluster within a defined and internally logical range.
| Institution | Year-End 2026 Target | Revision Date | Key Assumption |
|---|---|---|---|
| JPMorgan | $4,500 | July 3, 2026 | Consolidation phase; rate hold scenario |
| Bank of America | $4,800 | Q2 2026 | Sustained central bank demand |
| Goldman Sachs | $4,900 | June 19, 2026 | Debasement trade as structural demand floor |
| Morgan Stanley (base) | $4,400 | H2 2026 | Conservative rate path |
| Morgan Stanley (upside) | $5,200 | H2 2026 | Rate cuts plus ETF inflow acceleration |
| Kiyosaki Target | $35,000 | March 2026 | Full reserve currency collapse |
Sources: Goldman Sachs Global Commodities Research, JPMorgan Global Research, Bank of America, Morgan Stanley, June to July 2026
The $700 per ounce spread between JPMorgan's conservative estimate and Morgan Stanley's upside scenario represents one of the widest disagreements among major institutional forecasters in recent memory. What every institution shares with Kiyosaki, however, is the directional view: gold is expected to trade significantly above current spot prices by year end. The disagreement is entirely about magnitude and mechanism.
At current spot prices near $4,063, every single institutional year-end forecast represents an implied upside of between 10% and 28% from today's price, without requiring any scenario outside the mainstream.
The Structural Forces That Don't Need a Collapse to Matter
Perhaps the most underappreciated element of the gold demand story in 2026 is how little of the structural bull case depends on a catastrophic outcome.
Central Bank Accumulation: The Data Behind the Direction
Central banks globally purchased 863.3 tonnes of gold in 2025, the fourth-largest annual expansion of official reserves on record, according to the World Gold Council. For context, the annual average between 2010 and 2021 was approximately 473 tonnes. Following the 2022 freezing of Russian dollar reserves in response to the Ukraine conflict, that figure spiked to 1,136 tonnes, the highest since 1950 (World Gold Council, Gold Demand Trends Full Year 2025).
These institutions are not buying gold because they expect a reserve currency collapse. They are buying gold because demonstrated counterparty risk in dollar-denominated reserves changed their calculus permanently.
The US Fiscal Trajectory: Verifiable, Not Speculative
The monetary debasement argument Kiyosaki makes does not rest on conspiracy. It rests on publicly available government data:
- US national debt: approximately $39.6 trillion as of July 22, 2026 (US Treasury Fiscal Data, Debt to the Penny Dataset)
- Annual federal interest expense: exceeding $1 trillion
- Congressional Budget Office projection: net interest as a share of federal outlays rising from 13.85% in FY2026 toward 14.52% in FY2028 (CBO Budget and Economic Outlook 2026 to 2036)
- Average American household gold allocation: well under 1% of financial assets (World Gold Council)
That final figure carries a frequently overlooked implication. The structural underweight in US household portfolios means even modest reallocation toward gold at the retail level would represent meaningful incremental demand pressure at the market level, an asymmetry institutional analysts have flagged as a significant potential upside driver independent of any macro shock scenario.
Silver's Correction: A Dual-Market Problem With a Supply-Side Reality
Silver closed at $58.55 per ounce on July 24, 2026 (GoldSilver.com price charts), having fallen from its January 29, 2026 intraday high of $121.67. The decline exceeds 50%, which is more severe than gold's correction and demands separate analysis.
Understanding Silver's Dual Demand Architecture
Silver operates across two structurally separate demand pools simultaneously, a dynamic that creates price behaviour unlike any other precious metal:
- Industrial demand accounts for roughly 58% of total annual silver consumption, spanning solar panels, electric vehicles, semiconductors, and AI server infrastructure (Silver Institute, World Silver Survey 2026)
- Investment demand, comprising coins, bars, and exchange-traded products, accounts for most of the remainder
When investment sentiment retreats while industrial consumption holds steady, silver prices can fall sharply even as the physical supply-demand balance tightens. That is exactly the dynamic visible in 2026. Investors are selling paper silver while manufacturers continue absorbing physical supply at high rates.
Six Consecutive Years of Supply Deficit
The global silver market has been in structural supply deficit for six consecutive years. This is not a narrative. It is a physical market reality recorded by the Silver Institute's World Silver Survey.
Furthermore, the silver supply deficits driving this dynamic show no signs of reversing in the near term.
| Year | Global Supply Deficit | Mine Production |
|---|---|---|
| 2025 | 40.3 million oz | ~830 million oz (flat) |
| 2026 (forecast) | 46.3 million oz | ~830 million oz (flat) |
Source: Silver Institute / Metals Focus, World Silver Survey 2026
Global mine production has been essentially flat near 830 million ounces annually since 2015, despite rising industrial demand. The gap is being filled by drawdowns from above-ground inventories, a process that compounds with each successive year. A price decline driven by investor sentiment does not reverse the physical market tightening. It simply means those who accumulate during the pullback acquire metal at below-structural-cost prices relative to long-run supply and demand equilibrium.
The next major ASX story will hit our subscribers first
The FOMC Variable: What Rate Decisions Actually Do to Gold
The Federal Reserve meeting scheduled for July 28 to 29, 2026 represents the most immediate catalyst for near-term gold price direction. Understanding the quantitative relationship between rate policy and gold demand is essential to evaluating the buy-the-dip question objectively.
According to Goldman Sachs research, each 25 basis point rate cut historically generates approximately 60 additional tonnes of gold ETF demand within six months. A hold or a rate increase moves the relationship in the opposite direction, reducing ETF inflows and increasing the opportunity cost of gold ownership.
This mechanical relationship explains why near-term price prediction is genuinely uncertain regardless of the long-term thesis. No commentator, institution, or model has consistent 90-day accuracy on Federal Reserve decisions and their market impact. Strategies built around predicting FOMC outcomes consistently underperform strategies that remove the timing dependency entirely.
A Systematic Framework for Acting on the Kiyosaki Gold Prediction
The practical question for investors is not whether Kiyosaki is right about $35,000 gold. It is how to act rationally given that the structural case is compelling, the near-term direction is uncertain, and prices are currently sitting well below both their recent peak and every major institutional year-end target.
Dollar-Cost Averaging: The Mechanics That Eliminate the Timing Problem
Dollar-cost averaging converts price uncertainty from a risk into a mathematical advantage. The process for precious metals works as follows:
- Determine your total target allocation as a percentage of investable assets
- Divide that capital into equal portions across 6 to 12 monthly purchase intervals
- Execute fixed-dollar purchases at regular intervals regardless of the prevailing spot price
- When prices are elevated, fewer ounces are acquired; when prices are depressed, the same capital buys proportionally more
- Over time, your average cost per ounce reflects the mathematical mean of prices across the accumulation period, not a single peak-entry wager
Allocation Sizing by Investor Profile
| Investor Profile | Suggested Precious Metals Allocation | Rationale |
|---|---|---|
| Capital preservation focus | 5 to 10% of investable assets | Standard wealth-protection range |
| Elevated fiscal risk concern | 15 to 20% | Deliberate overweight; not speculative |
| High-conviction structural thesis | 20%+ | Significant opportunity cost risk if wrong on timing |
Physical Metal vs. ETFs: Different Tools for Different Objectives
When considering physical gold vs ETFs, the distinction matters considerably depending on your investment objective. A gold ETF provides price exposure with high liquidity and no storage cost, but the investor holds a share of a fund structure rather than the underlying metal. Physical gold eliminates counterparty risk entirely. Its value is not contingent on any institution's solvency, any trust structure's legal continuity, or any government's fiscal restraint.
For investors whose primary objective is wealth preservation outside the banking system, particularly in the scenarios Kiyosaki describes, physical ownership is the structurally appropriate vehicle. For investors seeking price exposure with flexibility to exit quickly, an ETF serves that function more efficiently. These are not competing choices so much as tools matched to different risk frameworks.
Separating Kiyosaki's Durable Insights From His Extreme Targets
The most intellectually honest evaluation of the Kiyosaki gold prediction holds two things simultaneously: his underlying monetary thesis is sound and well-supported by institutional data, and his extreme price targets require scenarios whose timing cannot be reliably forecast.
His most valuable contribution to the precious metals conversation is the distinction between paper representations of wealth and direct physical ownership of assets that carry no counterparty risk. That distinction does not require $35,000 gold to be actionable. It requires allocating deliberately to assets that cannot be diluted by a monetary policy decision.
The US fiscal trajectory, an approximately $39.6 trillion national debt paying over $1 trillion annually in interest, is a verifiable public record, not a fringe claim. Whether it resolves in the systemic event Kiyosaki predicts or in a slower multi-decade erosion of purchasing power, the appropriate portfolio response is structurally similar: own a deliberate allocation to physical precious metals, understand the mechanism, and execute through a systematic process that removes the timing dependency.
Frequently Asked Questions
Has Kiyosaki's Precious Metals Forecasting Actually Been Accurate?
Directionally, yes, and more than once. His July 2024 prediction that gold would rise from $2,400 to $3,300 by August 2025 was validated. His early-2025 silver forecast of $70 was surpassed significantly when silver reached $121.67 in January 2026. The consistent pattern is directional accuracy combined with imprecision on timing and magnitude. His extreme targets require specific systemic triggers that have not materialised on any predicted schedule, making his calls unsuitable as short-term trading signals even when the directional thesis eventually proves correct.
What Does Technical Confirmation Mean When Kiyosaki Says He Is Waiting?
Technical confirmation refers to price action signals indicating a downtrend has stabilised. Examples include a higher low forming on the chart, a break above a recent resistance level, or a meaningful moving average crossover. Waiting for these signals before committing new capital reflects chart-based entry discipline, applying timing criteria to a conviction-driven thesis rather than buying purely on ideology. This represents a more nuanced approach than many commentators apply to their own forecasts.
What Is the Gold-Silver Ratio and Why Does It Matter in 2026?
The gold-silver ratio analysis measures how many ounces of silver are needed to purchase one ounce of gold. The 50-year historical average sits near 65:1. When the ratio trades materially above that level, as it did above 100:1 in April 2025, silver is historically undervalued relative to gold and has tended to outperform during subsequent recoveries. Investors use the ratio as a relative value compass for tilting allocation between the two metals at different points in the precious metals cycle.
Why Is Physical Gold's Behaviour Different From an ETF During a Crisis?
Physical gold held outside the banking system carries no counterparty risk. During institutional liquidity crises, exchange-traded products can experience redemption friction, trust structure disruptions, or settlement failures that are structurally impossible with a physical bar or coin held directly. The two instruments track the same price during normal market conditions; they diverge in the exact scenarios the gold ownership thesis is designed to hedge against. According to the Silver Institute, similar physical-versus-paper dynamics apply equally to silver holdings during periods of market stress.
Disclaimer: This content is for informational and educational purposes only and does not constitute financial or investment advice. All investment decisions should be made in consultation with a qualified financial adviser. Past performance is not indicative of future results. Forecasts referenced are from third-party sources and are subject to change.
Want to Identify the Next Major Precious Metals Discovery Before the Market Does?
While gold and silver's structural case remains compelling, the real leverage often comes from identifying significant mineral discoveries at the earliest possible stage — precisely what Discovery Alert's proprietary Discovery IQ model is built to do, delivering real-time ASX alerts that turn complex mineral data into actionable opportunities for both traders and long-term investors. Explore Discovery Alert's discoveries page to understand how historic mineral discoveries have generated substantial returns, and begin your 14-day free trial today to position yourself ahead of the broader market.