July 19, 2026
The Hidden Tension Inside Every Gold Price Move
Most investors think of gold as a simple fear barometer. When the world gets dangerous, gold goes up. When calm returns, it drifts lower. But this mental model breaks down in a very specific and increasingly common scenario: when geopolitical instability drives energy prices sharply higher at the same moment central banks are already leaning toward tighter monetary policy.
That is precisely the environment taking shape right now. The phrase gold slips as oil prices advance and Fed rate-hike voices grow is not just a market headline. It describes a structural collision between two opposing forces that rarely arrive at the same time with such intensity. Understanding which force wins, and why, is what separates reactive investors from informed ones.
When big ASX news breaks, our subscribers know first
Two Forces Pulling Gold in Opposite Directions
At its core, the current gold market is caught between competing macroeconomic narratives. Neither is wrong. Both are real. However, they produce contradictory price signals, and the market is being forced to choose between them in real time.
The first force is classic safe-haven demand. Middle East conflict has escalated significantly, with the United States confirming a ninth consecutive night of strikes against Iran following the deaths of at least two U.S. military personnel in Jordan. Iranian-backed forces have continued attacks across the region. This type of sustained, multi-party military engagement historically drives capital into gold as investors seek assets that hold value independent of any single government or financial system. Understanding gold safe-haven dynamics helps contextualise why this demand impulse, while real, is being overridden by monetary forces in this cycle.
The second force is monetary policy repricing. Brent crude has surged more than 3% to breach $90 per barrel, driven largely by disruptions to shipping through the Strait of Hormuz, a chokepoint that handles approximately 20% of global seaborne oil trade. Energy price spikes of this magnitude have a well-documented transmission effect into broader consumer prices, typically flowing through to headline CPI within four to eight weeks.
The problem for gold is that this inflationary impulse is landing in an environment where the Federal Reserve is already considering rate hikes, not rate cuts. That changes everything.
Why Rising Oil Is Bad News for Gold in This Cycle
The relationship between oil prices and gold has never been as simple as the popular narrative suggests. In a low-rate environment, rising oil is moderately bullish for gold because it validates the inflation hedge thesis without raising the opportunity cost of holding a non-yielding asset. However, that logic inverts when central banks are tightening.
How the Transmission Mechanism Works
Here is the transmission mechanism in this current cycle:
- Brent crude breaches $90/barrel following Strait of Hormuz supply disruption
- Energy costs feed into producer and consumer price indices within weeks, re-accelerating headline inflation readings
- Federal Reserve policymakers interpret renewed inflation as justification for additional rate hikes
- Higher rates increase the yield on Treasury bonds and other interest-bearing assets, making the zero-yield profile of gold comparatively less attractive
- Institutional capital rotates away from gold toward fixed income, compressing demand and price
Furthermore, the gold-bond dynamics at play here reinforce why rising real yields are particularly damaging to gold in this specific macro configuration. The table below summarises how each market factor is currently affecting gold:
| Market Driver | Transmission Channel | Net Effect on Gold |
|---|---|---|
| Brent crude above $90/bbl | Feeds CPI, raises rate-hike bets | Negative |
| Strait of Hormuz disruption | Constrains oil supply globally | Negative (via stagflation risk) |
| Persistent Fed hawkishness | Raises real yields | Negative |
| U.S.-Iran military escalation | Safe-haven demand spike | Positive (short-term only) |
| Strong central bank buying | Structural demand floor | Positive (longer-term) |
The Fed's Hawkish Chorus Gets Louder
Monetary policy expectations have shifted meaningfully in a very short timeframe. According to CME FedWatch Tool data, markets are now pricing an 82% probability of a December rate hike, up from 73% just one week earlier. A nine-percentage-point move in implied rate probabilities within a single week reflects a significant change in institutional positioning, not a minor statistical adjustment.
Cleveland Fed President Beth Hammack has added her voice to a growing faction within the Federal Open Market Committee advocating for renewed rate increases. Her commentary carries weight because it signals that what was previously a minority view inside the Fed is gaining institutional traction. When multiple regional Fed presidents align publicly around the same hawkish message, it typically precedes a shift in the committee's formal guidance.
The upcoming FOMC meeting carries additional significance because it marks Chairman Kevin Warsh's second meeting leading the Federal Reserve. Market participants are watching closely for the possibility of dissenting votes, which would signal a deeper fracture within the committee on the inflation-versus-growth tradeoff. A formal dissent at this stage would be a meaningful hawkish signal for rate-sensitive assets.
When markets price an 82% probability of a Federal Reserve rate hike, institutional investors are signalling that interest-bearing assets like Treasury bonds will offer increasing yield advantages over non-yielding commodities like gold. This dynamic typically suppresses gold demand and accelerates short-term price weakness.
The opportunity cost framework helps explain why gold is particularly sensitive to this shift. Gold generates no interest, no dividends, and no coupons. Its appeal rests entirely on capital appreciation and its function as a store of value. When the risk-free rate available in U.S. Treasuries rises, every additional basis point of yield makes gold comparatively less attractive to portfolio managers optimising for risk-adjusted returns.
Current Price Action and the Technical Levels That Matter
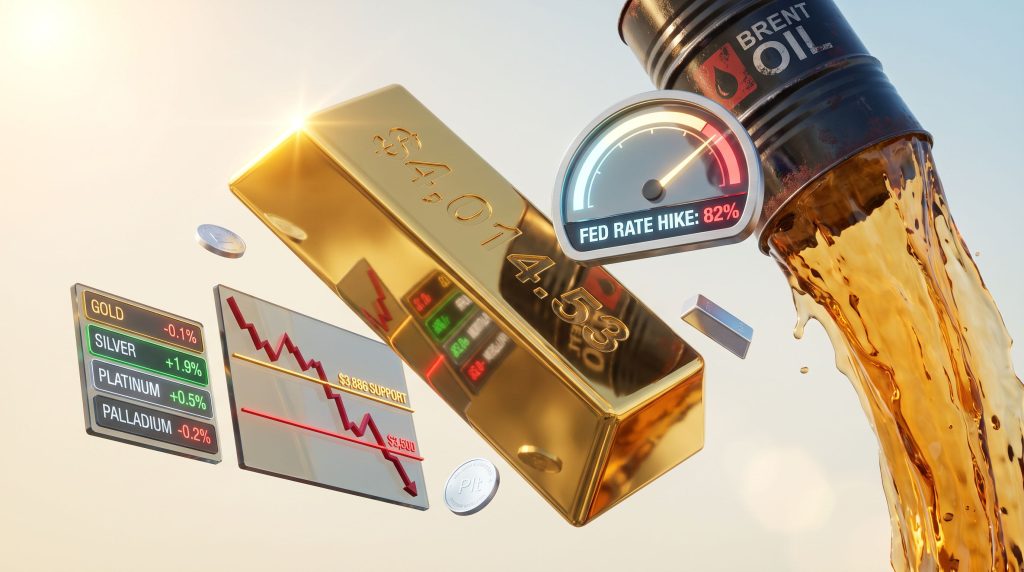
Spot gold declined 0.1% to $4,014.53 per ounce during early Asian trading, while August delivery U.S. gold futures held relatively steady at $4,019.80. The modest daily move understates the underlying tension. Gold is trading at historically elevated levels, above the psychologically important $4,000 mark, but the structural backdrop is deteriorating in ways that modest daily percentage changes do not capture.
What the $3,886 Level Means for Traders
The most important technical threshold for traders to monitor is $3,886 per ounce. A sustained break below this level could trigger algorithmic selling programmes and accelerate weakness toward the $3,500 zone, representing a potential drawdown of approximately 12.8% from current levels. In dollar-per-ounce terms, it represents a decline of over $500 from current prices.
What makes this level particularly significant is the concentration of technical analysis models pointing to it simultaneously. When widely followed support levels are breached in commodity markets, they can become self-fulfilling as momentum-driven algorithms and stop-loss orders compound the initial selling.
Silver's Outperformance Reveals a Gold-Specific Problem
One of the more analytically interesting features of the current precious metals landscape is the divergence between gold and silver. While gold slips as oil prices advance and Fed rate-hike voices grow, silver gained 1.9% to $56.95 per ounce. Platinum added 0.5% to $1,599.97, while palladium eased a marginal 0.2% to $1,244.50.
| Metal | Price | Session Change |
|---|---|---|
| Gold (Spot) | $4,014.53/oz | -0.1% |
| Silver (Spot) | $56.95/oz | +1.9% |
| Platinum | $1,599.97/oz | +0.5% |
| Palladium | $1,244.50/oz | -0.2% |
Silver's dual demand profile — spanning both monetary and industrial consumption — is not coincidental. Unlike gold, silver carries significant applications in solar panel manufacturing, electronics, and medical technology. When monetary policy headwinds suppress pure safe-haven demand for gold, silver's industrial consumption component acts as a separate demand floor that gold simply does not have.
This divergence communicates something important: the market is not experiencing a broad precious metals selloff driven by risk appetite returning. Instead, it is a gold-specific repricing rooted in monetary policy dynamics. Investors should treat this distinction as diagnostically meaningful when constructing or rebalancing precious metals allocations. Furthermore, monitoring gold-silver ratio analysis provides additional context for understanding how these divergences typically resolve over time.
The next major ASX story will hit our subscribers first
Stagflation Risk: The Scenario Gold Cannot Win
There is a less-discussed scenario that presents the most challenging environment for gold: stagflation, defined as simultaneous stagnant economic growth and persistent inflation. In this environment, the Fed faces a genuine dilemma. Raising rates aggressively to combat inflation risks tipping the economy into recession. Holding rates steady risks entrenching inflation expectations.
For gold, stagflation is uniquely problematic. The asset cannot simultaneously benefit from safe-haven demand driven by economic deterioration and inflation-hedge demand while also absorbing the headwind of rising opportunity costs. If the Fed chooses to prioritise inflation control, real yields rise and gold suffers. If the Fed pauses to protect growth, inflation expectations may spike, creating short-term gold support before the eventual growth slowdown undermines broader commodity demand.
Sustained oil prices above $90 per barrel, if maintained through Q3 and into Q4 2026, would keep this stagflation scenario firmly in play. The Strait of Hormuz remains vulnerable to further disruption, and any escalation in U.S.-Iran hostilities could push energy prices materially higher, compounding the inflationary impulse already feeding into rate expectations.
Scenario Pathways for Gold Through Q4 2026
Given the competing forces at play, investors benefit from thinking in scenarios rather than point forecasts. Consequently, considering gold as strategic investment across multiple pathways becomes especially relevant. The table below outlines three plausible trajectories:
| Scenario | Key Conditions | Gold Price Range |
|---|---|---|
| Bullish | Geopolitical escalation overrides rate concerns; Fed pauses | $4,200 to $4,400 |
| Base Case | One December rate hike; oil stabilises near $90/bbl | $3,800 to $4,050 |
| Bearish | Multiple Fed hikes; oil remains elevated; $3,886 support breaks | Toward $3,500 |
The bull case depends on conflict escalation generating safe-haven demand intense enough to override the rate-hike narrative, combined with continued central bank purchasing from emerging market institutions diversifying their reserve holdings away from U.S. dollar assets. Central bank gold demand has been a structurally significant factor in the gold market since 2022, and this buying programme provides a longer-term demand floor that speculative selling cannot easily overwhelm.
The bear case requires a Fed that delivers on its hawkish rhetoric with multiple hikes before year-end, sustained energy prices above $90 per barrel keeping inflation elevated, and a technical break below $3,886 that triggers algorithmic follow-through selling.
Key Indicators to Track in the Weeks Ahead
For investors navigating this environment, the following signals offer the most direct insight into which scenario is unfolding:
- CME FedWatch Tool rate probabilities: Any move in December hike probability above 90% would represent a significant escalation of the monetary policy headwind for gold
- Brent crude relative to $90/barrel: Sustained elevation keeps the hawkish Fed narrative alive and amplifies stagflation concerns
- $3,886 gold support level: A confirmed daily close below this threshold is the most important near-term technical signal for momentum-driven selling
- FOMC meeting rhetoric and dissent patterns: Any dissenting votes at Warsh's second meeting would signal deeper internal disagreement and validate the hawkish repricing
- Silver's relative performance: Continued silver outperformance signals a gold-specific correction rather than a broad precious metals decline, which has different portfolio implications
This article is intended for informational and educational purposes only and does not constitute financial advice. All price levels, scenario projections, and probability estimates referenced are subject to rapid change and should not be relied upon as the basis for investment decisions. Past performance and historical patterns are not reliable indicators of future outcomes.
Want to Catch the Next Major Mineral Discovery Before the Market Does?
While gold navigates competing macro forces, Discovery Alert's proprietary Discovery IQ model scans ASX announcements in real time, delivering instant alerts on significant mineral discoveries across gold, silver, and 30+ other commodities — turning complex data into actionable opportunities for investors at every level. Explore historic discoveries and their extraordinary returns to see what early positioning can mean, then begin your 14-day free trial to secure your market-leading edge.