July 19, 2026
When Corrections Reveal Character: What Gold's Selloff Says About the Broader Bull Cycle
Commodity markets have a way of testing conviction precisely when the structural case appears strongest. Gold's behaviour across the first half of 2026 fits this pattern almost textbook-perfectly. The metal climbed to levels that, just five years earlier, would have seemed implausible to most mainstream portfolio managers, then spent the following months retracing in a sustained, grinding decline that shook out speculative positions and rattled even seasoned holders. Understanding the gold price bounce after selloff dynamics requires examining what lies beneath the surface.
Yet beneath the surface of that decline, something more instructive than the price action itself was taking shape. The nature of the selling, the velocity of the recovery attempt, and the macroeconomic conditions surrounding both tell a more nuanced story than the headline drawdown number alone. Understanding that story is what separates investors who accumulate intelligently during corrections from those who capitulate at the worst possible moment.
When big ASX news breaks, our subscribers know first
Understanding What Kind of Correction This Actually Is
Not all drawdowns are created equal. A correction driven by deteriorating fundamentals, collapsing demand, or structural shifts in monetary policy tends to compound and extend. A correction driven by technical exhaustion, margin liquidation, and short-term dollar strength tends to resolve, often sharply.
Gold's retreat from its all-time intraday high of $5,586/oz on January 29, 2026, to a 2026 low of $3,955/oz on June 30, 2026, represents a drawdown of approximately -29%. That magnitude is enough to trigger serious concern, particularly among investors who entered positions near the peak. However, context transforms the picture considerably.
Several characteristics of this specific correction point toward cyclical rather than structural deterioration:
- Despite the severity of the pullback, gold remains +20.3% higher on a year-over-year basis, indicating that the primary trend has not reversed
- The decline unfolded across 10 down weeks in the last 13 trading weeks, a pattern consistent with sustained technical selling pressure rather than fundamental collapse
- The weekly parabolic Short trend reached its 18th consecutive week as of mid-July 2026, placing it among the fourth-longest bearish technical sequences recorded since January 2001
- Gold at approximately $4,023 sits neatly between its dollar-debasement fair value of $3,994 and its BEGOS Market Value of $4,152, a positioning that multiple analytical frameworks describe as neutrally to attractively valued
A correction sandwiched between two independent valuation anchors is not a correction in freefall. It is a correction finding its floor.
The frequently cited historical comparison to gold's 2011 to 2015 bear market, during which prices fell approximately -45% over four years, deserves scrutiny rather than reflexive acceptance. The structural environment surrounding gold in 2026 is materially different from 2011 in several key respects.
| Comparison Factor | 2011-2015 Bear Market | 2026 Correction (to date) |
|---|---|---|
| Peak-to-trough decline | ~-45% | ~-29% |
| Duration | ~4 years | ~6 months |
| Institutional gold awareness | Low/declining | High/embedded |
| Central bank buying | Moderate | Elevated |
| ETF demand on recovery | Declining | $4.4B+ inflow on bounce |
| Geopolitical risk environment | Moderate | Elevated |
| Inflation environment | Disinflationary | Structurally uncertain |
The investor awareness argument is particularly significant. In 2011, gold was only beginning to enter mainstream portfolio construction conversations. By 2026, central bank gold demand, inflation-hedging mandates, and ETF accessibility have made gold a far more institutionally embedded asset class. That structural depth makes a repeat of the 2011-2015 trajectory considerably less likely, though not impossible.
The Mechanics Behind a Gold Price Bounce After Selloff
How Does a Recovery Actually Develop?
Understanding how a gold price bounce after selloff actually develops — mechanically and behaviourally — helps investors evaluate whether any given recovery has genuine staying power or represents temporary short-covering that fades quickly.
Recoveries in gold following extended corrections typically progress through three recognisable phases:
Phase 1: Oversold Exhaustion
Sustained selling pushes price into deeply oversold technical territory. Short sellers begin closing positions to lock in profits, reducing sell-side pressure. Volume patterns begin transitioning from distribution to early-stage accumulation, and momentum indicators flatten before reversing.
Phase 2: Institutional Re-Entry
This is the phase where conviction capital returns. ETF inflows serve as a reliable proxy for institutional re-engagement. The recovery session in early February 2026 was accompanied by an estimated $4.4 billion in ETF inflows, a figure that distinguishes that bounce from a simple short-covering event. Furthermore, gold safe-haven dynamics played a meaningful role, as gold futures rose as much as 6.3% to $4,946.20 during the initial recovery session, signalling genuine demand behind the move. According to analysis from the Wall Street Journal, such sharp recoveries following major selloffs are consistent with historically observed precious metals patterns.
Phase 3: Fundamental Reconfirmation
The third phase involves analysts and longer-duration investors reaffirming the macro thesis. Inflation hedging, central bank demand, and dollar weakness narratives reassert their relevance. Price stabilises around valuation anchors before attempting a new base. Barclays, for instance, maintained a gold price forecast of approximately $4,791/oz following the correction, treating the drawdown as a repositioning event rather than a trend reversal.
What the BEGOS Model Reveals About Near-Term Upside
The BEGOS Market Value framework, which tracks the fair value of gold relative to its pricing relationships within the Bond, Euro, Gold, Oil, and S&P complex, provides one of the more rigorous quantitative lenses available for assessing gold's current positioning.
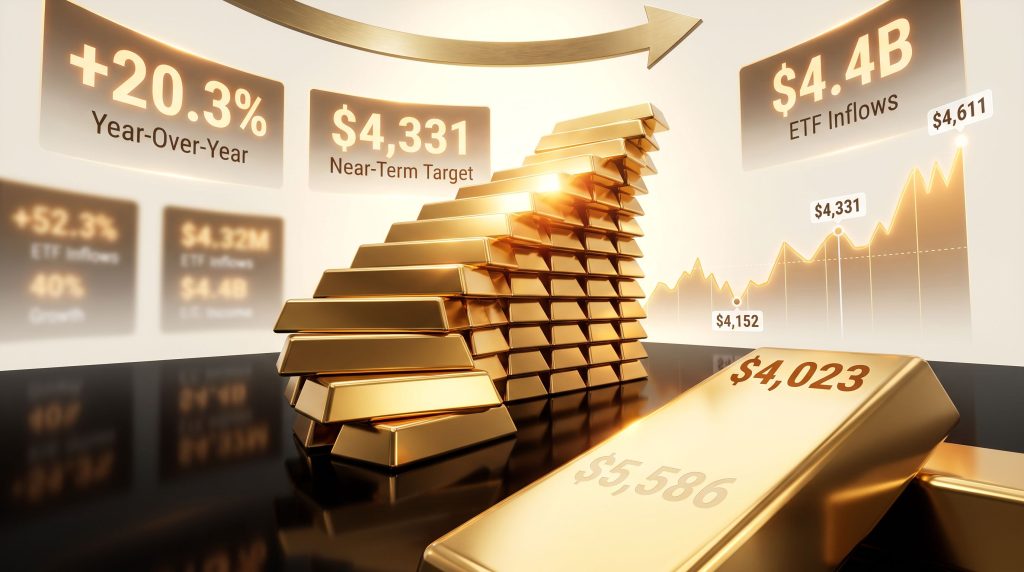
At the time of writing, gold's BEGOS Market Value sits at $4,152, while spot price trades near $4,023. This discount to model value is significant because historical analysis spanning 25 years of BEGOS data reveals a consistent pattern: when gold crosses back above its smooth BEGOS valuation line following a period of trading below it, the maximum average upside continuance has been +4.3%.
Applied to the current BEGOS Market Value of $4,152, that statistical average implies a near-term target of approximately $4,331, potentially achievable within a three-week window if the crossover occurs. The expected daily trading range of 100 points and expected weekly trading range of 244 points suggest gold has sufficient volatility to re-engage the valuation line rapidly.
| Valuation Metric | Level (USD/oz) | Interpretation |
|---|---|---|
| Current Spot Price | ~$4,023 | Within fair value band |
| BEGOS Market Value | $4,152 | Slight discount to model value |
| Fair Value (Dollar Debasement Model) | $3,994 | Spot sits just above floor |
| 300-Day Moving Average | $4,136 (rising) | Long-term trend intact |
| 10-Session VWAP | $4,082 | Near-term resistance cluster |
| Near-term BEGOS target | $4,331 | ~3-week projection |
| Parabolic Long flip level | $4,611 | Full trend reversal confirmation |
| All-Time Intraday High | $5,586 | -28% below peak |
These projections represent statistical averages across a long-term dataset, not guaranteed outcomes. Momentum-driven commodity markets frequently overshoot statistical averages in both directions, and investors should weight these figures accordingly.
The Three Macro Forces Competing for Gold's Direction
What Is Driving the Headwinds and Tailwinds?
The macroeconomic backdrop surrounding the gold price bounce after the selloff is unusually complex. Three distinct forces are simultaneously creating headwinds and tailwinds, and understanding their relative weighting matters enormously for assessing durability.
Force 1: Deflationary Data Reducing Rate-Hike Urgency
June's Consumer Price Index declined -0.4% at the retail level, while the Producer Price Index contracted -0.3% at the wholesale level. These readings reduce the probability of Federal Reserve rate hikes in the near term, which historically supports gold by lowering the opportunity cost of holding a non-yielding asset. In addition, the gold and bond dynamics at play here are worth noting — when the cost of holding gold falls, relative attractiveness rises.
Force 2: Federal Reserve Policy Paralysis
The FOMC meeting scheduled for July 29, 2026, is widely expected to produce no rate change. Compounding this, the Fed's preferred inflation gauge — the Personal Consumption Expenditures index — was not scheduled for release until the day after the meeting, leaving the committee without its most current data. A no-change outcome removes one of the more significant near-term headwinds for gold, even if it does not provide an active tailwind.
Force 3: U.S. Dollar Structural Weakness
The U.S. Dollar Index settled near 100.145 to 100.565 during mid-July 2026, its lowest reading since June 19. More significantly, this represents a -8.6% decline from the January 2025 high of 110.015. Gold and the dollar maintain a historically inverse relationship, and a dollar that has lost nearly nine percentage points from its recent peak provides meaningful structural support for a gold price recovery.
The Long-Duration Monetary Scenario That Changes Everything
Beyond near-term technical targets and macro crosscurrents sits a longer-duration scenario that frames the current correction as almost trivially small in the context of gold's potential trajectory.
The U.S. national debt currently stands at approximately $39.4 trillion. Were the Federal Reserve to accommodate the U.S. Treasury by effectively monetising this debt, the additional liquidity injection would elevate the current M2 money supply from approximately $23.3 trillion to $62.7 trillion. Even accounting for the approximately $7.6 trillion international portion that would likely flow out of the U.S. system, the domestic monetary expansion implied by this scenario would be extraordinary.
| Scenario | M2 Money Supply | Implied Gold Fair Value |
|---|---|---|
| Current baseline | $23.3 trillion | ~$3,994/oz |
| Full debt monetisation ($39.4T added) | ~$62.7 trillion | ~$10,754/oz |
| Partial monetisation (domestic only) | Intermediate expansion | Proportionally higher |
This is not a near-term trading thesis. It is a structural argument about why investors who focus exclusively on the current drawdown may be missing the larger picture. At $4,023/oz, gold priced against the backdrop of a potential monetary revaluation of this scale arguably represents early-stage positioning rather than a stretched valuation.
The next major ASX story will hit our subscribers first
Technical Roadmap: The Levels That Define the Recovery
Which Price Levels Matter Most Right Now?
For investors tracking the gold price bounce after the selloff in real time, the technical structure provides a clear hierarchy of milestones that the market must progressively clear to confirm a genuine recovery.
The Immediate Priority: Defending $4,000
Trading support per the Market Profile sits at $4,001. This psychological and technical floor must hold to prevent further deterioration. The 2026 low of $3,955 represents the last meaningful structural support before a deeper reassessment becomes necessary.
The Overhead Recovery Gauntlet
Above current price, the Market Profile identifies a series of resistance levels that any sustained bounce must work through:
- $4,035 — first near-term resistance
- $4,067 — secondary resistance
- $4,083 — volume-weighted average proximity
- $4,096 — upper near-term resistance band
- $4,152 — BEGOS Market Value crossover level
- $4,331 — projected BEGOS model near-term target
- $4,611 — the weekly parabolic price required to flip trend back to Long
The flip from parabolic Short to Long at $4,611 carries the most analytical weight as a confirmation signal. A sustained close above this level would provide the most technically robust evidence that the correction has definitively ended and that the primary bull trend has resumed.
Silver's Signal and What Copper Is Quietly Communicating
Silver's price behaviour during the correction period has mirrored gold's closely, a pattern that carries its own interpretive significance. Precious metals analysts distinguish between silver trading in its industrial metal mode — where it correlates with copper and responds to manufacturing demand cycles — and its precious metal mode, where it tracks gold and responds to monetary and macro factors. Furthermore, the gold-silver ratio analysis during this period provides additional context for understanding relative value positioning across the complex.
The tight correlation between silver and gold during this correction indicates that silver has been operating in precious metal mode throughout. This is generally considered a constructive signal for the broader complex, suggesting that macro and monetary forces rather than cyclical industrial demand are the dominant pricing drivers.
The emerging development worth watching is copper's regression trend, which rotated to positive as of mid-July 2026. If that industrial strength begins influencing silver's trajectory, it could introduce an additional demand-side catalyst that benefits both silver and, by extension, reinforces sentiment across the entire precious metals space.
Equity Overvaluation as a Secondary Catalyst for Gold
The investment case for gold's recovery does not rely solely on gold-specific factors. The S&P 500's price-to-earnings ratio stands at approximately 44.9x, a level that is roughly double to triple what traditional portfolio theory considers sustainable. Wealth manager Ted Oakley of Oxbow Partners has identified the potential for a -40% correction in U.S. equities based on this overvaluation.
A -40% decline from the S&P 500's record high of 7,620 would bring the index to approximately 4,572, a level that coincides almost precisely with the top of the index's long-term regression channel on a 53-year chart.
The portfolio implication for gold is direct: when equity markets face the prospect of severe mean-reversion, capital historically rotates toward non-correlated assets. Gold, as the most established and liquid of these assets, tends to be a primary beneficiary. This dynamic creates a scenario where gold's recovery could be amplified by equity market stress rather than suppressed by it. Market data tracking post-selloff recoveries in gold and silver supports the historical consistency of this pattern, providing an independent catalyst that operates entirely outside the gold-specific macro narrative.
Frequently Asked Questions
Why Did Gold Sell Off So Aggressively Before the Bounce?
The correction reflected a convergence of factors: U.S. dollar strengthening through late 2025 and early 2026, a hawkish Federal Reserve posture, margin calls forcing portfolio liquidation, and technical selling cascading once key support levels were breached. Gold had run significantly ahead of its valuation anchors in the period leading up to the January 2026 high, making a reversion mathematically inevitable once momentum shifted.
Is a Gold Price Bounce After a Selloff Typically Durable?
Bounces supported by meaningful institutional ETF inflows, a weakening dollar, and stable-to-declining interest rate expectations tend to have considerably greater durability than rallies driven purely by technical short-covering. The recovery in early February 2026, accompanied by an estimated $4.4 billion in ETF inflows, exhibited characteristics consistent with the former category.
What Price Level Would Confirm Full Technical Recovery?
The most analytically significant confirmation level is $4,611/oz, the price at which gold's weekly parabolic trend would flip from Short to Long. A sustained close above this level would signal that the correction has definitively ended. The near-term BEGOS model target of approximately $4,331 represents an important intermediate milestone on the way to that confirmation.
How Does Dollar Weakness Affect the Recovery Outlook?
Gold and the U.S. dollar maintain a well-documented inverse relationship across market cycles. With the DXY approximately -8.6% below its January 2025 peak, the currency environment is broadly supportive of gold's recovery trajectory, provided that dollar weakness persists or deepens.
Key Takeaways at a Glance
| Theme | Key Data Point | Implication |
|---|---|---|
| Correction magnitude | -29% from all-time high | Severe but within historical range |
| Year-over-year performance | +20.3% | Bull trend structurally intact |
| Current valuation positioning | Between $3,994 and $4,152 | Neutrally to attractively priced |
| Near-term BEGOS target | ~$4,331 | Achievable within ~3 weeks |
| Full trend reversal level | $4,611 (parabolic Long flip) | Key confirmation milestone |
| ETF demand on bounce | $4.4B inflows | Institutional conviction present |
| Dollar environment | DXY -8.6% from 2025 high | Supportive macro backdrop |
| Fed policy outlook | No rate change expected July 29 | Key near-term headwind removed |
| Equity market risk | S&P P/E at 44.9x | Potential capital rotation catalyst |
| Long-term monetary scenario | Implied fair value up to $10,754 | Structural bull case intact |
The gold price bounce after the selloff carries more analytical depth than a simple technical rebound. When valuation models converge near current price levels, institutional demand resurfaces on the dip, monetary scenarios imply multiples of current pricing, and equities face their own structural vulnerabilities, the conditions for a durable recovery are meaningfully stronger than they might appear from the headline drawdown number alone. Whether that recovery validates itself technically at $4,611 remains the market's verdict to deliver.
This article is for informational purposes only and does not constitute financial advice. All price projections, valuation models, and scenario analyses represent analytical frameworks and historical statistical averages, not guaranteed outcomes. Commodity markets are volatile, and past performance is not indicative of future results. Readers should conduct their own due diligence before making any investment decisions.
Want to Catch the Next Major Mineral Discovery Before the Market Does?
While gold's correction and recovery dynamics reveal the rewards of staying ahead of macro trends, Discovery Alert's proprietary Discovery IQ model delivers real-time ASX mineral discovery alerts — transforming complex data across 30+ commodities into clear, actionable opportunities for both short-term traders and long-term investors. Explore historic discoveries and their remarkable returns, then begin your 14-day free trial to position yourself at the forefront of the next significant ASX find.