
June 18, 2026
What Is the Gold to Oil Ratio and Why Does It Matter for Investors?
Cross-commodity valuation metrics have emerged as critical indicators for understanding global economic conditions, with the gold to oil ratio standing as perhaps the most revealing. This fundamental calculation divides gold prices per troy ounce by crude oil prices per barrel, creating a unitless measurement that reveals profound insights about market psychology, monetary policy effectiveness, and economic transition phases.
Defining the Cross-Commodity Valuation Metric
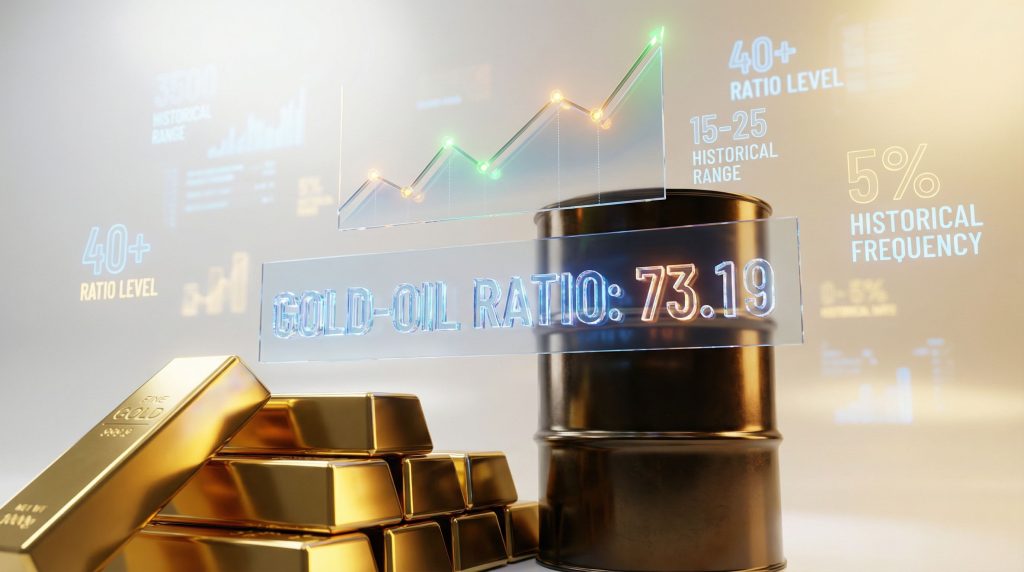
The mathematical construction appears deceptively simple: gold price (USD per troy ounce) divided by oil price (USD per barrel). However, the December 2024 reading of approximately 73.19 represents an extraordinary extreme that has captured the attention of institutional strategists and risk managers globally. According to Bloomberg Intelligence analysis, this ratio reflects gold trading near record levels around $2,600 per ounce whilst WTI crude oil languishes around $70 per barrel.
Historical context spanning eight decades reveals this current reading sits far outside normal ranges. During stable growth periods of the 1990s-2000s, the gold to oil ratio typically oscillated between 10-15. Crisis periods, such as the 2008 financial collapse, pushed readings toward 25-40. The current extreme suggests unprecedented market dislocation.
Table: Gold-to-Oil Ratio Historical Ranges by Economic Period
| Period | Average Ratio | Economic Context | Primary Drivers |
|---|---|---|---|
| 1950s-1960s | 12-15 | Post-war expansion | Bretton Woods monetary stability |
| 1970s-1980s | 15-25 | Energy crises, stagflation | Oil supply shocks, monetary uncertainty |
| 1990s-2000s | 10-18 | Globalisation era | Technology productivity gains |
| 2010s | 20-30 | Post-financial crisis | Quantitative easing expansion |
| 2020s | 35-73+ | Pandemic/recovery cycle | Supply chain disruptions, energy transition |
Economic Significance Beyond Simple Price Comparison
The ratio functions as a sophisticated barometer for distinguishing between inflationary versus deflationary economic conditions. Mike McLoughlin, Senior Commodity Strategist at Bloomberg Intelligence, emphasises that high gold-to-oil readings do not necessarily indicate inflation concerns contrary to consensus narrative. Instead, extreme readings warn of deflationary pressures similar to those observed in China's current economic cycle and Japan's historical experience during the 1990s.
China's 10-year government bond yield stood at 1.84% as of December 2024, compared to 4.17% for equivalent U.S. treasuries. This 233 basis point spread illustrates divergent monetary policy trajectories and embedded growth expectations that the gold to oil ratio effectively captures.
Furthermore, the metric serves three primary analytical functions:
• Macro-economic health indicator for global growth expectations through energy demand proxies
• Risk sentiment measurement tool via precious metals safe-haven demand patterns
• Central bank monetary policy effectiveness gauge through commodity price transmission mechanisms
When big ASX news breaks, our subscribers know first
How Extreme Market Conditions Drive Gold-Oil Divergence
Supply-Side Dynamics Creating Current Distortions
The fundamental transformation of global energy markets has created structural pressures that traditional models struggle to interpret. The United States achieved net oil exporter status around 2018-2019, reversing decades of import dependence that shaped geopolitical relationships and commodity pricing mechanisms.
U.S. crude oil production reached approximately 13.2 million barrels per day in 2024, representing the highest levels in American history according to Energy Information Administration data. This production surge, driven primarily by unconventional shale extraction techniques, represents approximately 65-70% of total domestic output. The technological revolution in hydraulic fracturing and horizontal drilling fundamentally altered marginal production costs, creating what industry analysts describe as a "ceiling effect" on global oil prices.
Consequently, these developments directly influence oil price movements and contribute to the unprecedented market dynamics we observe today.
Key Supply-Side Transformations:
• Shale production dominance: Permian Basin and Eagle Ford formations contributing over 8 million barrels daily
• Reduced marginal costs: Break-even prices declining to $30-40 per barrel range in prime acreage
• Export capacity expansion: U.S. net exports reaching 3-4 million barrels daily (crude and refined products)
• OPEC+ influence limitation: Production cuts of 2.2 million barrels daily failing to support sustained price recovery
Central bank gold accumulation patterns have intensified during the same period. World Gold Council data indicates H1 2024 central bank purchases reached 484 tonnes, establishing a new record for first-half acquisition volumes. China leads this accumulation with estimated reserves of 2,135 tonnes, while India maintains approximately 846 tonnes in official holdings.
Demand-Side Structural Shifts
Electric vehicle proliferation represents perhaps the most significant long-term demand destruction mechanism facing crude oil markets. Global EV sales reached approximately 18% of total automotive purchases in 2024, with China achieving 35-40% penetration rates in new vehicle categories.
International Energy Agency projections suggest EV adoption could represent 50% of new car sales by 2035 under current policy trajectories. Each 10% increase in EV penetration correlates with approximately 1 million barrels daily of oil demand destruction, though regional variations create complex forecasting challenges.
Gold demand structure reveals fundamentally different dynamics. Unlike crude oil's industrial consumption profile, gold maintains limited manufacturing applications – approximately 8-10% of total demand. In addition, the remaining 90% consists of monetary reserves (central banks), jewellery and personal adornment (45-50%), and investment/store-of-value holdings.
"Technical Alert: The current 12-month gold-oil correlation coefficient registers -0.79, indicating strong inverse relationship patterns during market volatility periods. This suggests fundamental decoupling from traditional energy-metals price relationships that have persisted for decades."
What Does a High Gold-to-Oil Ratio Signal About Economic Conditions?
Deflationary Pressure Indicators
Extreme gold-to-oil ratio readings historically coincide with periods of economic uncertainty characterised by simultaneous flight-to-safety capital flows and industrial demand weakness. The current environment exhibits both conditions simultaneously, creating what Bloomberg Intelligence analysis describes as unprecedented market dislocation.
Oil demand weakness reflects broader economic slowdown concerns embedded in forward-looking industrial activity. The commodity's price decline of approximately 20% during 2024, despite ongoing geopolitical tensions including the Russia-Ukraine conflict, suggests structural rather than cyclical pressures.
McLoughlin's analysis draws parallels to Japan's deflationary experience during the 1990s, when the Nikkei index declined from approximately 40,000 to 10,000 over an extended period. However, similar patterns emerged in China's recent economic cycle, where massive fiscal and monetary stimulus failed to generate sustained inflation despite money supply expansion.
This environment intersects with broader commodity market volatility that continues to challenge traditional investment approaches.
Current Deflationary Signals:
• Energy sector capital allocation: Shifts toward renewable energy investments reducing long-term oil infrastructure spending
• Industrial metals weakness: Copper and other base metals declining alongside energy commodities
• Credit market stress: Manifesting through commodity price divergence and correlation breakdowns
• Currency debasement fears: Driving alternative store-of-value demand patterns
Monetary Policy Transmission Mechanisms
Federal Reserve policy expectations embedded in precious metals pricing reveal market scepticism regarding traditional monetary transmission mechanisms. Despite Fed funds rates reaching 4.25-4.50% following December 2024 FOMC meetings, gold prices maintained elevated levels near historical peaks.
Market pricing suggests investors anticipate approximately 100 basis points of additional rate cuts throughout 2025, reflecting concerns about economic growth sustainability rather than inflation control requirements. This expectation structure contradicts typical relationships where higher real interest rates pressure non-yielding assets like gold.
These dynamics reflect broader US economic trends that continue to influence global financial markets and commodity pricing mechanisms.
Table: Federal Reserve Policy Impact on Gold-Oil Dynamics
| Policy Phase | Typical Gold Response | Typical Oil Response | Ratio Implication |
|---|---|---|---|
| Rate Hiking Cycle | Negative pressure | Mixed (demand vs. dollar) | Ratio compression |
| Rate Cutting Cycle | Positive support | Positive (growth expectations) | Ratio expansion |
| QE Implementation | Strong positive | Variable | Significant expansion |
| QT Implementation | Negative pressure | Negative (liquidity drain) | Variable direction |
How to Interpret Current Market Extremes for Investment Strategy
Mean Reversion Probability Analysis
Statistical analysis of historical gold-to-oil ratio extremes provides quantitative frameworks for understanding potential resolution pathways. Readings above 40 have historically persisted for 3-9 months before normalising toward long-term ranges of 15-25.
Bloomberg Intelligence models suggest current extremes typically resolve through one of three mechanisms:
• Gold price correction: Historical precedent indicates 20-30% declines during mean reversion phases
• Oil price recovery: Structural oversupply conditions could reverse, generating 40-60% price increases
• Combination movements: Simultaneous but asymmetric price adjustments in both commodities
The 1979-1980 precedent offers instructive historical context. Gold surged from approximately $300 to nearly $850 per ounce during that period, then remained suppressed around $300 levels for approximately 25 years until 2005. This illustrates the potential severity of mean-reversion corrections when precious metals reach extreme valuations relative to other commodities.
Sector Rotation Implications
Energy equity valuations relative to commodity price fundamentals have created potential value opportunities for contrarian investors. Integrated oil companies maintain dividend sustainability despite suppressed crude prices, supported by operational efficiency improvements and capital discipline programmes.
Precious metals mining companies exhibit operational leverage to underlying gold price movements, though extreme ratio readings historically coincide with sector valuation peaks rather than optimal entry points. Mining equity performance often diverges from bullion prices during market stress periods due to funding costs and operational complexity factors.
For instance, understanding trade war impact on markets becomes crucial for investors positioning themselves during these extreme conditions.
Investment Strategy Performance During Ratio Extremes
| Strategy Type | High Ratio Environment | Low Ratio Environment | Risk Profile |
|---|---|---|---|
| Long Gold/Short Oil | +15% to +25% | -10% to -20% | High volatility |
| Energy Contrarian | +20% to +40% | -5% to -15% | Moderate risk |
| Precious Metals Mean Reversion | -5% to +10% | +10% to +20% | Low-moderate risk |
| Treasury Duration Extension | +5% to +15% | -3% to -8% | Low risk |
Which Assets Benefit During Gold-Oil Ratio Extremes?
Direct Commodity Exposure Strategies
Physical gold allocation considerations during ratio peaks require careful risk-reward analysis. McLoughlin's technical framework suggests gold's current positioning approximately 85% above its 60-month moving average represents the most extreme stretch in nearly 40 years. This statistical abnormality coincides with stock market volatility measures reaching multi-year lows, creating what he describes as an unprecedented divergence pattern.
Oil futures positioning for mean reversion opportunities faces structural headwinds from U.S. production abundance and technological efficiency improvements. The commodity's autocorrelation characteristics – commodities decline because they previously rose excessively – create momentum-driven downtrends that can persist longer than fundamental analysis suggests.
Commodity ETF selection criteria for cross-ratio strategies must account for contango and backwardation effects in futures curves. Energy-focused ETFs like XLE provide equity exposure to sector fundamentals whilst avoiding direct commodity storage costs and rollover complexities.
Equity Sector Positioning
Energy company valuation metrics during oil price suppression periods historically generate attractive risk-adjusted returns for patient capital. Integrated oil majors maintain competitive advantages through:
• Downstream refining margins: Often increase during crude price declines
• Capital allocation flexibility: Dividend sustainability through commodity cycles
• Technological efficiency gains: Reducing marginal production costs annually
• Geographic diversification: Exposure to multiple basin economics and regulatory environments
Gold mining operational leverage to price movements creates amplified returns during precious metals bull markets, but extreme ratio readings often coincide with sector peaks rather than optimal accumulation phases. Companies with lower all-in sustaining costs (AISC) maintain competitive advantages during potential price corrections.
When Should Investors Expect Ratio Normalisation?
Technical Reversion Signals
Moving average convergence patterns provide mechanical frameworks for identifying potential inflection points. McLoughlin's analysis focuses on 60-month moving averages as five-year trend indicators, noting that current gold positioning represents unprecedented deviation from these long-term benchmarks.
Volume-based confirmation indicators require monitoring institutional flow patterns rather than retail sentiment measures. Central bank gold accumulation trends and sovereign wealth fund commodity allocation adjustments often precede major trend reversals by several quarters.
Cross-asset correlation restoration timing depends on broader financial market stress levels. The current environment features gold-oil correlation coefficients at -0.79, far outside normal ranges of -0.3 to +0.3. Historical precedent suggests these extreme correlations normalise during economic transition phases rather than maintaining indefinitely.
Fundamental Catalyst Requirements
Global economic growth acceleration markers include:
• Manufacturing PMI recovery: Particularly in China and European Union regions
• Energy demand confirmation: Transportation fuel consumption and industrial electricity usage
• Credit expansion resumption: Bank lending growth and corporate bond issuance activity
• Employment market normalisation: Unemployment rates approaching 6% trigger historical recession probabilities
Central bank policy pivot indicators extend beyond Federal Reserve actions to include coordinated global monetary responses. China's current 10-year yield at 1.84% reflects domestic deflationary pressures that require resolution before global commodity demand recovery.
"Risk Management Note: Historical data indicates ratios above 50 typically resolve within 6-12 months through either gold price corrections (-20% to -30%) or oil price recoveries (+40% to +60%). Current positioning at 73+ suggests active monitoring requirements for portfolio risk management."
The next major ASX story will hit our subscribers first
How Global Economic Cycles Influence Long-Term Ratio Trends
Structural Economic Transitions
The energy transition's impact on oil demand fundamentals creates secular rather than cyclical pressure on traditional commodity relationships. According to the International Energy Agency, global oil demand could peak within the current decade, fundamentally altering the gold to oil ratio's historical mean-reversion assumptions.
Digital economy effects on gold industrial usage remain minimal given the metal's limited technological applications. However, central bank digital currency (CBDC) implications for gold demand present complex dynamics as monetary authorities balance digital innovation with physical reserve requirements.
Geopolitical realignment affecting commodity trade flows has intensified since Russia's invasion of Ukraine. Energy security considerations now influence policy decisions independently of pure economic optimisation, potentially creating persistent rather than temporary market distortions.
Monetary System Evolution
Reserve currency diversification trends reflect declining confidence in dollar-centric financial architecture. China's gold accumulation patterns and Russia's pre-sanction buying programmes illustrate central bank portfolio rebalancing away from traditional Treasury holdings.
Inflation targeting regime effectiveness faces challenges from supply chain complexity and deglobalisation trends. Central banks designed policies for demand-driven inflation may prove inadequate for addressing supply-side price pressures and commodity market volatility.
The Federal Reserve's dual mandate conflicts become apparent during periods of high asset prices and economic uncertainty. Supporting financial markets through rate cuts whilst maintaining price stability creates policy contradictions that commodity markets often identify before equity markets.
What Investment Frameworks Work Best for Ratio-Based Strategies?
Quantitative Approach Methodologies
Statistical arbitrage model construction requires sophisticated understanding of commodity correlation structures and volatility patterns. Standard deviation measurements from various moving average periods (200-day to 60-month) provide quantitative frameworks for identifying extreme positioning.
Risk-adjusted return optimisation techniques must account for autocorrelation effects in commodity markets. McLoughlin's observation that "commodities go down because they went up" reflects mean-reversion tendencies that traditional Sharpe ratio calculations may not capture adequately.
Portfolio hedging applications using ratio signals involve dynamic allocation adjustments rather than static positions. Treasury duration extension during extreme ratio periods has historically provided defensive positioning whilst maintaining return potential.
Fundamental Analysis Integration
Macro-economic indicator correlation studies reveal leading versus lagging relationships between commodity prices and economic data. Employment market normalisation often requires 12-18 months following commodity market corrections, suggesting patience requirements for fundamental-based strategies.
Supply-demand balance forecasting methods must incorporate technological disruption and policy intervention effects. Traditional oil demand models may underestimate EV adoption impact and overestimate economic growth correlations.
Policy response scenario modelling becomes critical during extreme market conditions. Central bank coordination and fiscal policy timing can accelerate or delay natural market correction processes.
Quantitative Framework for Ratio Analysis
| Measurement Period | Current Reading | Historical Average | Action Threshold |
|---|---|---|---|
| 60-Month Moving Average | 85% above | 15-25 range | >60% = Caution |
| 200-Day Moving Average | 45% above | 20-30 range | >40% = Risk Reduction |
| Standard Deviation | 3+ sigma | 1 sigma norm | >2.5 sigma = Extreme |
| Correlation Coefficient | -0.79 | -0.3 to +0.3 | <-0.6 = Abnormal |
Why Current Market Structure May Prolong Ratio Extremes
Algorithmic Trading Impact
High-frequency trading systems and systematic commodity trading advisors (CTAs) can amplify trend momentum beyond fundamental justification levels. These algorithmic strategies often utilise similar technical indicators and correlation models, creating synchronised buying or selling pressure during extreme market conditions.
Modern market microstructure differs significantly from historical periods when the gold to oil ratio established its typical ranges. Electronic trading platforms and derivative instrument proliferation enable position sizes and leverage that can sustain abnormal price relationships for extended periods.
Liquidity provision changes in commodity markets reflect regulatory modifications following the 2008 financial crisis. Bank proprietary trading restrictions and increased capital requirements have reduced market-making capacity during stress periods, potentially prolonging rather than dampening extreme price movements.
Institutional Allocation Shifts
Pension fund commodity exposure modifications reflect liability-driven investment strategies that prioritise duration matching over absolute return optimisation. These structural allocation changes create persistent rather than cyclical demand patterns for specific asset classes.
Sovereign wealth fund strategic positioning increasingly incorporates geopolitical considerations alongside financial metrics. Resource-rich nations may maintain commodity exposure despite poor historical performance to hedge domestic economic risks.
Insurance company asset-liability matching adjustments respond to regulatory capital requirements and actuarial assumptions rather than market timing considerations. These institutional flows can support asset prices during periods when traditional valuation metrics suggest overvaluation.
The interaction between passive index investment growth and active commodity trading strategies has created structural market dynamics that historical ratio analysis may not adequately capture. Exchange-traded fund flows and institutional rebalancing requirements can overwhelm traditional supply-demand fundamentals during specific calendar periods.
Furthermore, investors can utilise historical chart data to better understand these long-term patterns and develop more robust investment strategies.
Disclaimer: This analysis is based on historical data and market observations available as of December 2024. Commodity markets involve substantial risk and may not be suitable for all investors. Past performance does not guarantee future results. Economic forecasts and market predictions are speculative and subject to significant uncertainty. Readers should consult qualified financial advisors before making investment decisions based on this information.
Looking to Capitalise on Extreme Market Conditions in Commodities?
Discovery Alert's proprietary Discovery IQ model delivers real-time alerts on significant ASX mineral discoveries, turning complex market data into actionable insights during periods of unprecedented commodity price divergence. Begin your 30-day free trial today to position yourself ahead of market-moving announcements as global economic conditions continue to drive extraordinary opportunities in the resource sector.