July 10, 2026
Why Gold Rarely Moves the Way Most Investors Expect
Every few years, a new generation of investors encounters gold for the first time during a period of price volatility and reaches for the nearest explanation: inflation, war, the dollar, central banks. These explanations are not wrong, but they are incomplete. They describe individual instruments within a far more complex orchestral system, one where multiple rhythms operate simultaneously across radically different time horizons.
Gold price cycles are not a single pattern. They are a layered architecture of overlapping forces, each governed by distinct economic mechanisms and each producing its own characteristic signature in the price. An investor tracking only one of these layers is navigating with a partial map. Understanding all four, combined with three quantitative valuation models, produces something significantly more powerful: a structural positioning framework capable of distinguishing a mid-cycle correction from a genuine cycle ending.
As of mid-2026, with gold trading near $4,100 per ounce after pulling back from its January 28, 2026 intraday peak of $5,589 per ounce, the practical relevance of this framework could not be higher.
Disclaimer: This article is for informational and educational purposes only and does not constitute financial or investment advice. All references to historical performance and quantitative models are provided for analytical context. Always consult a qualified financial adviser before making investment decisions.
When big ASX news breaks, our subscribers know first
The Four-Layer Architecture of Gold Price Cycles
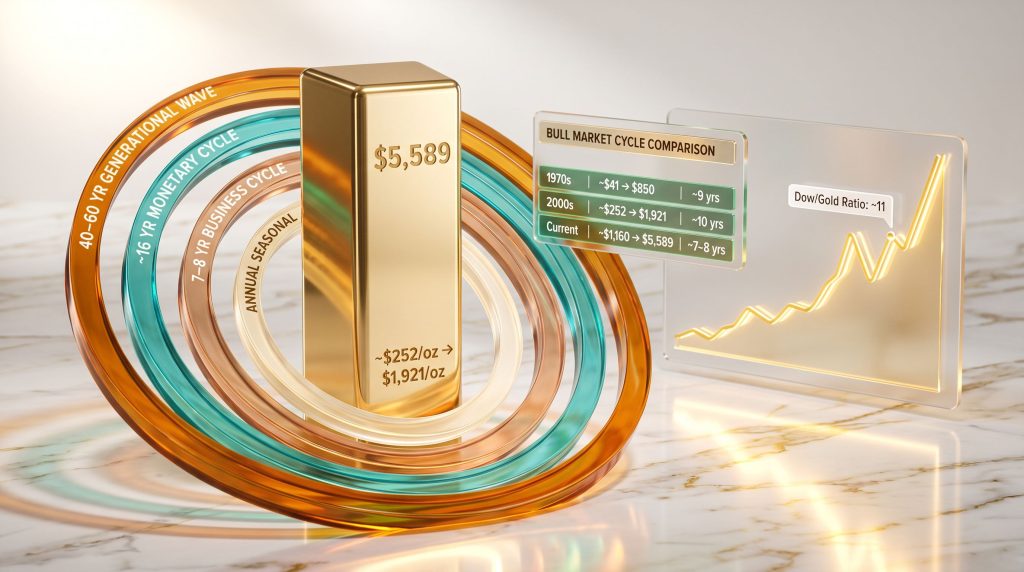
Before examining each cycle in depth, it helps to see the complete system in a single view. Gold price cycles operate across four simultaneous time horizons, each with its own driver and practical application.
| Cycle Type | Approximate Duration | Primary Driver | Practical Application |
|---|---|---|---|
| Generational Structural Wave | 40-60 years | Hard vs. paper asset rotation | Long-run allocation framework |
| Monetary Expansion Cycle | ~16 years | Real interest rate environment | Medium-term directional positioning |
| Business and Credit Cycle | 7-8 years | Corporate debt, growth phases | Counter-cyclical positioning |
| Annual Seasonal Pattern | 12 months | Physical demand calendars | Tactical entry timing |
The most common investor error is not misreading one of these cycles. It is misidentifying which cycle is producing the price movement being observed. A tactical seasonal pullback viewed through a generational lens looks like a buying opportunity. A genuine structural reversal viewed through a seasonal lens looks like a buying opportunity that never recovers. The distinction matters enormously.
The Generational Cycle: 40-60 Year Waves and the Dow/Gold Ratio
How Long-Wave Economic Theory Connects to Gold
The broadest gold price cycle operates across multiple decades. Research published in Resources Policy in 2019 by Marañon and Kumral examined metal commodity prices from 1900 to 2017 and identified meaningful synchronisation between gold and the long-wave economic rhythms first described by Russian economist Nikolai Kondratiev in the 1920s. These generational arcs, spanning roughly 40 to 60 years, alternate between periods of financial asset dominance and periods of hard asset outperformance.
The underlying mechanism is intuitive. As paper monetary systems accumulate structural stress over decades, trust in fiat instruments erodes gradually, and capital progressively migrates toward assets with fixed supply and no counterparty risk. Gold, with an annual mine supply growth rate of roughly 1-2% and a total above-ground stock of approximately 212,000 tonnes, satisfies both conditions in a way no paper instrument can replicate. For investors assessing gold as a safe haven, this structural characteristic is central to the long-term case.
Reading the Dow/Gold Ratio as a Generational Compass
The practical instrument for tracking the generational cycle is the Dow/Gold ratio, which divides the price of the Dow Jones Industrial Average by the price of one ounce of gold. The resulting dimensionless number answers a deceptively simple question: how many ounces of gold does it currently take to purchase the entire Dow? At generational extremes, that ratio signals where in the cycle the transition between financial and hard assets stands. (MacroTrends)
Historical cycle extremes provide the calibration points:
- February 1933: ratio reached 1.94, a generational low marking maximum hard asset preference during the Great Depression
- January 1980: ratio fell to 1.29, the lowest recorded reading, coinciding with gold's inflationary 1970s bull market peak
- 1999: ratio reached approximately 44 during the dot-com equity boom, signalling maximum equity overvaluation relative to gold immediately before gold's 2001-2011 bull market began
- 2019: ratio stood near 20, still signalling financial asset dominance
- Mid-2026: ratio sits near approximately 11, below the long-run average of approximately 15
Structural Signal: A Dow/Gold ratio of 11 confirms that the rotation toward hard assets is active and has been underway for nearly a decade. However, historical cycle endings have occurred at readings between 1.3 and 6.7, indicating substantial structural runway remains before this generational move exhausts itself.
The ratio does not predict a specific price target or timeline. What it does with precision is confirm the direction of generational momentum. Right now, that momentum has been moving in one direction for the better part of a decade.
The 16-Year Monetary Cycle: Real Interest Rates as Gold's Master Variable
The Mechanism Behind Gold's Medium-Term Direction
Below the generational cycle operates a medium-term monetary rhythm of approximately 16 years, governed primarily by the real interest rate environment. The relationship between real yields and gold carries a correlation coefficient of approximately -0.82, according to LongtermTrends data, meaning that when inflation-adjusted bond yields fall, gold reliably advances, and when real yields rise durably, gold faces sustained headwinds.
The logic is mechanically clean. Gold generates no income. When a risk-free government bond delivers a positive real return of, say, 2.5% after inflation, the opportunity cost of holding a zero-yield metal is measurable and significant. Furthermore, when that same bond is losing purchasing power after inflation, gold's absence of income becomes structurally irrelevant. The gold-bond relationship is, consequently, one of the most reliable structural signals available to long-term investors.
The Historical Expression of This Cycle
The 20th century provides two complete cycles for study:
The 1970s Bull Market to the 1999 Trough:
- Gold's January 1980 peak at $850/oz was followed by a 19-year structural decline driven by the Volcker-era real rate shock
- The cycle low at approximately $252/oz in July 1999 became known as Brown's Bottom, following the UK Treasury's sale of approximately 395 tonnes near the absolute cycle low, widely regarded as one of the worst-timed institutional transactions in financial history
- That trough set the stage for the 2001-2011 structural bull market
The 2001-2011 Bull Market:
- From the structural low near $252/oz, gold advanced to approximately $1,921/oz by September 2011
- Duration: approximately 10 years, consistent with the 9-10 year average duration of modern gold bull markets
The Current Cycle (2018-Present):
| Bull Market | Start Price | Peak Price (Intraday) | Duration at Peak | Peak Year |
|---|---|---|---|---|
| 1970s Cycle | ~$41/oz (1971) | $850/oz | ~9 years | January 1980 |
| 2001-2011 Cycle | ~$252/oz (1999) | ~$1,921/oz | ~10 years | September 2011 |
| Current Cycle | ~$1,160/oz (2018) | $5,589/oz | ~7-8 years | January 2026 |
The current cycle originated near $1,160/oz in late 2018. At roughly 7-8 years of age, it is younger than either of its two modern predecessors when those cycles concluded. Historical mid-cycle corrections within ongoing bull markets have ranged from approximately 15% to 47%. The current pullback of roughly 27% from the January 2026 intraday high falls squarely within that historical band. (Federal Reserve; World Gold Council)
The Business Cycle Layer: Counter-Cyclical Positioning
How the 7-8 Year Credit Cycle Shapes Gold Flows
Gold operates counter-cyclically within the standard business and credit cycle. During phases of robust expansion, rising corporate earnings, strong equity returns, and positive real yields create headwinds for a non-income-generating asset. As the credit cycle matures, corporate debt accumulates, growth decelerates, and recession risk increases, at which point gold's counter-cyclical properties become progressively more attractive to institutional allocators.
The 12-month rolling correlation between real yields and gold prices averaged approximately -0.73 between 2003 and 2022 (LongtermTrends). That relationship held with reasonable consistency until a significant structural shift emerged from 2022 onward.
The 2022-2026 Decoupling: When Sovereign Buyers Replaced Institutional Sellers
During the 2022-2023 Federal Reserve rate-hiking cycle, a pattern that had historically pushed gold lower during tightening phases failed to materialise at the expected magnitude. The explanation lies in a transformation of the marginal buyer. Institutional ETF outflows, which would ordinarily have depressed prices during rate hikes, were absorbed by sovereign central bank gold demand at an unprecedented scale.
Central banks operate under a fundamentally different decision framework than private investors. Opportunity cost logic, the comparison between gold's zero yield and bond yields, does not govern sovereign reserve management. Instead, central banks respond to reserve diversification imperatives, geopolitical hedging requirements, and long-term monetary architecture decisions, particularly the lesson drawn from the freezing of Russian foreign exchange reserves in 2022, which demonstrated that gold held domestically carries no counterparty risk whatsoever.
The Scale of Sovereign Demand
| Year | Official Sector Gold Purchases |
|---|---|
| 2010-2021 Average | 473 tonnes/year |
| 2022 | 1,000+ tonnes |
| 2023 | 1,000+ tonnes |
| 2024 | 1,000+ tonnes |
| 2025 | 863 tonnes |
| Q1 2026 | 244 tonnes (quarter) |
Source: World Gold Council, Gold Demand Trends Q1 2026
The World Gold Council's 2026 central bank survey drew a record 76 institutional responses. Significantly, 45% of participating institutions indicated plans to expand gold reserves over the coming year, the highest proportion ever recorded in the survey's history. Even as the annual pace moderated from the 2022-2024 peak, Q1 2026 purchases of 244 tonnes exceeded both the prior quarter and the five-year quarterly average, confirming that the structural bid remains active.
The Presidential Election Cycle: A Secondary Political Rhythm
Four-Year Fiscal Patterns in Gold Performance
A secondary, politically driven cycle produces measurable variation in gold's performance across the four-year US presidential election sequence. Analysis of historical returns across this cycle reveals a consistent performance gradient: (Interactive Brokers / Seasonax)
| Cycle Year | Average Gold Return |
|---|---|
| Election Year | +3.47% |
| Post-Election Year | +5.11% |
| Primary Election Year | +9.68% |
| Midterm Year | +12.59% |
The mechanism connects to fiscal policy uncertainty resolution. Election years are characterised by policy ambiguity as markets assess competing fiscal agendas. Once that ambiguity clears and the deficit implications of the incoming administration's programme become visible, capital repositions with greater conviction, and historically that process has frequently been directionally positive for gold.
2026 is a midterm election year, placing the current calendar period in the historically strongest quadrant of the four-year political cycle. That said, the presidential election cycle carries the weakest predictive reliability of the four gold cycle layers. It provides a marginal directional signal, not a primary structural one, and should be weighted accordingly within any multi-framework analysis.
The next major ASX story will hit our subscribers first
The Annual Seasonal Cycle: Gold's Most Tactically Actionable Pattern
What 50 Years of Monthly Data Reveals
The most tactically useful of the four gold price cycles is the annual seasonal pattern. Physical gold demand follows predictable cultural and institutional calendars, producing consistent monthly performance patterns that have persisted across both 20-year and 50-year study periods. Approximately 50% of annual gold mine production flows into jewellery manufacturing, making festival and cultural demand calendars structurally significant price inputs. (Seasonax)
| Month | Average Return (50-Year) | Seasonal Characterisation |
|---|---|---|
| January | +1.8% | Strong, Chinese New Year pre-buying |
| March | -0.6% | Weakest month |
| April | -0.3% | Secondary weakness |
| June | -0.4% | Summer demand trough |
| September | +2.1% | Strongest month, Indian festival season |
| November | +1.4% | Year-end investment flows |
Source: Seasonax, 50-year gold seasonal analysis
June registers the lowest positive-close rate in gold's calendar, with gold finishing the month in positive territory only approximately 40% of the time over a 25-year study period (Discovery Alert). July and August mark the seasonal inflection, with positive-close rates rising to 60-65%, as jewellery manufacturers begin building inventory ahead of autumn festival seasons in India and China.
The primary seasonal bull window, August through February, is structurally driven by three overlapping demand cycles:
- Indian wedding and Diwali season physical buying (September to November)
- Chinese New Year jewellery and gift purchasing (December to February)
- Year-end institutional investment rebalancing (November to December)
Tactical Implication: Early July sits at the statistical annual trough for gold prices. The transition from the weakest seasonal window to the strongest six-month stretch of the calendar year occurs within the current period, a configuration that has historically provided the most favourable short-to-medium-term entry window for buyers with multi-month horizons.
Three Quantitative Models for Measuring Cycle Position
The Real Yield Model
The Real Yield Model tracks gold against the 10-Year Treasury Inflation-Protected Securities (TIPS) yield, the inflation-adjusted return available on the safest competing government asset. When TIPS yields move toward zero or turn negative, gold's zero-yield characteristic becomes competitively irrelevant. When TIPS yields move toward strongly positive levels, gold faces measurable opportunity cost headwinds.
As of mid-2026, the Federal Reserve reduced the federal funds rate from a peak of 5.25-5.50% (held from July 2023 through August 2024) to 3.50-3.75% across six cuts delivered between September 2024 and December 2025 (Federal Reserve, FOMC decisions). With core inflation still running above the Fed's 2% target, real yields remain compressed relative to historical cycle peaks, a regime that has consistently been associated with sustained gold bull markets across modern financial history.
The M2 Money Supply Model
The M2 model positions gold as a purchasing power preservation instrument against the unlimited expandability of fiat monetary systems. Its foundational premise: gold supply grows at roughly 1-2% annually through mining; fiat currency supply has no such physical constraint.
From 1971, when President Nixon suspended dollar-gold convertibility under the Bretton Woods system, to 2025:
- US M2 money supply expanded from approximately $700 billion to over $21 trillion, a roughly 30-fold increase
- Gold's compound annual growth rate over the same period was approximately 8-9%, materially exceeding the roughly 4% annual inflation rate (State Street Global Advisors)
The current fiscal environment amplifies the M2 model's signal. US federal debt exceeded $39 trillion as of mid-2026, up from $37.6 trillion at fiscal year-end 2025, with annual net interest expense crossing $1 trillion (US Treasury Fiscal Data). At these debt levels, a sustained Volcker-style tightening campaign becomes fiscally self-limiting. The interest bill on existing debt at dramatically higher rates would represent a percentage of GDP not seen in modern peacetime history, creating structural constraints on the policy trajectory that historically ended gold bull markets. Investors weighing physical gold vs ETFs as exposure vehicles must, furthermore, consider how these monetary dynamics interact with each instrument's structural characteristics.
Synthesising the Three Models: A Current Snapshot
| Model | Current Signal | Present Reading | Conditions That Have Historically Ended Cycles |
|---|---|---|---|
| Real Yield Model | Bullish | Yields compressed; Fed in cutting cycle | Sustained real yields above 3-4% |
| M2 Money Model | Bullish | $21T+ money supply; $39T+ federal debt | Durable monetary contraction |
| Dow/Gold Ratio | Mid-cycle | ~11 vs. 15 long-run average | Ratio declining toward the 2-6 range |
None of the three models is signalling the structural reversal conditions that have historically terminated gold bull markets. For additional context on how silver responds to the same monetary environment, the gold-silver ratio insights provide a useful comparative framework. Historical patterns across multiple decades are also documented in detail at GoldPrice.org's price history, which offers an accessible long-run reference for cycle analysis.
What Actually Ends a Gold Price Cycle
The Three Historical Termination Conditions
Understanding gold price cycles requires equal clarity about what ends them as what sustains them. Three structural conditions have historically marked genuine cycle endings rather than mid-cycle corrections.
Condition 1: The Real Yield Shock
The most reliable gold bear market catalyst in modern financial history was the Volcker tightening campaign of 1979-1982, which pushed the effective federal funds rate above 20% and drove real yields sharply positive. The resulting bear market lasted nearly two decades. A credible, sustained tightening cycle capable of pushing real yields durably above 3-4% represents the primary structural risk to the current cycle. The constraining factor is the US debt burden: at $39+ trillion in federal debt, aggressive sustained tightening creates a fiscal arithmetic problem that is structurally self-limiting, though not categorically impossible.
Condition 2: The Liquidity Crisis Paradox
During sudden systemic liquidity events, institutional investors frequently liquidate gold alongside equities to generate emergency cash. This occurred during the September 2008 Lehman Brothers collapse and again during the March 2020 COVID-19 market panic, with gold declining alongside equities in both instances before recovering sharply to new highs within months. These events produce temporary dislocations of 10-20% lasting weeks, not structural cycle endings.
Condition 3: Sovereign Demand Reversal
Central bank net purchases exceeding 1,000 tonnes annually across 2022, 2023, and 2024 created a structural price floor with no historical precedent in prior gold cycles. If major sovereign buyers shifted from net accumulation to net distribution, that floor would be removed. Current evidence shows no such shift: the WGC's 2026 survey recorded a record 45% of participating institutions planning reserve additions. This condition warrants ongoing monitoring through quarterly World Gold Council demand data, but represents a risk to watch rather than an active threat. Research published via ResearchGate on gold's cyclical behaviour further supports the view that sovereign demand shifts have historically been among the most consequential structural variables in long-run cycle analysis.
Mid-2026 Multi-Framework Assessment: Where Every Cycle Stands
A Coordinated Reading Across All Four Layers
With gold at approximately $4,100/oz following a roughly 27% pullback from the January 2026 intraday high, placing this correction in historical context matters:
| Historical Mid-Cycle Correction | Bull Market Context | Correction Magnitude |
|---|---|---|
| 1974-1976 | 1970s structural bull market | ~47% |
| September 2008 | 2001-2011 structural bull market | ~34% |
| 2011-2012 | Within the broader structural phase | ~20% |
| January 2026 to July 2026 | Current structural bull market | ~27% |
Reading all four cycles simultaneously as of early July 2026:
- Generational cycle: Dow/Gold ratio at ~11, below the 15 long-run average, above historic cycle lows of 1.3-6.7. Structural rotation toward hard assets confirmed and ongoing.
- Monetary cycle: Six rate cuts delivered September 2024 to December 2025; real yields compressed; central bank purchases 244 tonnes in Q1 2026 alone, exceeding the five-year quarterly average.
- Business cycle: US growth decelerated from 2025 peaks; Fed easing reflects an interest-rate-sensitive economy; gold historically performs strongest in the latter phase of the credit cycle.
- Seasonal cycle: Early July sits at the statistical annual trough, the precise inflection point preceding the August-February seasonal bull window.
None of the three structural reversal conditions — sustained positive real yields, credible fiscal tightening, and central bank net selling — are presently active. The four-cycle framework does not predict where gold will trade next month. What it does, with considerably more analytical precision, is distinguish whether the structural architecture sustaining multi-year gold bull markets remains intact.
As of mid-2026, across every time horizon that has historically mattered for long-term precious metals positioning, that architecture is still standing.
Want to Know When the Next Major Mineral Discovery Hits the ASX?
Discovery Alert's proprietary Discovery IQ model delivers real-time alerts on significant ASX mineral discoveries, instantly turning complex data into actionable opportunities — ideal for investors already tracking the structural forces shaping commodity markets. Explore historic discoveries and their returns, then begin your 14-day free trial to position yourself ahead of the broader market.