July 8, 2026
Why Precious Metals Investors Misread Price Declines — And Pay for It
There is a well-documented pattern in behavioural finance that explains why even experienced investors make poor decisions during commodity price declines. Nobel Prize-winning research by Daniel Kahneman and Amos Tversky established that humans experience losses approximately 2.5 times more acutely than equivalent gains — a principle known as loss aversion. In precious metals markets, this asymmetry has a measurable cost.
Investors who exit gold or silver positions during short-term price weakness frequently do so not because their macro thesis changed, but because short-term psychological discomfort overrode long-term analytical conviction.
Understanding this cognitive gap is the foundation of disciplined precious metals investing. The practical challenge is this: when gold drops 2%, 3%, or even 5% over a handful of trading sessions, a genuine gold or silver price dip correction or trend reversal scenario can feel identical in the moment. One represents a market pausing to consolidate; the other represents a structural breakdown. Confusing the two — in either direction — carries real financial consequences.
Most investors who exit precious metals during corrections do so not because the macro case changed, but because short-term price pain overrides long-term conviction. Recognising this bias is the precondition for correcting it.
Neurological research adds further weight to this problem. Studies using functional MRI imaging have found that financial losses activate the anterior insula, a brain region associated with pain and physical discomfort, while equivalent gains produce proportionally weaker activation in reward-processing centres. This asymmetric neural response is not a character flaw — it is a hardwired human tendency. However, in precious metals markets, where price volatility is structurally higher than many other asset classes, investors who cannot separate emotional signal from analytical signal consistently underperform those who can.
When big ASX news breaks, our subscribers know first
What a Gold or Silver Price Dip Actually Looks Like
Defining the Anatomy of a Typical Precious Metals Correction
A price correction is structurally distinct from a trend reversal. A correction is a temporary retracement within a continuing directional trend — it does not represent a change in the underlying investment case. A reversal, by contrast, reflects a genuine shift in the macro conditions that originally drove prices higher.
In practical terms, a typical gold pullback involves a 1%–3% decline over several trading sessions, while silver corrections typically measure 2%–5%, reflecting silver's structurally higher inherent volatility. Both are resolved within days to weeks under normal conditions. Genuine reversals, by contrast, persist across months and are accompanied by deteriorating macro fundamentals rather than temporary positioning adjustments.
Critically, pullbacks serve a structural market function. They flush out speculative excess, reset crowded long positions, and establish lower-cost entry points for longer-term holders. In this sense, a correction is not merely survivable — it can be constructive.
The Four Macro Triggers Behind Most Precious Metals Dips
Understanding why prices are falling is considerably more important than simply observing how far they have fallen. Four catalysts account for the majority of short-term precious metals price weakness:
| Trigger | Mechanism | Typical Duration of Impact |
|---|---|---|
| Rising US Treasury yields | Increases opportunity cost of holding non-yielding metals | Short to medium-term |
| US dollar appreciation | Raises cost of gold and silver for international buyers, softening global demand | Variable |
| Profit-taking after momentum rallies | Crowded long positions unwind; price resets without fundamental change | Days to weeks |
| Sentiment extremes and speculative excess | One-sided bullish positioning creates fragility; minor catalysts produce outsized drops | Days |
Gold's inverse relationship with real (inflation-adjusted) interest rates is one of its most empirically consistent long-run characteristics, documented extensively by the World Gold Council. When real yields rise, non-yielding assets like gold become relatively less attractive, and capital rotates toward yield-bearing alternatives. This is a reversible mechanical relationship, not a structural breakdown — and it is perhaps the single most misread catalyst behind short-term gold price weakness.
The dollar relationship operates through a different mechanism. Because gold is priced globally in US dollars, a stronger dollar raises the effective purchase cost for international buyers, suppressing aggregate demand. Furthermore, dollar-strength episodes that are episodic rather than trend-sustained have historically produced temporary corrections rather than lasting reversals.
Gold vs. Silver: Volatility Asymmetry and What It Means for Investors
Why Silver Falls Harder — And Recovers Faster
One of the most consistently misunderstood dynamics in precious metals investing is the divergent behaviour of gold and silver during market corrections. For instance, according to World Gold Council research, silver's annualised price volatility runs at approximately twice that of gold — a gap that has persisted across multiple market cycles spanning decades.
Three structural factors drive this divergence:
- Silver's total market capitalisation is significantly smaller than gold's, meaning the same volume of selling pressure produces proportionally larger price moves
- Silver's price is meaningfully influenced by industrial demand cycles — it is used extensively in solar panels, electronics, and medical applications — making it more sensitive to global growth expectations than gold
- Silver attracts substantially higher levels of speculative trading participation relative to its market size, amplifying price swings in both directions
In risk-off environments, capital exits higher-volatility assets first. The result is steeper and faster silver drawdowns during corrections — followed by proportionally stronger recoveries when conditions normalise. Investors who interpret silver's sharper corrections as evidence of structural weakness are misreading the asset's volatility profile. Examining silver versus gold performance across historical cycles makes this pattern unmistakably clear.
Historical Correction Data: Gold vs. Silver Across Market Cycles
The historical record makes the asymmetry concrete:
| Year | Gold Price Change | Silver Price Change | Market Context |
|---|---|---|---|
| 2014 | ~–1% | ~–20% | Rising USD, Fed tapering cycle |
| 2018 | ~–3.1% | ~–8.9% | Rate hike cycle, dollar strength |
| 2020 (full year) | +25.1% | +47.8% | Pandemic stimulus, safe-haven demand surge |
| 2026 (correction from ATH) | –16% from January 2026 high of $5,589/oz | ~–18-19% from January 2026 ATH | Forced liquidation of crowded positions |
The pattern is internally consistent across decades: silver amplifies the downside during corrections and the upside during recoveries. This is not a defect — it is a defining structural characteristic that sophisticated investors use to their advantage when deciding how to allocate between the two metals.
The Gold-to-Silver Ratio as a Correction Diagnostic Tool
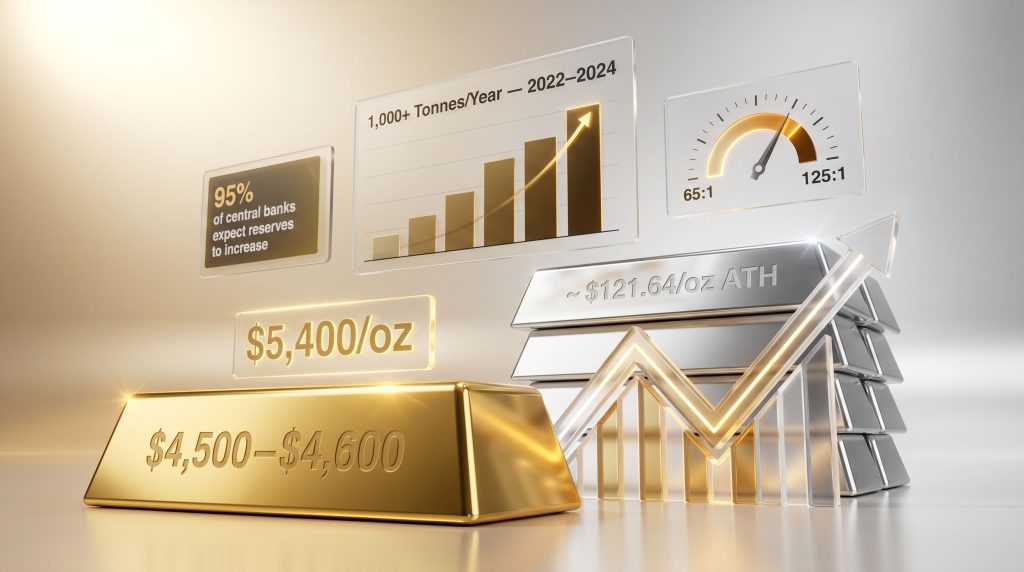
The gold-to-silver ratio measures the number of ounces of silver required to purchase one ounce of gold at current market prices. Over the past decade, this ratio has ranged from approximately 65:1 at its tightest to approximately 125:1 during the extreme stress of early 2020, when COVID-19 triggered a sharp flight to the perceived safety of gold over silver. Consequently, reviewing gold-silver ratio insights can help investors contextualise where the current reading sits within its historical range.
When the ratio rises during a broad precious metals selloff, silver is absorbing disproportionately more selling pressure — typically due to short-term risk aversion rather than any change in either metal's fundamental investment case. Historically, elevated ratio readings have preceded periods of meaningful silver outperformance relative to gold, as positioning normalises and industrial demand recovers.
A rising gold-to-silver ratio during a broad precious metals selloff is a diagnostic signal, not a directional one. It identifies which metal is bearing more selling pressure — it does not indicate whether the broader bull market has ended.
One less commonly appreciated dynamic: China's export restrictions on sulfuric acid — a critical input for copper leaching operations — have recently created an indirect supply constraint for silver, since approximately 70% of newly mined silver is produced as a byproduct of copper and base metal mining. Supply-side pressures of this nature are structurally distinct from demand-driven corrections, and investors reading silver's price behaviour without accounting for byproduct supply dynamics may misidentify the source of price weakness.
How to Distinguish a Healthy Correction from a Genuine Trend Reversal
A Diagnostic Framework: What Each Scenario Looks Like
The most valuable analytical skill in precious metals investing is not predicting where prices go next — it is correctly categorising where prices are now within the broader trend. The following framework separates correction signals from genuine reversal warning signs:
| Correction Signal | Reversal Warning Sign |
|---|---|
| Decline follows a momentum-driven rally | Sustained breach of major technical support on elevated volume |
| Macro backdrop (yields, dollar, Fed policy) unchanged | Real yields rising persistently with no catalyst for reversal |
| Gold holds near key support levels | US dollar entering a sustained multi-month uptrend |
| Silver leads the decline due to volatility dynamics | Federal Reserve signals decisive pivot toward prolonged tightening |
| Retail and speculative positioning was elevated prior to the drop | Institutional investors — not just retail traders — systematically reducing exposure |
| Dip-buying activity emerges quickly after initial selling | Price fails repeatedly to recover above broken support levels |
Central Bank Accumulation: The Structural Signal That Overrides Short-Term Noise
Among all the diagnostic indicators available to precious metals investors, central bank behaviour carries exceptional weight because it reflects sovereign-level conviction with multi-year time horizons — the opposite of short-term speculative positioning. In addition, central bank gold demand at current levels provides a structural demand floor that simply did not exist in previous correction cycles.
Central banks globally purchased more than 1,000 tonnes of gold in each of the three consecutive years from 2022 to 2024 — more than double the 400 to 500 tonne annual average of the preceding decade. This structural shift in sovereign demand behaviour did not occur in previous correction cycles, providing a demand floor that simply did not exist in earlier bull markets.
The World Gold Council's 2025 Central Bank Gold Reserves Survey found that 95% of respondents anticipated global official gold reserves would increase over the following twelve months. When accumulation at this scale continues through price pullbacks, the weight of structural demand argues powerfully against interpreting those pullbacks as trend reversals.
Technical Confirmation Levels Worth Monitoring
Technical analysis provides a secondary verification layer for the macro-fundamental assessment:
- Gold's bullish technical alignment: price holding above rising 21-, 50-, 100-, and 200-day simple moving averages simultaneously
- RSI (Relative Strength Index) readings below overbought thresholds near 59–60 indicate ongoing momentum without speculative excess that would warrant concern
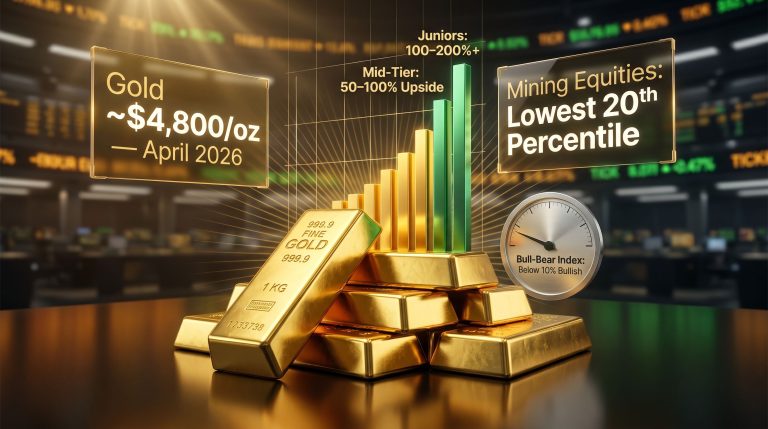
- Analysts have identified the $4,500–$4,600/oz range as a key structural demand zone in the current cycle — sustained closes below this level on elevated volume would warrant reassessment
- Goldman Sachs carries a year-end 2026 gold price forecast of $5,400/oz, framing current price weakness as an accumulation opportunity within a continuing bull market
For silver, the technical picture has shown V-shaped recovery patterns following forced liquidation events — consistent with positioning resets rather than structural breakdowns. This recovery velocity is a characteristic feature of silver's correction behaviour, not an anomaly. ING's analysis of a gold and silver reset similarly supports the view that recent price weakness represents consolidation rather than a definitive change in direction.
What Macro Conditions Would Actually Signal a Genuine Reversal
Three Historical Preconditions for Precious Metals Bear Phases
Genuine precious metals trend reversals have historically required a convergence of specific macro conditions — not a single catalyst, but a sustained multi-variable shift:
-
Sustained real yield expansion: Gold's inverse relationship with real (inflation-adjusted) interest rates is its most structurally reliable long-run characteristic. A prolonged rise in real yields increases the opportunity cost of holding non-yielding metals, redirecting capital toward fixed income. This effect must be persistent — not episodic — to threaten the broader trend.
-
Persistent US dollar strength: A multi-month USD uptrend structurally raises the effective purchase cost of gold and silver for the majority of global buyers, suppressing demand over an extended period. Brief dollar strength episodes do not meet this threshold.
-
Decisive and sustained monetary policy tightening: A clear Federal Reserve pivot toward a prolonged rate-raising cycle — not a single meeting's decision — has historically preceded extended precious metals bear phases. The operative word is prolonged; isolated tightening actions that are subsequently reversed do not meet the reversal threshold.
Why None of These Conditions Are Currently Dominant
As of mid-2026, the macro scorecard does not align with genuine reversal conditions:
| Macro Variable | Current Signal | Correction or Reversal Indicator? |
|---|---|---|
| Real US Treasury yields | Contained; not in sustained uptrend | Correction |
| US dollar trend | Episodic strength; no sustained multi-month uptrend | Correction |
| Federal Reserve policy direction | Easing bias intact; rate cut expectations persist | Correction |
| Central bank gold demand | 1,000+ tonnes per year for three consecutive years (2022–2024) | Correction |
| Institutional positioning | Dip-buying observed; no broad institutional exit | Correction |
| Technical structure in gold | Price above major moving averages; RSI non-overbought | Correction |
| Speculative positioning in silver | Post-liquidation reset; V-shaped recovery patterns evident | Correction |
This analysis reflects the macro environment as of mid-2026. Investors should continuously monitor real yield trajectories, Federal Reserve communications, and US dollar index trends — a sustained shift in any of these variables would materially change the framework assessment above.
A Structured Decision Framework for When Prices Fall
Five Steps to Replace Emotional Reactions with Process-Driven Responses
The most damaging investor behaviour during a gold or silver price dip is binary thinking: either panic-sell everything or attempt to call the precise bottom and deploy all available capital at once. Neither approach is a strategy.
Step 1 — Diagnose the cause before acting
Identify whether the decline is driven by yield movements, dollar strength, profit-taking, or a genuine macro shift. Cross-reference the observed price action against the correction versus reversal diagnostic framework. Do not act on magnitude alone.
Step 2 — Assess your current allocation against target ranges
A price dip is a natural checkpoint to evaluate whether the portfolio's precious metals weighting has drifted below target levels. Conservative portfolio benchmarks typically place gold at approximately 8–10% of total portfolio value as a stability anchor. Growth-oriented investors may target silver at 7–10% to capture higher upside during recovery phases, accepting greater near-term volatility in exchange.
Step 3 — Deploy capital in tranches, not all at once
No analyst or institution reliably identifies the precise price bottom of a correction. Staged purchasing across multiple entry points reduces timing risk and lowers the average cost basis of the overall position — a mathematically superior outcome to a single lump-sum deployment at an uncertain price point.
Step 4 — Apply dollar-cost averaging as the structural default
Committing a fixed dollar amount on a consistent schedule — monthly or quarterly, regardless of current price direction — removes the psychological pressure of market timing entirely. This approach will not produce the theoretically optimal entry price, but it consistently outperforms reactive, emotionally-driven decision-making across full market cycles.
Step 5 — Prioritise gold before silver when uncertainty is highest
Gold as a safe haven offers more stable support levels and clearer macro anchoring during periods of elevated uncertainty. Silver is appropriate to add during dips, but only for investors with genuine tolerance for continued near-term volatility and a multi-year time horizon. Sequencing matters — establish the more stable position first. Furthermore, understanding the range of gold investment options — from physical bullion to ETFs — is essential when deciding how to deploy capital during a correction.
The next major ASX story will hit our subscribers first
The Long-Term Perspective: Corrections Are Structurally Normal in Bull Markets
Every Major Gold Bull Market Has Been Interrupted by Significant Pullbacks
A perspective frequently lost in the short-term noise of price declines is that corrections are not exceptions to precious metals bull markets — they are embedded features of them. Every sustained multi-year gold bull market on record has included pullbacks of 10% to 20% or more without those corrections marking the end of the broader trend.
The investors who built the most significant long-term positions were those who treated corrections as accumulation phases rather than exit signals. This is not a motivational sentiment — it is what the historical record consistently shows. Silver's higher volatility makes its corrections feel more severe, and its recoveries proportionally stronger. For investors with genuine multi-year time horizons, this characteristic has been a feature rather than a liability.
The Structural Investment Case and the Scale of Potential Demand
Persistent inflation dynamics, geopolitical fragmentation, and expanding sovereign debt levels across major economies continue to underpin the macro argument for hard asset allocation. Central bank behaviour at historically elevated accumulation levels provides a structural demand floor that did not exist in previous correction cycles.
Consider the scale of the opportunity through a different lens: global private wealth is estimated at approximately $471 trillion, with privately held gold accounting for roughly 6% of that total. Even a marginal reallocation of global wealth toward precious metals represents a demand catalyst of extraordinary scale. The arithmetic of this potential shift is one of the less commonly discussed dimensions of the long-term precious metals case.
The question is never simply whether prices have fallen. The question is whether the conditions that drove prices higher have fundamentally changed. When the answer is no, a gold or silver price dip correction or trend reversal debate is most accurately resolved in favour of correction — a market catching its breath, not changing direction.
Frequently Asked Questions: Gold or Silver Price Dip Correction or Trend Reversal
What is the difference between a gold price correction and a trend reversal?
A correction is a short-term price decline within a continuing uptrend, typically lasting days to weeks and driven by technical factors such as profit-taking, yield movements, or temporary dollar strength. A trend reversal represents a structural shift in the macro environment, characterised by sustained changes in real interest rates, dollar direction, and institutional positioning. The investment case for gold has not changed during a correction; during a reversal, it has.
Why does silver fall harder than gold during market pullbacks?
Silver's market is significantly smaller than gold's, its price is more exposed to industrial demand fluctuations, and it attracts proportionally higher speculative participation. In risk-off environments, investors reduce exposure to higher-volatility assets first. The result is steeper silver drawdowns during corrections, followed by proportionally stronger recoveries when conditions normalise. JP Morgan's analysis of silver prices provides further institutional context on the structural drivers behind silver's distinctive volatility profile.
Is buying gold or silver during a price dip a sound investment approach?
When the macro backdrop remains intact — real yields are not rising persistently, inflation remains elevated, and central banks continue accumulating at historically high levels — a price dip in either metal most likely represents a positioning reset rather than a structural breakdown. Dollar-cost averaging into price weakness has historically produced stronger long-term outcomes than attempting to identify the precise bottom.
What does the gold-to-silver ratio signal during a correction?
When the ratio rises during a pullback, silver is underperforming gold due to short-term risk aversion, not a structural shift in either metal's fundamentals. Over the past decade, the ratio has ranged from approximately 65:1 to 125:1, with elevated readings historically preceding periods of silver outperformance relative to gold as sentiment recovers.
What price levels should gold investors watch as support during a correction?
Analysts in the current cycle have identified the $4,500–$4,600/oz range as a key structural demand zone for gold. Sustained closes below this level on elevated volume would warrant reassessment of the correction thesis. Goldman Sachs carries a year-end 2026 gold price forecast of $5,400/oz, framing current price levels as within a continuing bull market rather than a reversal.
How much of a portfolio should be in gold and silver?
Conservative investors typically target gold at 8–10% of total portfolio value as a stability anchor. Growth-oriented investors may allocate silver at 7–10% to capture higher upside during recovery phases, accepting greater near-term volatility. These are general reference points — individual circumstances, risk tolerance, and investment time horizon should inform any specific allocation decision. Consulting a qualified financial adviser before making any changes is recommended.
Disclaimer: This article is intended for informational and educational purposes only. It does not constitute financial or investment advice. All investments, including precious metals, involve risk and may result in partial or total loss. Past performance is not a guarantee of future results. Readers should consult a qualified financial adviser before making any investment decisions. Forecasts and price targets referenced represent the views of third-party institutions and should not be relied upon as predictions of future performance.
Want to Stay Ahead of the Next Major Mineral Discovery on the ASX?
While understanding precious metals price cycles is essential for portfolio positioning, Discovery Alert's proprietary Discovery IQ model delivers real-time notifications on significant ASX mineral discoveries — instantly translating complex geological data into actionable insights for both traders and long-term investors. Explore Discovery Alert's dedicated discoveries page to see how historic finds have generated substantial returns, and begin your 14-day free trial today to position yourself ahead of the broader market.