June 11, 2026
Two Assets, One Signal: What the Gold-to-Oil Ratio Reveals About the World Economy
Long before central banks published quarterly outlooks or economists debated yield curve inversions, commodity markets were encoding macroeconomic information in real time. The relative price of gold and crude oil, two globally traded resources priced in US dollars, has quietly operated as one of the most reliable diagnostic instruments available to investors across more than five decades of monetary history. Most market participants walk straight past it.
The gold-to-oil ratio is not a trading system. It is not designed to tell you what to buy before next Thursday. What it does instead is considerably more valuable: it reveals which force is currently dominant in the global economy, monetary deterioration or industrial energy demand, and whether the two are moving in harmony or pulling in opposite directions.
Understanding how to read this signal, and more importantly, understanding its limitations, is the foundation of using it well. Furthermore, understanding the gold and oil market dynamics between these two assets provides essential context before applying the ratio in practice.
When big ASX news breaks, our subscribers know first
How the Gold-to-Oil Ratio Works and What the Number Means
The Calculation in Plain Terms
The formula is straightforward. Divide the spot price of gold per troy ounce by the spot price of WTI crude oil per barrel. The result is a dimensionless number that tells you how many barrels of crude oil one ounce of gold can purchase at any given moment.
Gold-to-Oil Ratio = Gold spot price (per troy oz) divided by WTI crude oil spot price (per barrel)
A ratio reading of 20 means one ounce of gold buys 20 barrels of oil. A reading of 50 means gold commands 50 barrels. Whether that elevated reading reflects gold being expensive, oil being cheap, or both simultaneously is the analytical question that matters most.
WTI (West Texas Intermediate) is the standard benchmark used in this calculation, though using Brent crude produces comparably meaningful results. Both benchmarks generate the same broad analytical picture.
Why These Two Assets Are Analytically Paired
Gold and oil share a set of properties that make their ratio informative rather than arbitrary. Both are globally traded, both are denominated in US dollars, and both carry sensitivity to inflation expectations, geopolitical events, and shifts in monetary conditions. Neither emerges without significant resource investment. Together, they have shaped capital markets for over a century.
However, they respond to fundamentally different underlying forces. That divergence is precisely what makes the ratio useful.
| Property | Gold | Crude Oil |
|---|---|---|
| Pricing currency | US Dollar | US Dollar |
| Inflation sensitivity | Monetary/expectation-driven | Input cost/supply-driven |
| Recession behaviour | Tends to hold or rise | Typically falls with demand |
| Central bank role | Reserve asset | Not held as reserve |
| Primary price driver | Monetary confidence | Industrial energy demand |
Oil prices track economic activity directly. When global economies expand, energy consumption rises and oil prices tend to follow. During contractions, oil typically falls alongside weakening demand. It is an industrial commodity whose price moves with the business cycle.
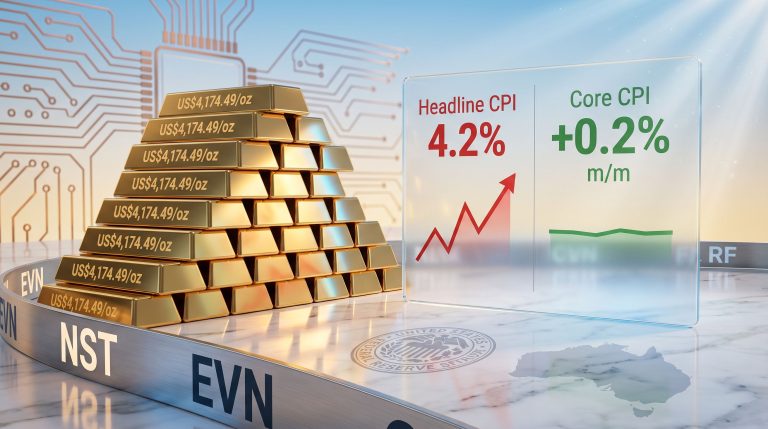
Gold operates differently. It carries no industrial use case that disappears during a recession. Its price is driven primarily by monetary confidence, or more precisely, by the market's collective assessment of how well monetary authorities will protect the purchasing power of currency over time. When that confidence erodes, gold tends to rise regardless of what is happening to broader economic activity.
The Historical Average of the Gold-to-Oil Ratio: What a Century of Data Shows
The Long-Run Equilibrium Range
From 1970 through 2019, the gold-to-oil ratio averaged roughly 15 to 20 barrels per ounce, according to historical ratio data compiled by Macrotrends. That range proved remarkably durable across radically different economic conditions: two OPEC oil shocks, the Volcker recession, the dot-com cycle, and the 2008 financial crisis all failed to permanently displace it.
This long-run stability is itself analytically significant. It suggests gold and oil tend to price the same underlying monetary reality over time, specifically the purchasing power of the US dollar. Their short-term drivers diverge sharply, yet the long-run equilibrium holds.
Research frameworks including those published by Goehring and Rozencwajg have noted that most historical observations fall within a 10 to 30 range, with readings above 30 typically coinciding with significant monetary or economic disruptions. The broader century-long average is frequently cited at approximately 20 barrels per ounce across independent analytical frameworks.
Era-by-Era Historical Breakdown
| Period | Approximate Ratio Range | Primary Driver |
|---|---|---|
| 1946–1970 (Bretton Woods) | ~13x | Fixed gold ($35/oz) and administered oil prices |
| 1970s (post-Nixon shock) | 15–25x, volatile | Dollar devaluation, OPEC embargo, monetary collapse |
| 1976–1977 (brief dip) | Below 10x | Sharp oil price spike, gold correction |
| 1980s–1990s | 10–20x, stabilising | Volcker rate tightening, OPEC grip weakening |
| 2000–2008 (commodity supercycle) | 6–25x | Oil surge to $147/barrel; crisis crash to $32/barrel |
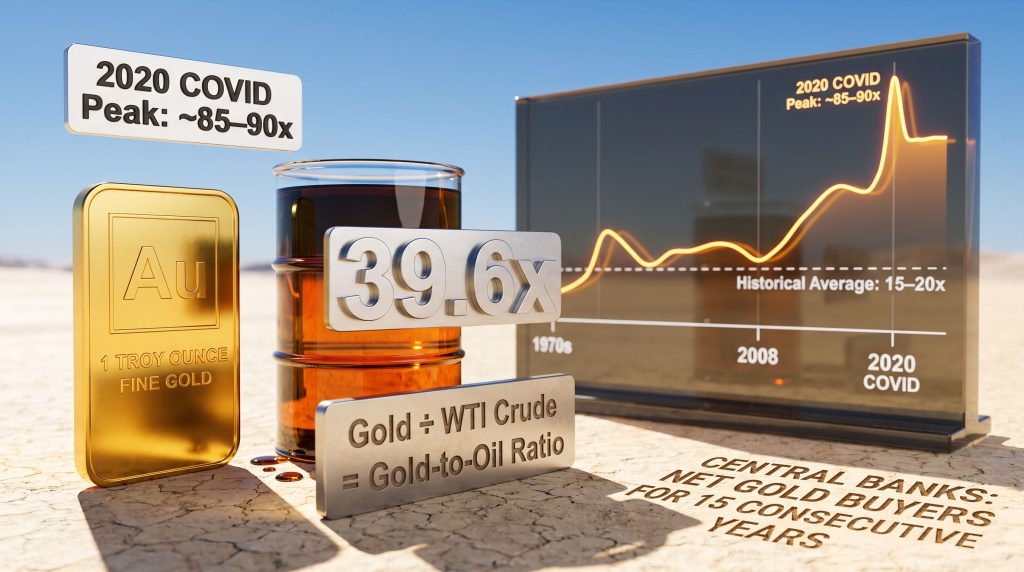
| 2020 COVID shock | Up to ~85–90x | WTI briefly went negative; gold near $1,700/oz |
| 2020s (structural elevation) | Sustained above 30x | Central bank reserve accumulation, fiscal expansion |
The 1976 to 1977 period deserves particular attention. Oil prices jumped sharply while gold corrected from earlier gains, briefly pushing the ratio below 10. This stands as one of the few sustained sub-10 readings in the modern era and reversed relatively quickly once supply dynamics normalised. It remains a useful historical marker for identifying what a genuinely oil-expensive environment looks like in ratio terms.
Critical data point: In April 2020, WTI crude oil futures settled at negative prices for the first time in recorded history, according to the US Energy Information Administration. With gold trading near $1,700 per ounce, the gold-to-oil ratio briefly reached approximately 85 to 90 times. This was a pure demand-destruction event, not a monetary signal, and it reverted rapidly as energy markets normalised over the following quarters.
Where the Ratio Stands in the Current Environment
Current readings place the gold-to-oil ratio at approximately 39.6 barrels per ounce, positioning it near the upper boundary of its historical 6 to 40 range. Readings above 40 have been rare exceptions in the modern era, according to analysis compiled in the InGoldWeTrust Report. What distinguishes the current period from prior spikes is duration. Previous extreme readings were typically event-driven and short-lived. The sustained elevation since 2020 reflects something more structural in nature. Consequently, long-term trend analysis of the ratio supports this view of structural rather than cyclical elevation.
What a High Gold-to-Oil Ratio Actually Signals
Two Distinct Interpretations That Require Separation
An elevated gold-to-oil ratio can arise from two entirely different causes, and confusing them leads to flawed analytical conclusions.
Interpretation 1: Monetary deterioration is the primary driver
When gold rises faster than oil over a sustained period, markets are typically pricing long-run erosion of purchasing power. Persistent fiscal deficits financed through balance sheet expansion, quantitative easing cycles, and negative real interest rates all lift gold's monetary premium without necessarily affecting oil's industrial demand signal. Gold prices the anticipated trajectory of monetary policy. Oil prices the current state of economic activity. When they diverge materially, gold is usually pricing something that oil cannot.
Interpretation 2: Oil is temporarily depressed
When oil falls sharply on demand destruction or supply oversupply, the ratio spikes even if gold remains completely flat. The 2020 COVID reading of approximately 89 times was primarily an oil collapse event, not a gold surge. Oil subsequently rallied more than 500% over the following two years as demand recovered and supply constraints emerged.
Identifying which asset moved first is the single most important analytical step before drawing any conclusions from a ratio reading.
A Framework for Reading Ratio Movements
| Ratio Movement | Oil Behaviour | Gold Behaviour | Most Likely Signal |
|---|---|---|---|
| Rising ratio | Falling | Rising | Monetary stress or demand contraction |
| Rising ratio | Stable/falling | Flat | Oil supply event (OPEC, geopolitical) |
| Falling ratio | Rising sharply | Flat/rising | Economic expansion or commodity supercycle |
| Stable ratio | Rising | Rising proportionally | Dollar weakness across both assets |
Research from Goehring and Rozencwajg has found that historically, when the gold-to-oil ratio has exceeded 30 times, crude oil has delivered strong forward returns on average. This frames an elevated ratio not only as a monetary stress signal but also as a potential contrarian value indicator for oil, depending on which side of the ratio drove the move.
How the Gold-to-Oil Ratio Connects to Inflation
Two Assets Hedging Two Different Types of Inflation
One of the most persistent misconceptions in commodity analysis is the assumption that gold and oil hedge the same type of inflation. They do not.
-
Oil is an inflation input. Rising oil prices feed directly into manufacturing, logistics, agriculture, and utilities costs. This flows through to CPI, particularly in goods categories. The Federal Reserve monitors oil prices as a leading indicator when assessing near-term inflation pressure, reflecting its role as both a cause and a symptom of rising consumer prices.
-
Gold is an inflation outcome hedge. Gold does not cause inflation. It discounts the expectation that monetary authorities will permit purchasing power to erode over time. When governments run persistent deficits financed by balance sheet expansion, gold tends to rise in anticipation, often before consumer prices move. This makes it a forward-looking monetary signal rather than a coincident indicator.
When the Two Assets Tell Opposite Stories
In the 1970s, gold and oil moved together because both were responding to the same force: a dollar losing its Bretton Woods anchor. Both assets rising simultaneously leaves the ratio stable and provides less independent information.
When they diverge, the ratio becomes analytically powerful. A rising ratio driven by gold outpacing oil typically reflects monetary conditions deteriorating faster than economic growth. A falling ratio driven by oil outpacing gold typically reflects strong industrial demand operating within a backdrop of intact monetary confidence. In addition, the interplay between gold and bond cycles provides further confirmation of whether monetary deterioration is truly the underlying driver.
The Four Forces That Drive the Gold-to-Oil Ratio
Forces That Push the Ratio Higher
1. Monetary debasement and fiscal expansion
Sustained large government deficits financed through balance sheet expansion lift gold's monetary premium. Oil has no mechanism for pricing the long-run trajectory of monetary policy. Gold does. Quantitative easing cycles, persistent negative real interest rates, and currency debasement all contribute to elevated readings by raising gold without a corresponding lift in oil's industrial demand signal.
2. Structural central bank reserve demand
Central bank gold demand has been a defining force, with net purchases sustained for 15 consecutive years since the 2008 financial crisis, according to the World Gold Council. Annual purchases exceeded 1,000 tonnes in each of 2022, 2023, and 2024, with 2022's 1,082 tonnes marking the highest annual total since 1950. Central banks accumulate gold because it carries no counterparty risk, cannot be frozen or sanctioned, and holds value across monetary regimes.
No equivalent institutional accumulation bid exists in oil markets. This asymmetry structurally lifts gold's price floor in a way that has no oil-market equivalent and creates a persistent upward pressure on the ratio that prior historical averages did not fully price.
Forces That Push the Ratio Lower
3. Robust global economic expansion
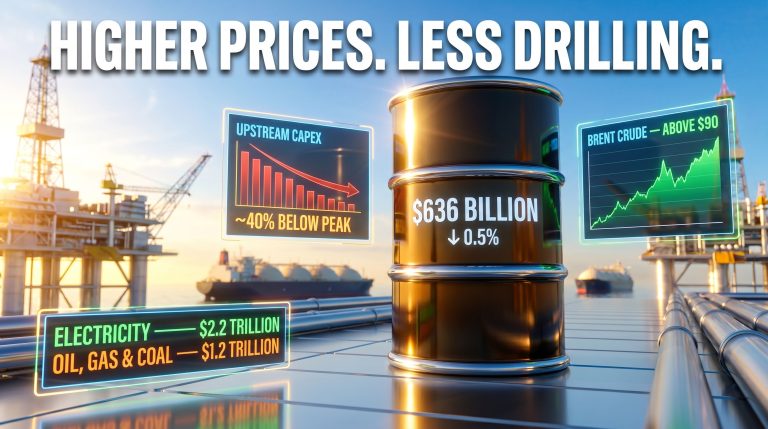
Strong growth raises energy consumption and lifts oil's industrial premium. When positive real interest rates accompany expansion, the opportunity cost of holding non-yielding gold rises simultaneously. The commodity supercycle of the early 2000s, during which oil surged from under $20 to $147 per barrel by mid-2008, compressed the ratio toward its lowest modern readings by lifting oil faster than gold could respond.
4. Oil supply shocks and geopolitical disruptions
Cartel production decisions, embargoes, and conflict-driven supply disruptions spike oil prices independently of monetary conditions. The 1973 OPEC embargo sent crude prices from roughly $3 to $12 per barrel, sharply compressing the ratio. Furthermore, the OPEC oil market influence on ratio readings is significant enough that supply shock-driven compression typically mean-reverts once supply adjusts, limiting its long-term analytical signal value.
Important nuance: Geopolitical events affect gold and oil asymmetrically, and this asymmetry has grown more pronounced in recent years. Oil tends to spike on supply disruption fears. Gold increasingly trades as a monetary asset rather than a geopolitical fear hedge. When oil spikes sharply on a geopolitical headline while gold barely responds, the ratio falls, but this does not reflect any change in underlying monetary conditions. Separating supply-event ratio moves from structurally-driven ones is essential to accurate interpretation.
The next major ASX story will hit our subscribers first
How Investors Apply the Gold-to-Oil Ratio in Portfolio Analysis
Reading the Ratio as a Macro Regime Signal
Sustained ratio above 30–40x:
Suggests monetary stress, oil demand weakness, or structural institutional gold demand. Gold has historically outperformed in these environments over multi-year horizons. The portfolio implication is not necessarily a direct trade but a recognition that the conditions driving gold's monetary premium are real and potentially durable across full business cycles.
Ratio below 10–15x:
Signals strong energy demand, a commodity supercycle, or a geopolitical supply premium in oil. Oil-linked assets tend to outperform; gold may hold value but is unlikely to lead. Historically rare in the modern era.
Ratio near long-run average (15–20x):
Confirms monetary conditions are broadly stable and energy markets are functioning normally. Neither asset carries a strong relative signal advantage. This is an equilibrium reading, not a directional one.
Combining the Ratio With Complementary Signals
The gold-to-oil ratio functions best as one component within a broader analytical framework rather than as a standalone trigger.
| Signal Pairing | What It Adds to the Analysis |
|---|---|
| Gold-to-oil + real interest rates | When ratio is high AND real rates are negative, the monetary stress signal is at its strongest |
| Gold-to-oil + Dow-to-Gold ratio | Reveals how equity markets are valued in real monetary terms across full cycles |
| Gold-to-oil + central bank flow data | Institutional reserve context confirms whether gold's premium is structurally supported |
| Gold-to-oil + OPEC production data | Helps distinguish supply-event ratio moves from monetarily-driven ones |
Mean Reversion: Speed and Reliability
Mean reversion speed depends entirely on which driver produced the extreme reading. Demand-shock spikes, such as the 2020 COVID extreme, revert quickly once the shock passes. Structurally-driven elevation from reserve management shifts and persistent fiscal deterioration can persist across multiple business cycles without resolving.
Using the gold-to-oil ratio as a trade timing trigger rather than a structural diagnostic is a common and costly analytical error. Knowing the ratio is at an extreme identifies the direction of risk, not the timing of resolution.
What the Ratio Reveals About the US Dollar
The Dollar as the Hidden Third Variable
Both gold and oil are priced in US dollars, meaning dollar movements affect both assets simultaneously. When the dollar weakens, both tend to rise in dollar terms, often leaving the ratio relatively stable. The ratio's most useful property is precisely this: dividing gold by oil filters out their shared dollar exposure. What remains after the division is what the market specifically prices in gold that it does not price in oil.
A persistently rising ratio therefore signals deteriorating confidence in the monetary system beyond simple dollar weakness. Persistent deficits, expanding central bank balance sheets, or structural shifts in reserve management all drive this pattern in ways that nominal dollar depreciation alone does not capture.
The Reserve Currency Dimension
The US dollar's share of global foreign exchange reserves has declined from approximately 71% in 1999 to around 57% by the mid-2020s, according to IMF COFER data. As this structural shift continues, gold's role as a non-dollar reserve asset gains institutional support. Part of what elevated gold-to-oil readings in recent years reflect is precisely this longer-term reserve diversification trend, with central banks consciously reducing dollar concentration and increasing gold holdings as a counterbalancing reserve asset.
Key Limitations Every Analyst Should Understand
Five Critical Caveats
Limitation 1: Oil is structurally noisy
OPEC and OPEC+ production decisions can override fundamental demand signals for extended periods. A ratio spike driven by a cartel supply cut can appear identical to a monetarily-driven spike from the outside. Always verify whether an oil price move is supply-driven before drawing monetary conclusions from a ratio change.
Limitation 2: The historical average may be shifting
The 15 to 20 times average formed during an era of relatively stable dollar hegemony and limited central bank gold accumulation. If central banks are permanently repricing gold as a reserve asset at structurally higher levels, the long-run equilibrium range may shift upward. Mean reversion to 15 times becomes a progressively less reliable expectation in a fundamentally different reserve management environment.
Limitation 3: It is not a timing tool
Extreme ratio readings identify the direction of risk, not the moment of resolution. Ratios can remain at seemingly extreme levels for years. Structural elevation driven by institutional reserve shifts can persist across full business cycles without the kind of sharp mean reversion that event-driven spikes typically produce.
Limitation 4: Silver requires separate analysis
Approximately 55 to 60% of silver's demand comes from industrial applications, including photovoltaics, electronics, and automotive uses, according to the Silver Institute's World Silver Survey 2025, which recorded record industrial demand of 680.5 million ounces in 2024. Silver is more economically sensitive than gold and correlates more closely with oil in certain market environments. The gold-to-oil ratio does not capture silver's dual monetary and industrial nature. A complete precious metals framework should incorporate gold-silver ratio analysis alongside the gold-to-oil ratio to treat silver independently, with reference to its specific supply-demand fundamentals.
Limitation 5: Geopolitical distortions can mislead
Short-duration spikes driven by geopolitical headlines typically revert quickly and carry limited long-term portfolio significance. Events that spike oil while leaving gold relatively unmoved produce ratio readings that superficially resemble monetary signals but are actually energy supply events. Confirming whether gold's price action independently supports the signal is the essential validation step.
Frequently Asked Questions About the Gold-to-Oil Ratio
Is a High Gold-to-Oil Ratio Bullish for Gold?
A high ratio confirms that structural conditions associated with gold's long-term performance are present, including monetary stress, fiscal deterioration, or institutional reserve reallocation. However, it is not a short-term timing signal. In the near term, a high ratio can precede a gold correction if oil rebounds sharply or if monetary tightening raises the opportunity cost of holding non-yielding assets. The ratio functions as a structural confirmation tool rather than a price prediction mechanism.
Does a High Ratio Mean Oil Is Undervalued?
Sometimes, but the answer depends on which side of the ratio moved. When the 2020 COVID spike pushed the ratio toward 89 times, oil was genuinely depressed in absolute terms and subsequently rallied more than 500% over the following two years. When gold's monetary repricing drives the elevation rather than an oil collapse, oil may not be particularly cheap in absolute terms. Identifying the primary mover is essential before drawing relative value conclusions.
Can the Gold-to-Oil Ratio Signal Recession Risk?
It can flag recession risk when the ratio rises primarily because of a falling oil price, reflecting weakening energy demand and economic contraction. The ratio's spike toward 25 times during the 2008 financial crisis and its extreme readings during the 2020 COVID contraction both coincided with severe economic downturns. When gold is the primary mover rather than oil, however, the ratio signals monetary stress rather than economic contraction. Confirmation from other demand-side indicators is required before drawing recession conclusions.
How Does the Gold-to-Oil Ratio Compare to the Gold-to-Silver Ratio?
| Ratio | Primary Signal | What It Measures |
|---|---|---|
| Gold-to-oil | Macro/monetary | Monetary risk versus industrial energy demand |
| Gold-to-silver | Precious metals valuation | Relative pricing between two monetary/store-of-value assets with silver's industrial layer added |
The gold-to-silver ratio is used more tactically, with investors rotating between metals based on relative value. When the gold-to-silver ratio is high, silver is cheap relative to gold, often signalling either economic weakness suppressing silver's industrial demand or an early-stage precious metals bull market where gold leads. The gold-to-oil ratio, by contrast, serves as a broader macro backdrop signal rather than a rotation trigger between specific assets.
How Does OPEC Influence the Gold-to-Oil Ratio?
OPEC production decisions represent one of the most significant distortions to monitor when interpreting the gold-to-oil ratio. When OPEC restricts supply and oil prices rise sharply, the ratio can fall even in the absence of genuine economic growth or demand recovery. Conversely, when OPEC increases production or a price war erupts, oil prices collapse and the ratio spikes in ways that can be misread as monetary signals. The practical rule: when the ratio moves primarily because of an OPEC decision, treat it with scepticism. A flat gold price while oil falls on cartel news signals a supply event. A simultaneously rising gold price reinforces the monetary interpretation.
Disclaimer: This article is for informational and educational purposes only and does not constitute investment advice or a recommendation to buy or sell any asset. All investment decisions involve risk, including the possible loss of capital. Readers should consult a qualified financial adviser before making any investment decisions. Past performance of any asset, ratio reading, or historical pattern is not a guarantee of future results. Forward-looking statements, projections, and scenario analyses presented in this article are speculative in nature and may not reflect actual future outcomes.
Want to Know When the Next Major Commodity Discovery Hits the ASX?
Discovery Alert's proprietary Discovery IQ model delivers real-time alerts on significant ASX mineral discoveries, translating complex commodity data into actionable insights for investors at every level — start your 14-day free trial today, or explore historic discovery returns to understand just how transformative early positioning in major finds can be.