
June 11, 2026
When the Headline Lies: Reading US CPI Data Through the Right Lens
There is a peculiar dynamic that repeats itself across financial market cycles: investors respond to the number they can see rather than the story that number is actually telling. Inflation data is among the most consistently misread economic releases in global markets, not because the figures are opaque, but because the composition of those figures demands a level of analytical disaggregation that headline-focused news coverage rarely provides.
Understanding how US CPI and ASX gold and tech sector outcomes interconnect requires looking past the surface print and into the structural architecture of what inflation data actually measures, which components carry policy weight, and which are little more than temporary statistical noise with a geopolitical origin story.
When big ASX news breaks, our subscribers know first
The Two Inflation Numbers That Tell Completely Different Stories
Headline vs. Core CPI: A Framework for Rational Market Interpretation
Not every percentage point of inflation carries equal analytical weight. The distinction between headline and core CPI is not merely academic; it is the primary filter through which the US Federal Reserve evaluates monetary policy, and therefore the primary driver of how rate-sensitive assets are repriced globally.
-
Headline CPI measures the full consumer price basket, incorporating food and energy costs that are notoriously prone to sharp short-term swings driven by external shocks rather than domestic demand conditions
-
Core CPI removes food and energy from the calculation to isolate the persistent, structural inflation trend that central banks rely upon when calibrating interest rate settings
-
When the two readings diverge sharply, financial markets tend to anchor their rate expectations to the core figure, treating the headline as context rather than signal
| Metric | Includes | Excludes | Fed Relevance | Market Sensitivity |
|---|---|---|---|---|
| Headline CPI | All items | Nothing | Low (volatile) | High short-term reaction |
| Core CPI | Services, rents, goods | Food and energy | High (policy anchor) | Sustained repricing |
| Energy sub-index | Fuel, utilities | Non-energy | Minimal | Spike-driven noise |
Why Geopolitical Energy Shocks Create Statistical Distortions
Disruptions to major oil transit corridors, such as conflict activity affecting the Strait of Hormuz, can drive fuel prices sharply higher with no connection to domestic consumer or business pricing behaviour. These geopolitical energy premiums embed themselves into the headline CPI figure with precision while leaving the underlying structural inflation trend largely undisturbed.
Historical patterns reinforce this point. The energy-driven CPI surges of 2022, which briefly pushed headline readings to multi-decade highs across developed economies, faded as supply conditions normalised without triggering the entrenched wage-price spirals that characterised 1970s inflation. The critical analytical principle is this: the persistence of an inflation shock matters far more than its initial magnitude.
Furthermore, markets on edge ahead of a US CPI report often overreact to energy-driven inflation fears, pricing in rate responses that the underlying core data simply does not support.
When an inflation spike is geographically and categorically concentrated, the correct analytical response is to assess its staying power, not simply its size. A 40% surge in fuel costs visible for one quarter is categorically different from a 5% broadening of price pressure across services, rents, and discretionary spending.
Unpacking the May 2026 US CPI Print: What the Data Actually Said
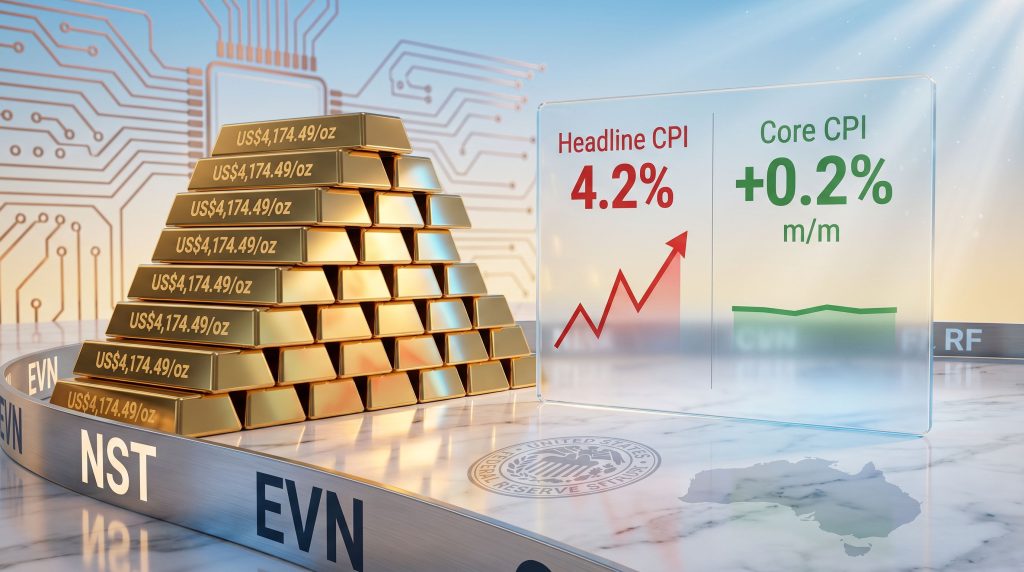
The 4.2% Reading and the Composition Problem
US consumer prices rose 4.2% year-on-year to May 2026, the highest annual reading since April 2023, representing a three-year high that triggered an immediate negative reaction across equity markets. The Dow Jones Industrial Average fell sharply on the news, and the instinct among many market participants was to treat the figure as a broad-based inflationary signal requiring urgent policy response.
That interpretation, however, collapses under scrutiny. Decomposing the print reveals that virtually the entire headline acceleration was concentrated in energy and fuel costs, driven by elevated oil prices linked to supply disruptions around the Strait of Hormuz. The absence of broad-based price acceleration across services, shelter, and discretionary categories is analytically decisive, because those are the categories that signal durable, policy-relevant inflation.
The Core Reading That Reframed the Entire Narrative
Month-on-month core CPI rose just +0.2% in May 2026, coming in softer than economist consensus expectations. This single data point fundamentally altered the policy implications of the headline figure. A below-consensus core reading confirms that inflationary momentum has not spread into the components the Federal Reserve treats as its primary guide for rate-setting decisions.
The practical implication is straightforward: a truly alarming inflation report would have shown price pressures permeating rents, services, and labour-intensive sectors. What the May 2026 data showed instead was a commodity-driven headline number resting on top of a relatively contained underlying trend.
| CPI Scenario | Core Reading | Fed Response Probability | USD Direction | Bond Yields | ASX Gold Miners | ASX Tech Stocks |
|---|---|---|---|---|---|---|
| Hot CPI (broad-based) | Above 0.3% m/m | Rate hike likely | Strengthens | Rise sharply | Bearish pressure | Significant headwind |
| Mixed CPI (energy-led spike) | ~0.2% m/m | On hold | Stable/mild rise | Contained | Neutral to mild positive | Cautiously supportive |
| Soft CPI (broad disinflation) | Below 0.2% m/m | Rate cut potential | Weakens | Fall | Strongly bullish | Strong tailwind |
| May 2026 Actual | 0.2% m/m (soft) | On hold | Stabilised | Contained | Negative pressure relieved | Marginal support |
How US CPI Transmission Reaches ASX Gold Stocks
The Three-Channel Mechanism Connecting US Inflation to Australian Gold Equities
The pathway connecting a US inflation release to the share prices of ASX-listed gold miners runs through three distinct but interconnected channels. Each operates independently, but their combined effect is what drives the outsized reactions gold equities frequently display around major macro data releases. Understanding gold price and mining equities helps contextualise why these transmission channels matter so greatly for ASX-listed producers.
-
US Dollar Channel: A softer-than-expected core CPI reduces the probability of near-term Fed tightening, which typically exerts downward pressure on the US dollar. Since gold is globally priced in USD, a weaker dollar effectively reduces the cost of bullion for international buyers, supporting demand and underpinning the spot price
-
Real Yield Channel: Core CPI data directly influences US Treasury real yields, calculated as nominal yields minus inflation expectations. When real yields stabilise or decline, the opportunity cost of holding non-yielding assets like gold falls, making bullion relatively more attractive in portfolio allocation terms
-
Sentiment Channel: CPI outcomes shape the broader risk appetite environment. A contained core reading reduces systemic fear around policy tightening cycles, which can lift beaten-down resource equities even before gold prices themselves move materially higher
Gold's Bear Market Starting Point and the Asymmetric Opportunity It Creates
Gold had retreated sharply from record highs set in late January 2026, entering bear market territory as USD strength and rising rate expectations compressed bullion's appeal. Spot gold was trading near US$4,174.49 per ounce as of 10 June 2026, with market positioning reflecting significant accumulated pessimism.
This starting point matters enormously for how investors should interpret a neutral-to-positive CPI outcome. When a sector has already absorbed substantial negative sentiment into valuations, even the removal of an incremental bearish catalyst can produce a disproportionate price response. The asymmetric positioning dynamic means that the absence of additional bad news can itself function as a catalyst for relief trading.
In addition, gold as a safe haven tends to regain its appeal precisely when macro uncertainty persists but rate-tightening expectations are simultaneously receding — the precise configuration the May 2026 data delivered.
When negative macro scenarios are already embedded in equity valuations, a data outcome that merely fails to confirm the worst-case scenario can trigger a recovery that appears disconnected from the modest improvement in fundamentals. This is not irrationality; it is the mechanics of mean reversion operating on an oversold asset class.
ASX Gold Miners: Rate Sensitivity and Current Positioning
Two names that encapsulate this dynamic particularly well are Northern Star Resources (ASX: NST) and Evolution Mining (ASX: EVN). Both had been under sustained pressure through the gold bear market phase and both carry meaningful operational leverage to bullion price movements.
| Variable | Direction After Soft Core CPI | Impact on NST and EVN |
|---|---|---|
| USD Index | Stabilises or weakens | Positive (gold priced in USD) |
| US 10-Year Real Yield | Falls or holds | Positive (lower opportunity cost) |
| Spot Gold Price | Supported, mild recovery | Direct positive for revenue |
| AUD/USD | Tends to strengthen | Mixed (higher AUD partially offsets gold gains) |
| Market Risk Sentiment | Improves | Positive for equity valuations |
One nuance worth noting for Australian investors is the AUD/USD dynamic. A weakening USD typically lifts the Australian dollar simultaneously, which means the gold price benefit for local producers is partially offset at the revenue translation stage. Northern Star and Evolution Mining both report earnings in Australian dollars, meaning their net benefit from a USD gold price recovery depends partly on how sharply the AUD appreciates in response.
How US CPI Transmission Reaches ASX Technology Stocks
Duration Sensitivity: Why Rate Expectations Hit Growth Stocks Hardest
Technology and AI-oriented equities sit at the extreme end of the duration sensitivity spectrum within equity markets. Their valuations are built on the premise of significant earnings growth materialising years into the future, and those future cash flows must be discounted back to present value using a rate that reflects the prevailing interest rate environment.
When rate expectations rise, the discount rate applied to those distant earnings increases, mechanically compressing the present value of the stock and pushing multiples lower. This is not merely a theoretical observation; it explains why the ASX All-Tech Index and global AI-exposed names experienced particularly severe drawdowns during the periods of most aggressive rate-hike pricing in 2022-23 and again in the lead-up to the May 2026 CPI release.
The AI and Semiconductor Selloff Context
Global AI and semiconductor stocks experienced a pronounced selloff in the period preceding the May 2026 CPI release, driven by fears that persistently elevated inflation would prevent the Fed from moving toward an easing posture. ASX-listed technology companies with exposure to global AI infrastructure themes were caught in this broader derating cycle.
The softer core CPI reading does not constitute a definitive catalyst for a sustained sector recovery. What it does accomplish is the removal of one of the primary bearish arguments that had been bearing down on valuations. In a market where confidence is fragile, eliminating a known headwind is a meaningful, if modest, positive.
The ASX All-Tech Index has historically demonstrated sharp reactions to US inflation surprises in both directions. Consequently, encouraging US CPI data has previously produced swift recoveries across both gold and technology-oriented segments of the market. Prior CPI release sessions have demonstrated the index can move materially within a single trading day when the print diverges from consensus, making these events genuine high-risk, high-opportunity windows for investors with established views.
The RBA Dimension: Domestic Policy in a Global Inflation Context
Why the Fed's Inflation Environment Shapes the RBA's Options
The Reserve Bank of Australia operates within a global financial system where US Federal Reserve policy decisions transmit through bond markets, capital flows, and exchange rate dynamics. A US environment in which the Fed maintains an on-hold posture, supported by contained core inflation, reduces the external pressure on the RBA to match rate movements to defend the Australian dollar and manage imported price pressures.
With the RBA scheduled to meet on 16 June 2026, the global inflation backdrop feeds directly into the Board's deliberations. The May 2026 US CPI data, taken as a whole, provides the RBA with modest additional room to assess domestic conditions on their own merits rather than reacting to externally generated rate pressure. This dynamic is particularly relevant when assessing Australian share market performance across rate-sensitive sectors following major US data releases.
| Factor | Pre-CPI Assessment | Post-CPI Soft Core Adjustment |
|---|---|---|
| Global rate hike urgency | Elevated | Reduced |
| AUD/USD pressure | Downward | Stabilised |
| Domestic inflation spillover risk | Moderate | Unchanged |
| RBA June 16 hike probability | Uncertain | Slightly reduced |
| ASX rate-sensitive sectors outlook | Cautious | Mildly improved |
The Mixed Signal Problem and Data Dependency
The energy-driven headline spike cannot be entirely dismissed. If geopolitical oil supply disruptions persist beyond the near term, there is a non-trivial risk that elevated fuel costs begin feeding into transport, logistics, and broader input pricing for Australian businesses. Central banks globally, including the RBA, remain alert to this second-round effects risk even when the immediate core reading appears contained.
The net interpretation positions the RBA's June decision as genuinely data-dependent rather than predetermined. Moreover, two-year yield signals have historically provided early warning of shifting rate expectations that flow through to both the RBA's posture and ASX valuations. A further rate increase in 2026 remains a live possibility, but the composition of the May 2026 US CPI print reduces its probability at the margin.
Furthermore, central bank gold demand remains a structural underpinning for bullion prices that persists independently of short-term inflation data fluctuations, providing an additional layer of support beneath the cyclical dynamics described above.
The next major ASX story will hit our subscribers first
Strategic Framework: Positioning ASX Portfolios Around CPI Volatility
A Five-Step Decision Framework for Inflation Data Events
When interpreting US CPI releases for ASX portfolio positioning, a structured analytical filter prevents reactive decision-making driven by headline numbers that may not reflect policy-relevant inflation dynamics.
-
Identify the composition first — determine whether the headline movement is driven by volatile categories such as energy and food, or whether it reflects structural components including services, shelter, and rents
-
Assess the core month-on-month reading — the monthly core figure, not the annual headline, is the most timely indicator of whether inflationary momentum is accelerating or contained
-
Map the Fed response probability — evaluate how the data shifts the distribution of near-term rate outcomes, paying attention to Fed communication patterns and prior guidance
-
Evaluate sector positioning relative to embedded pessimism — identify which ASX sectors have already priced in a deteriorating macro environment and which remain exposed to further valuation compression
-
Factor in the AUD/USD transmission effect — account for the currency offset when assessing the net benefit of a weaker USD for Australian resource producers whose revenues translate through the exchange rate
The Energy Spike, Calm Core Playbook: Practical Implications
The May 2026 CPI configuration, a 4.2% headline driven by energy with a +0.2% core print below consensus, represents a specific and recognisable macro pattern with identifiable implications across ASX asset classes.
-
ASX gold miners (NST, EVN): A relief trade becomes structurally plausible. Significant negative macro pressure was already embedded in valuations ahead of the release, and the softer core removes the incremental bearish catalyst that could have extended the bear market
-
ASX technology stocks: Rate hike fears recede at the margin, providing cautious valuation support. Confidence across the sector remains fragile and requires further corroborating disinflation data before a sustained re-rating becomes likely
-
AUD/USD dynamics: Mild stabilisation as USD pressure eases, with the currency offset partially neutralising the gold price tailwind for Australian producers
-
RBA outlook: The on-hold bias is marginally reinforced, reducing the probability of a surprise rate increase at the June meeting given the global inflation context
FAQ: US CPI, ASX Gold, and Tech Stocks
What is core CPI and why does it matter more than headline CPI for ASX investors?
Core CPI excludes food and energy to isolate the persistent underlying inflation trend. Because food and energy are highly volatile and frequently driven by temporary external factors including geopolitical events and weather disruptions, central banks use core CPI to assess whether inflation is becoming structurally entrenched. For ASX investors, core CPI is the more reliable predictor of future interest rate decisions and therefore the more analytically useful figure when assessing the macro environment for rate-sensitive sectors.
How does a high US CPI reading affect ASX gold stocks?
An elevated headline CPI reading creates short-term headwinds for gold equities primarily through two mechanisms. First, it can strengthen the US dollar by raising rate expectations, making gold more expensive for non-USD buyers and compressing demand. Second, higher rate expectations increase the opportunity cost of holding non-yielding bullion relative to interest-bearing alternatives. However, when the high headline is concentrated in energy rather than structural components, the negative impact on gold equities is substantially reduced.
Why do ASX technology stocks react to US inflation data?
ASX technology companies, particularly those with exposure to growth themes including AI and semiconductors, carry elevated valuation multiples based on expectations of substantial future earnings. When US inflation data implies higher interest rates ahead, the discount rate applied to those future earnings rises and current valuations compress mechanically. Softer inflation data reduces rate pressure and supports the present-value calculations underpinning high-multiple growth stocks across both the ASX and global exchanges.
Can gold and technology stocks benefit simultaneously from the same CPI outcome?
Yes, and the May 2026 configuration involving US CPI and ASX gold and tech is an example of exactly this scenario. When headline CPI is elevated but core inflation remains contained, gold benefits from reduced real yield pressure and a stabilising USD while technology stocks benefit from receding rate hike fears reducing their valuation discount rates. This convergence is most likely when inflation is demonstrably geopolitical and energy-driven rather than broad-based across the consumer price basket.
Key Takeaways for ASX Investors Navigating US CPI Releases
-
The 4.2% May 2026 headline figure is primarily an energy and geopolitical story, not evidence of entrenched broad-based inflation; investors who treat it as the latter risk constructing the wrong portfolio response
-
Core CPI at +0.2% month-on-month, below consensus, is the analytically significant data point, materially reducing the probability of near-term Federal Reserve rate action
-
ASX gold miners carry asymmetric recovery potential in this environment given the extent of negative sentiment already embedded in valuations prior to the CPI release
-
ASX technology stocks face a cautiously improving backdrop as rate hike fears recede, though sustained recovery across the sector requires additional confirmation that the disinflation trend is durable
-
The RBA's 16 June 2026 meeting incorporates this global inflation context, with the soft core reading providing marginal additional justification for an on-hold decision
-
Prioritising core CPI trend over headline volatility is the discipline that separates informed medium-term positioning from reactive trading driven by numbers that frequently tell the wrong story
This article is general in nature and does not constitute financial advice. Past performance of any asset class, sector, or individual security is not a reliable indicator of future results. Readers should conduct their own research and seek independent financial advice before making any investment decisions. All figures and data referenced relate to the period covered in the analysis and may be subject to revision.
Want To Stay Ahead of ASX Discoveries Before the Market Moves?
While understanding macro signals like US CPI data is essential for portfolio positioning, the most transformative returns on the ASX have historically come from being early to significant mineral discoveries — and Discovery Alert's proprietary Discovery IQ model delivers real-time alerts the moment major ASX discoveries are announced, turning complex data into actionable opportunities for investors at every experience level. Explore historic discovery returns that illustrate just how substantial early positioning can be, and begin your 14-day free trial today to ensure you never miss the next major find.