June 11, 2026
The Macro Forces Compressing Gold Right Now
Understanding why the gold price is down and when gold will explode requires stepping back from headlines and examining the mechanical architecture of how global capital flows actually work. Gold does not fall because investors lose faith in it as a long-term store of value. It falls because of predictable, measurable interactions between interest rates, currency markets, and commodity-driven liquidity dynamics. The current correction is no different, and recognising these forces is the first step toward understanding when the next major rally could ignite.
Gold's Fundamental Tension With Real Interest Rates
Gold is a non-yielding asset. It pays no coupon, no dividend, and no interest. This means it competes directly with interest-bearing instruments for investor capital, and when real interest rates rise, the opportunity cost of holding gold increases significantly. Institutional capital, which operates on a relative return basis, rotates toward bonds and cash when yields become attractive enough to justify the move.
This is not a new dynamic. It has governed gold's short-term behaviour across multiple market cycles. The critical insight for investors is recognising that this is a cyclical headwind, not a structural one. Furthermore, real interest rates do not stay elevated indefinitely, particularly in an environment of extreme sovereign debt accumulation.
The U.S. Dollar as Gold's Shadow Adversary
The relationship between gold and the U.S. Dollar Index (DXY) is one of the most consistent inverse correlations in financial markets. When the dollar strengthens, gold faces a compound headwind: it becomes more expensive in local currency terms for non-U.S. buyers, which suppresses global demand, whilst simultaneously signalling tighter financial conditions that reduce speculative appetite for commodities broadly.
"Gold and the dollar are engaged in a zero-sum contest for global reserve credibility. When one rises, the other typically retreats, not due to a shift in intrinsic merit, but because of the mechanics of currency-denominated purchasing power."
When big ASX news breaks, our subscribers know first
What Is Actually Driving the Gold Price Down Right Now
The Oil-Inflation-Yield Chain Reaction
The current weakness in gold traces directly to a geopolitical trigger that set off a cascade of macro consequences. Conflict in the Middle East, specifically disruptions to critical oil transit infrastructure, pushed crude prices sharply higher. This sequence placed gold under pressure through a very specific and traceable chain reaction:
- Oil prices surge as supply routes face disruption and geopolitical risk premiums build
- Inflation expectations rise as markets reprice the cost of energy across the global economy
- The 10-year U.S. Treasury yield spikes in anticipation of persistent inflationary pressure
- The U.S. dollar strengthens as higher yields attract capital and increase demand for dollar-denominated assets
- Real interest rates climb, reducing gold's relative attractiveness compared to yield-bearing alternatives
- Gold corrects as institutional investors reduce exposure in favour of higher-yielding instruments
This is not a collapse in gold's fundamental thesis. It is a mechanical response to a specific macro sequence, and crucially, every link in this chain is reversible once the underlying geopolitical catalyst resolves.
The Liquidity Scramble Most Investors Overlook
One of the least understood dynamics currently pressuring gold is the global dollar liquidity scramble triggered by rising oil prices. Because oil is predominantly priced and settled in U.S. dollars, a sharp rise in crude prices creates immediate and urgent demand for dollar liquidity among oil-importing nations.
To source those dollars rapidly, sovereign entities and large institutional investors must sell their most liquid dollar-denominated assets. The most liquid dollar-denominated asset class in the world is U.S. Treasury securities. This selling pressure drives Treasury yields higher and simultaneously strengthens the dollar, creating an environment that looks like a conventional bond market selloff but is actually something more mechanical: a commodity-driven liquidity conversion.
"This dynamic explains why gold can fall during periods of apparent geopolitical stress. The scramble for dollar liquidity temporarily overrides gold's traditional safe-haven function, confusing investors who expect the metal to rise whenever uncertainty increases."
The 10-Year Treasury Yield: The Variable That Controls Everything
| Metric | Current Environment | Gold Impact |
|---|---|---|
| 10-Year U.S. Treasury Yield | Elevated (~4.5%) | Negative: raises opportunity cost of gold |
| U.S. Dollar Index (DXY) | Strengthening | Negative: reduces global purchasing demand |
| Real Interest Rates | Rising | Negative: gold loses relative appeal vs. bonds |
| Inflation Expectations | Elevated but uncertain | Mixed: short-term pressure, long-term support |
| Oil Price Trajectory | Elevated on conflict premium | Negative via yield and dollar channel |
A Technically Normal Correction After an Extraordinary Rally
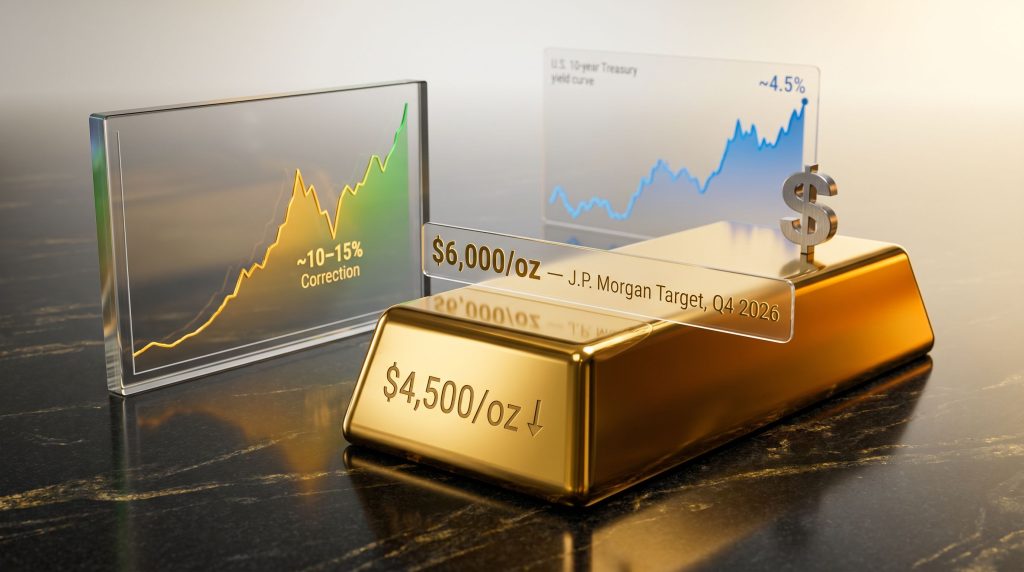
Context matters enormously when assessing gold's current pullback. The metal had experienced a near-tripling in value over approximately 12 to 18 months, reaching levels in the vicinity of $5,500 per ounce. The subsequent correction to around $4,500 per ounce represents a decline of roughly 10 to 15%, which falls squarely within the range of normal consolidation behaviour observed in every major gold bull market on record.
Major gold bull markets have consistently featured corrections in the 10 to 20% range before resuming their primary upward trend. Investors who have historically exited positions during these phases have frequently missed the most substantial subsequent gains. For context on broader price trajectories, the gold price forecast for 2025 outlines the key upward momentum drivers that remain structurally intact.
Is the Gold Correction Normal? A Historical Perspective
Gold's Long-Term Trend vs. Short-Term Volatility
Gold's 25-year price history reveals a consistent and instructive pattern: an upward structural trend punctuated by sharp but temporary corrections. The metal has never appreciated in a straight line, and the current environment is not exceptional in that regard.
Characteristics of gold's typical correction cycles:
- Corrections of 10 to 20% are common within broader bull markets and do not signal trend reversals
- Corrections are typically triggered by identifiable macro catalysts such as rate hikes, dollar strength, or liquidity events
- Recovery phases have historically been driven by monetary policy shifts, particularly easing cycles and quantitative expansion
- Physical gold holders have consistently outperformed those who traded in and out during correction phases
Comparing Current Conditions to Historical Gold Corrections
| Period | Trigger | Correction Depth | Recovery Driver |
|---|---|---|---|
| 2008 Financial Crisis | Global liquidity crunch | ~30% | QE1 and Federal Reserve easing |
| 2011 to 2015 Bear Phase | Rising real interest rates | ~45% | Structural demand shift, EM buying |
| 2020 COVID Correction | Acute liquidity panic | ~12% | Massive monetary and fiscal stimulus |
| Current Correction | Oil/inflation/Treasury yield spike | ~10 to 15% | Anticipated rate cuts and potential QE |
What Will Trigger the Next Major Gold Rally
The Monetary Policy Pivot: When Rate Cuts Reshape the Equation
The most powerful near-term catalyst for gold's next upward leg is a definitive shift in U.S. monetary policy. When the Federal Reserve begins cutting rates or signals an extended pause, real interest rates decline, the dollar loses relative support, and institutional capital begins rotating back toward non-yielding assets including gold.
A return of 10-year Treasury yields toward the 4% level or below would represent a meaningful shift in the macro backdrop, materially improving gold's relative attractiveness against bonds. Once geopolitical tensions ease and oil price premiums unwind, the yield compression that follows could act as a powerful re-ignition mechanism for gold demand. Understanding gold and bond dynamics across economic cycles helps clarify precisely why this relationship is so pivotal.
The $350 Trillion Debt Overhang: Gold's Most Powerful Long-Term Catalyst
Perhaps the most structurally compelling argument for gold's long-term trajectory is the arithmetic of global sovereign debt. Total global debt is estimated at approximately $350 trillion, and the ability of major governments to sustain elevated interest rates against this debt load is increasingly constrained.
The United States in particular faces acute fiscal stress at rates above 4.5% on the 10-year bond. Debt servicing costs at these levels consume a growing and ultimately unsustainable share of federal revenue. This creates a fiscal ceiling on how long high rates can be maintained, regardless of the Federal Reserve's stated intentions.
"The longer interest rates remain at current levels, the more inevitable a policy response becomes. History consistently shows that when governments face a choice between fiscal solvency and monetary discipline, the printing press wins. That outcome, when it arrives, is among the most powerful structural tailwinds gold can experience."
Quantitative Easing: The Catalyst That Could Make Gold Explode
The first round of quantitative easing following the 2008 financial crisis preceded a major gold bull run. The second round of QE deployed during and after the COVID-19 pandemic similarly coincided with sharp gold price appreciation. The structural case for a third round of QE, driven by the fiscal impossibility of sustaining high rates on the current scale of global debt, is becoming increasingly discussed among macro analysts.
If a third QE cycle materialises, its scale would likely dwarf the first two rounds given the magnitude of debt that would need to be monetised. According to analysts assessing gold's 2026 outlook, the implications for gold would be significant across multiple channels:
- Money supply expansion dilutes the purchasing power of fiat currency, increasing gold's relative value
- Suppression of real interest rates removes the primary headwind currently holding gold back
- Signals of fiscal stress increase safe-haven demand from both institutional and sovereign buyers
- Dollar weakening makes gold cheaper for international buyers, expanding the global demand base
- Erosion of confidence in Treasury bonds as a risk-free asset redirects capital toward hard assets
Geopolitical Resolution as a Near-Term Release Valve
A diplomatic resolution to current Middle Eastern conflict, or a ceasefire, would likely trigger a rapid unwinding of the oil price risk premium. This would ease inflation expectations, reduce pressure on Treasury yields, and stabilise the dollar, all of which directly benefit gold. The sequence would unfold through these steps:
- Oil prices decline as supply risk and geopolitical premium compress
- Inflation expectations moderate, reducing upward pressure on long-term bond yields
- The 10-year Treasury yield retreats toward more sustainable levels, potentially back toward 4%
- Dollar demand normalises as the dollar liquidity scramble tied to oil prices eases
- Gold recovers its safe-haven premium and institutional demand rebuilds
Diplomatic negotiations are reportedly ongoing between relevant parties, with strong economic motivations on multiple sides to reach a resolution. The timing remains uncertain, but the directional implication for gold once a deal is struck is well-understood.
What Do Major Institutions Forecast for Gold
Institutional Price Targets and the Conditions Behind Them
| Institution | Gold Price Target | Timeframe | Key Conditions |
|---|---|---|---|
| J.P. Morgan | ~$6,000/oz | Q4 2026 | Geopolitical risk reduction, Fed easing cycle |
| J.P. Morgan (extended) | ~$6,300/oz | End of 2027 | Dollar weakness, sustained central bank buying |
| Broader market consensus | Near-term downside risk | Short-term | If dollar stays strong and Fed holds rates |
"Important disclaimer: Institutional price forecasts carry significant inherent uncertainty. Gold's trajectory is highly sensitive to policy decisions, geopolitical developments, and macroeconomic data points that are inherently difficult to predict with precision. These figures should not be treated as guaranteed outcomes or as financial advice."
Bull Case vs. Bear Case for Gold
Bull Case: Conditions favouring a major gold rally
- The Federal Reserve pivots to a rate-cutting cycle or launches a new round of quantitative easing
- The U.S. dollar weakens materially as rate differentials narrow against other currencies
- Middle Eastern conflict resolves, removing the oil price premium and easing inflation expectations
- Central bank gold buying accelerates, adding structural demand that underpins the long-term thesis
- U.S. fiscal stress intensifies, undermining long-term confidence in Treasury bonds as a safe haven
Bear Case: Conditions that could extend the correction
- The Federal Reserve maintains a higher-for-longer interest rate stance beyond current expectations
- The dollar remains elevated on sustained global dollar liquidity demand tied to commodity markets
- Inflation stays persistently above target, keeping real interest rates high and gold unattractive
- Geopolitical tensions persist without diplomatic resolution, maintaining oil and yield pressure
- Technical selling continues as leveraged traders reduce positions following the extended prior rally
Key Price Levels and Market Signals to Monitor
What to Watch Before the Next Gold Breakout
- 10-Year U.S. Treasury Yield: A sustained decline back below 4.0% would signal a materially improved macro backdrop for gold
- U.S. Dollar Index (DXY): A confirmed break below key technical support levels would remove one of the primary headwinds
- Oil Price Trajectory: Declining crude prices would signal easing inflation expectations and reduced dollar demand pressure
- Federal Reserve Communication: Any shift in language toward rate cuts, a pause extension, or QE signalling would act as a significant bullish trigger
- Central Bank Buying Data: Continued or accelerating sovereign gold purchases signal structural long-term demand that underpins the bull case
- U.S. Fiscal Data: Deteriorating debt servicing metrics or widening deficits increase the probability of a monetary policy response
The next major ASX story will hit our subscribers first
Frequently Asked Questions: Gold Price Weakness and Future Outlook
Why is the gold price falling if inflation is high?
High inflation typically supports gold over the long term, but when rising inflation expectations cause bond yields to spike faster than gold can respond, the stronger dollar and higher real rates create a temporary suppression effect. This is a mechanical short-term response, not a signal that gold has lost its properties as gold as an inflation hedge. The distinction matters enormously for investors assessing whether to hold or exit positions.
Is now a good time to buy gold?
This is entirely dependent on individual risk tolerance, investment horizon, and portfolio objectives. Historically, corrections within broader gold bull markets have represented accumulation opportunities for long-term holders. However, near-term downside risk remains if interest rates stay elevated, the dollar strengthens further, or geopolitical tensions persist. This should not be construed as financial advice.
How much has gold corrected from its recent highs?
Gold has pulled back approximately 10 to 15% from its recent peak near the $5,500 per ounce level, settling around the $4,500 per ounce range. This correction magnitude is consistent with historical consolidation patterns observed within major secular gold bull markets and does not, on its own, signal a trend reversal.
What would cause gold to explode higher?
The most powerful catalysts for a sharp gold rally include a Federal Reserve rate-cutting cycle, the launch of a third round of quantitative easing, a significant and sustained weakening of the U.S. dollar, resolution of Middle Eastern geopolitical tensions that removes the oil price premium, and renewed large-scale institutional and central bank gold buying. A combination of these factors arriving simultaneously would represent an exceptionally bullish environment for gold. Notably, gold in recessions has historically demonstrated its strongest performance during periods of monetary easing.
Should I sell my gold during a correction?
Most long-term macro analysts with a structurally bullish view on gold argue against selling physical holdings during corrections. The structural drivers underpinning the bull case, including the $350 trillion global debt load, monetary policy constraints, and geopolitical uncertainty, remain firmly intact. Short-term price volatility does not alter these fundamentals. This should not be interpreted as personalised financial advice.
The Strategic Case for Holding Gold Through Volatility
Why Physical Gold Holders Occupy a Different Position
Physical gold holders are insulated from the forced selling dynamics that affect leveraged traders, ETF investors managing redemption pressure, and commodity funds operating under margin requirements. The structural argument for physical gold ownership is rooted in long-term monetary dynamics, specifically the progressive debasement of fiat currency through debt monetisation, rather than short-term price performance.
Investors holding allocated physical gold have no counterparty risk, no margin calls, and no redemption pressure. This positional stability allows them to hold through corrections that flush out leveraged participants, frequently positioning them to benefit from the subsequent recovery phase.
The Asymmetric Risk Profile in a QE Environment
If quantitative easing returns at the scale that the fiscal arithmetic of $350 trillion in global debt implies, the upside scenario for gold could be disproportionately large relative to the current correction depth. The downside in the current environment is a further 5 to 10% decline if macro headwinds persist. The upside, in a scenario where QE is deployed at historically unprecedented scale, is substantially larger.
Furthermore, as financial analysts continue to debate how low gold can realistically go, the prevailing structural view among long-term macro investors remains firmly bullish given the debt dynamics at play.
"Gold's 25-year price trend has remained consistently upward despite multiple corrections that exceeded the current pullback in both depth and duration. Investors who have held through prior corrections have historically been rewarded when monetary conditions eventually shifted in gold's favour. Past performance does not guarantee future results, but the structural pattern is instructive."
Summary: The Correction Is the Setup, Not the Ending
Key Takeaways for Gold Investors
- Gold is under pressure due to elevated U.S. Treasury yields, a strengthening dollar, and oil-driven inflation expectations, all of which are temporary and identifiable macro forces rather than structural breakdowns
- The current 10 to 15% correction from the $5,500/oz peak to approximately $4,500/oz is historically normal within major gold bull markets and consistent with every prior major cycle
- The global dollar liquidity scramble triggered by oil price surges is a mechanical, reversible dynamic that temporarily overrides gold's safe-haven function
- $350 trillion in global debt creates a structural ceiling on how long high interest rates can be sustained, making monetary easing and potential QE increasingly probable
- A third round of quantitative easing, if it materialises at the scale implied by current debt levels, could represent the most powerful structural catalyst gold has encountered in the modern era
- J.P. Morgan projects gold reaching approximately $6,000/oz by Q4 2026 and $6,300/oz by end-2027 under conditions of Fed easing and continued central bank buying
- Long-term physical gold holders are structurally positioned to benefit from the monetary policy endgame that the current debt environment is making increasingly inevitable
Understanding why the gold price is down and when gold will explode is ultimately about recognising the difference between cyclical headwinds and structural breakdowns. The current environment reflects the former, not the latter, and that distinction is what separates informed long-term investors from those who capitulate at precisely the wrong moment.
This article is intended for informational and educational purposes only and does not constitute financial advice. Precious metals investing involves risk, and past performance is not indicative of future results. Readers should consult a qualified financial adviser before making investment decisions.
Want To Capitalise On The Next Major Gold Discovery Before The Market Catches On?
While the macro forces compressing gold prices are cyclical and reversible, savvy investors know that major mineral discoveries on the ASX can deliver extraordinary returns regardless of broader market conditions — and Discovery Alert's proprietary Discovery IQ model delivers real-time alerts the moment significant discoveries are announced, transforming complex geological data into actionable opportunities. Explore Discovery Alert's dedicated discoveries page to see the historic returns generated by major mineral finds, and begin your 14-day free trial today to position yourself ahead of the broader market.