June 11, 2026
When the Foundation of Global Finance Starts to Shift
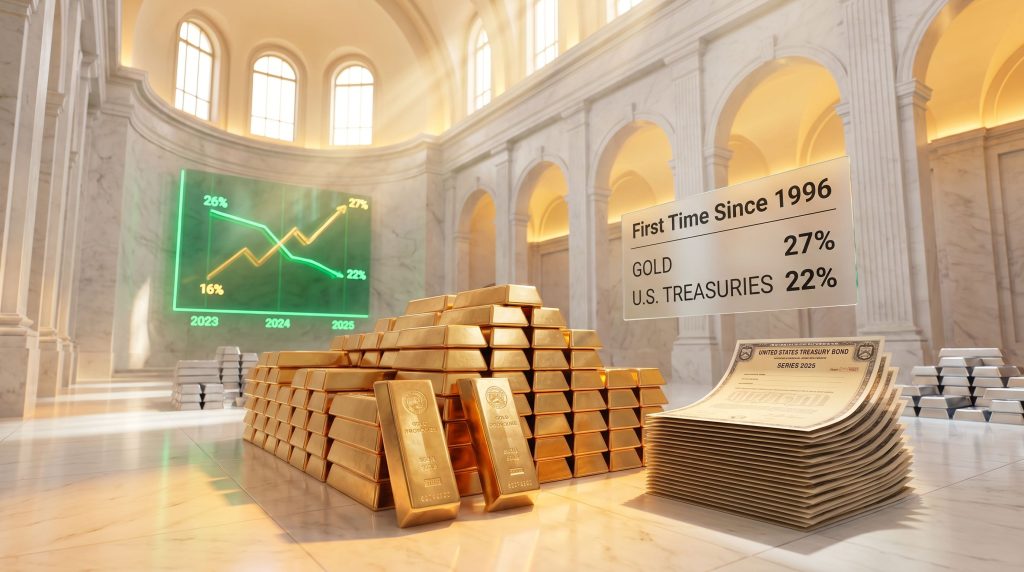
For decades, the architecture of global reserve management rested on a relatively stable assumption: U.S. Treasury securities were the world's premier store of sovereign wealth. Central banks accumulated them not merely as yield-generating instruments but as symbols of systemic trust. That assumption is now being structurally renegotiated, and gold surpassing US treasuries as the largest reserve asset is no longer speculative — the evidence is clear and measurable.
By the close of 2025, gold accounted for approximately 27% of total official global foreign reserves, overtaking U.S. Treasuries, which had declined to roughly 22%. According to ECB-based reserve composition reporting, this marks the first time gold has held a larger share than U.S. government debt since 1996. Understanding why this threshold has been crossed, and what it signals for every major asset class, requires looking well beyond the headline figure.
When big ASX news breaks, our subscribers know first
The Reserve Asset Hierarchy: How We Got Here
Measuring the Shift: Market Value vs. Physical Accumulation
Reserve composition is measured by market value, which means gold's rise in percentage terms reflects two distinct forces working simultaneously. The first is price appreciation. Gold's multi-year rally has mechanically inflated its share of global reserves even without a single additional bar being purchased. The second is deliberate accumulation. Central bank gold reserves have run at historically elevated levels since 2022, adding a structural dimension that pure price appreciation alone cannot explain.
A critical analytical distinction must be made here: if gold prices were held constant at their 2023 levels, U.S. Treasuries would still rank ahead. The shift is therefore a valuation-amplified trend, not a sudden flight from dollars. That context does not diminish the signal, but it does prevent misreading the magnitude.
The reserve inversion is real, but it is driven by price appreciation combined with sustained institutional purchasing, not a sudden collapse in Treasury demand alone. The direction of the trend matters as much as the current snapshot.
The table below illustrates how dramatically the composition of global foreign reserves has shifted across just a two-year window:
| Metric | 2023 (Estimated) | 2025 (Reported) |
|---|---|---|
| Gold Share of Global FX Reserves | ~16% | ~27% |
| U.S. Treasury Share | ~26% | ~22% |
| U.S. Dollar Share (Total FX) | ~59% | ~57% |
| Euro Share | ~20% | ~20% |
1996 vs. 2025: Two Very Different Contexts
The last time gold led Treasuries in reserve composition was 1996, but the parallel ends there. In the mid-1990s, gold's relative weight reflected a legacy holdover from the Bretton Woods era, with central banks actually selling gold into the market throughout that decade. Today's dynamic is the opposite: central banks are buyers, and the geopolitical logic underpinning that purchasing behaviour is deeply different from anything seen in the post-war period. Furthermore, gold in the monetary system has taken on a renewed strategic significance that simply did not exist during the 1990s sell-off era.
The Bond Market Is Where the Real Risk Lives
Why $145 Trillion Dwarfs Every Other Market
While market commentary tends to fixate on equities, particularly the performance of large-cap technology stocks, the bond market represents the actual foundation upon which every other asset class is built. At approximately $145 trillion, the global bond market is roughly $20 trillion larger than the global equity market. More importantly, bond yields set the cost of debt, and debt cost is the single most consequential input into corporate earnings, government solvency, and financial system stability.
Rising bond yields are not a passive market signal. They are the price mechanism through which capital punishes perceived risk. When sovereign bond yields rise without corresponding central bank rate increases, it signals that the bond market itself is repricing the creditworthiness of the issuer. That is precisely what is occurring across G7 nations simultaneously.
Key observations from the 2025 sovereign bond landscape include:
- U.S. 10-year Treasury yield rose approximately 75 basis points in 2025 without a corresponding Federal Reserve rate hike
- UK gilts, German bunds, Japanese government bonds, French OATs, and Canadian bonds are all trading at multi-decade yield highs
- Bloomberg's five-year annualised return on aggregate global bonds reached its lowest level on record
How Rising Yields Cascade Through Every Asset Class
The transmission mechanism from rising bond yields to broader financial stress is systematic. Stock buybacks, which have underpinned much of the S&P 500's upward trajectory over the past decade, rely on cheap corporate debt. When debt costs rise, buyback capacity shrinks. Capital expenditure programmes similarly depend on affordable financing.
Private equity and private credit markets, which are architecturally dependent on low-rate environments, begin to experience stress when yields climb. The global derivatives market, estimated to be roughly four times the size of all global assets and ten times the scale of the 2008 exposure, is also rate-sensitive in ways that are rarely discussed in mainstream financial commentary.
When the cost of money rises structurally rather than cyclically, every leveraged asset class faces a reckoning simultaneously.
The Collapse of the Stocks-Bonds Inverse Relationship
For generations of portfolio managers, the inverse relationship between stocks and bonds served as the foundational logic of multi-asset diversification. When equities fell, bond prices rose, providing a ballast. That relationship has broken down in a historically significant way.
| Crisis Period | Stock Market | Bond Market | Gold Behaviour |
|---|---|---|---|
| 2008 GFC | Sharp decline | Safe haven bid | Initial ~30% drop, then strong recovery |
| March 2020 | Sharp decline | Fell alongside stocks | Fell before QE reversal |
| 2022 (Higher for Longer) | Worst returns since 1871 | Worst returns since 1871 | Held relative value |
| April 2025 (Liberation Day) | Declined | No bid, fell simultaneously | Outperformed as alternative |
The April 2025 tariff announcement event, widely referred to as Liberation Day, produced a particularly revealing signal: there was effectively no bid in the bond market on the first day of the announcement. Stocks and bonds fell in tandem, confirming that the traditional yin-and-yang relationship between these two asset classes has fundamentally changed.
How the 2022 Dollar Weaponisation Changed Reserve Strategy
A Watershed Moment in Monetary Geopolitics
The decision to freeze Russian sovereign foreign exchange reserves in 2022 represented one of the most consequential events in 21st-century monetary history. For the first time, a major sovereign holder of U.S. Treasuries discovered that those holdings carried geopolitical counterparty risk. The implicit assumption that reserve assets held in U.S. dollars or U.S. government securities were inviolable was permanently broken.
The institutional response has been rational and measurable. According to recent reporting, gold surpassing US treasuries as the largest reserve asset reflects a broader structural shift in how sovereigns assess risk:
- More than 40 nations have been conducting trade outside the U.S. dollar framework since 2022
- Nearly 40 countries have openly repatriated physical gold within their own borders
- Central bank gold buying has increased approximately 5x from 2022 levels as of 2025
- Approximately 20% of global oil sales are now being settled outside the petrodollar system
Infrastructure Being Built to Bypass the Dollar System
Several concrete financial mechanisms have emerged to facilitate dollar-alternative trade settlement. BRICS Pay, the mBridge cross-border payment platform, and the proposed BRICS unit represent genuine infrastructure development, not merely political rhetoric. While none of these systems currently threatens dollar dominance in absolute terms, their existence signals a long-term directional commitment by a significant portion of the global economy.
Institutional Validation: When Even Sceptics Confirm the Trend
Several developments that might once have been dismissed as fringe gold advocacy have now been confirmed by mainstream institutional actors. Morgan Stanley, historically not a proponent of precious metals, has reportedly recommended shifting from a traditional 60/40 portfolio toward a 60/20/20 allocation in which gold takes a 20% weighting. The Bank for International Settlements, in a similarly understated move, formally designated gold as a Tier 1 capital asset alongside U.S. Treasuries — a quiet but unambiguous institutional signal.
The reduction in Treasury holdings by major foreign creditors further illustrates the structural shift:
| Country | Peak Treasury Holdings | Approximate 2025 Holdings | Primary Driver of Reduction |
|---|---|---|---|
| China | ~$1.3 trillion | ~$650 billion | De-dollarisation strategy |
| Japan | Largest foreign holder | Reduced sharply in Q1 2025 | Currency support requirements |
The Dollar's Future: Dominant but Directionally Weakened
Reserve Currency Inertia vs. Directional Momentum
The U.S. dollar retains clear reserve currency dominance. At approximately 57% of global foreign exchange reserves in 2025, no alternative comes close to displacing it in the near term. However, the relevant analytical metric is not the current level but the direction of change. The dollar's share has declined from approximately 80% to 57% over the past two decades — this is not a cyclical fluctuation but a structural erosion.
Reserve currency transitions historically unfold over decades, not years. The directional signal matters enormously for long-duration asset allocation decisions, even if the displacement of the dollar as the primary reserve currency remains a multi-generational timeframe event.
The Petrodollar Connection and Its Strategic Implications
One underappreciated dimension of dollar hegemony is the petrodollar system, through which oil-exporting nations historically recycled energy revenues into U.S. Treasury purchases. With approximately 20% of oil sales now occurring outside dollar settlement, this recycling mechanism is being gradually disrupted. The geopolitical implications of this disruption extend well beyond financial markets, touching on the strategic calculus of foreign policy decisions that are rarely framed in monetary terms publicly.
Silver's Structural Investment Case: Beyond Monetary Metal Status
Five Consecutive Years of 200-Million-Ounce Supply Deficits
Silver's investment thesis rests on a combination of monetary metal characteristics and a supply-demand dynamic that is structurally distinct from gold. The metal has experienced approximately five to six consecutive years of supply deficits estimated at around 200 million ounces annually, accumulating to a cumulative deficit exceeding one billion ounces. In addition, silver supply deficits have been growing in severity, making this not merely an abstraction but a sustained and growing gap between what the world produces and what it consumes.
| Metric | Data Point |
|---|---|
| Annual supply deficit (approx.) | ~200 million ounces per year |
| Cumulative deficit (5+ years) | Over 1 billion ounces |
| Silver lease rates (historical norm) | Below 1% |
| Silver lease rates (2025) | Above 8% |
| Silver classification status | Critical mineral (as of 2024) |
Silver lease rates, which historically traded below 1% for most of the past several decades, have risen above 8% in 2025. This is a rarely discussed technical indicator of acute physical scarcity. When lease rates spike, it signals that physical metal is genuinely difficult to borrow, reflecting tightness in the actual supply chain rather than just paper market positioning.
Why Silver Supply Cannot Simply Scale Up on Demand
A fundamental characteristic of silver that separates it from most other commodities is its nature as a byproduct metal. Approximately 70-80% of annual silver production comes as a secondary output from the mining of base metals such as copper, lead, and zinc. This means silver production cannot be meaningfully increased in response to price signals alone. A silver price doubling does not trigger a doubling of silver mines, as supply response is structurally constrained by the economics of the primary metals being extracted.
Industrial Demand Drivers That Cannot Be Substituted
Industrial demand for silver is concentrated in sectors experiencing structural growth, creating a demand profile that is unusually durable. Key demand drivers include:
- Solar photovoltaic panels, where silver is used in electrical contacts and cannot currently be substituted at scale
- Electric vehicles, which require silver in power electronics, battery management systems, and charging infrastructure
- Military and defence applications, where silver's unique electrical and thermal conductivity properties make it critical for advanced weapons systems and communications equipment
- Medical applications, leveraging silver's antimicrobial properties
Silver's formal classification as a critical mineral in 2024 acknowledges its strategic industrial importance and raises awareness among policymakers, though this does not constitute any specific project or company-level support.
The 200-Day Moving Average as a Directional Signal
For investors tracking silver from a technical perspective, the 200-day moving average has historically functioned as a meaningful inflection signal when price dips below it. The pattern across recent market cycles is instructive:
| Year of Signal | Silver Price at Signal | Subsequent Move |
|---|---|---|
| 2020 | ~$10-$11 | Significant rally to multi-year highs |
| 2022 | ~$17 | Continued northward trajectory |
| April 2025 | ~$27 | Over 200% gain to new historical highs |
This pattern is not a guaranteed trading signal, and past performance does not predict future results. However, the consistency of the signal across different macro environments lends it analytical weight when considered alongside the fundamental supply and demand picture.
The Gold-Silver Ratio as a Framework for Long-Term Positioning
Sophisticated long-term investors in precious metals often use the gold-silver ratio as an entry and exit framework rather than relying on absolute price levels. The ratio measures how many ounces of silver are needed to purchase one ounce of gold. Historically, extreme compression of this ratio toward the low teens or high single digits has signalled peak relative silver valuations. When the ratio is historically wide, silver represents better relative value than gold on a mean-reversion basis.
The strategic implication held by some experienced investors is that silver is accumulated during periods of high gold-silver ratio for its superior beta performance, with the eventual intention of converting silver gains into gold as the ratio compresses, maintaining continuous exposure to monetary metals across cycles.
"Save in the asset that holds value. Spend in the currency that loses it." This approach, rooted in centuries of monetary experience and formalised in Gresham's Law, underpins how sophisticated family offices and institutional precious metals investors structure their holdings.
The next major ASX story will hit our subscribers first
Gold Mining Equities: A Paradox of Record Earnings and Persistent Underperformance
Built-In Leverage That the Market Is Ignoring
Gold mining equities carry an inherent operational leverage to the gold price that is frequently underappreciated by generalist investors. If a major producer's all-in sustaining cost (AISC) is approximately $1,400 per ounce and spot gold trades at $4,400 per ounce, the resulting margin of $3,000 per ounce represents an extraordinary profit environment. As a rough rule of thumb, a 10% move in gold has historically translated to approximately a 30% move in mining equity valuations due to this operating leverage.
The paradox is that despite record earnings reported by major producers in 2025, the sector has persistently underperformed the metal itself. Consequently, the gold price impact on miners has not yet translated into the equity re-rating that the fundamental case would normally justify, with large producers selling off even after delivering strong results.
Why Generalist Institutions Remain Sceptical
Several structural factors explain why mainstream institutional capital has been slow to rotate into mining equities despite compelling fundamentals:
- Institutional memory of management failures, misaligned incentives, and cost blowouts from previous cycles
- The sector's reputation for inconsistency in free cash flow generation relative to stated guidance
- Generalist sell-side analysts historically avoiding or underweighting mining coverage due to sector complexity and distrust of management credibility
- Short-term sentiment cycles driven by day-to-day gold price volatility, causing retail and institutional investors to exit positions during normal price corrections
The Royalty Company Alternative
For investors seeking exposure to gold price appreciation with lower operational risk, royalty and streaming companies represent a distinct category. These entities finance mining operations in exchange for a percentage of future metal production at predetermined prices. This model insulates investors from direct exposure to cost inflation, labour disputes, or single-asset operational risk, while retaining meaningful leverage to gold prices. The category includes well-known entities such as Franco-Nevada, though individual investment suitability depends on current valuations and portfolio context. This does not constitute investment advice.
Management Quality and Insider Ownership as Key Variables
Experienced mining investors emphasise insider ownership levels and the quality of management track records as among the most differentiating variables between mining equities that create value and those that destroy it. Political ownership patterns and jurisdictional risk also factor significantly into professional assessments of project viability.
Inflation, Hard Assets, and Portfolio Positioning for Currency Debasement
Why Official CPI May Be Systematically Understating Real Price Pressures
The official Consumer Price Index methodology has been subject to decades of critique from economists and market practitioners who argue that substitution effects, hedonic adjustments, and changes in basket composition systematically understate the real inflation experienced by households. The divergence between producer price inflation and consumer price inflation creates a structural gap that compounds over time.
The purchasing power of the U.S. dollar against commodities since the abandonment of the Bretton Woods gold standard in 1971 provides a useful long-run perspective:
| Commodity | Approximate USD Purchasing Power Decline Since 1971 |
|---|---|
| Oil | ~96% |
| Copper | ~90% |
| Wheat | ~80% |
These commodities have not become intrinsically more valuable. The currency required to purchase them has lost purchasing power. This reframing is critical for investors trying to distinguish between genuine wealth creation and nominal return illusions.
Asset Classes With Historical Track Records in Inflationary Environments
In an environment where currency purchasing power is structurally declining, the allocation logic shifts away from assets whose value is denominated in depreciating units and toward assets with intrinsic productive or monetary value. Asset categories with historical resilience in inflationary cycles include:
- Agricultural farmland and productive land with genuine yield capacity
- Residential rental properties, particularly direct ownership rather than REIT structures
- Cattle and energy commodities as direct commodity exposure
- Consumer staples and healthcare equities with pricing power
- Physical precious metals held outside the banking system
Growth and technology equities face a specific vulnerability in this environment: their valuations are typically supported by discounted cash flow models that are extremely sensitive to the discount rate used. In a structurally higher-rate, higher-inflation environment, the present value of long-duration earnings collapses rapidly.
The Case for Patience as an Active Strategy
One of the most undervalued skills in investing, particularly in a high-volatility macro environment, is the capacity to wait. Conviction-based patience requires a genuine understanding of the underlying thesis rather than momentum-following. Investors who understand the structural debasement trade have an informational and behavioural edge over those reacting to daily price signals and social media commentary.
Physical Gold Ownership vs. Paper Exposure
Understanding the Counterparty Risk Difference
Gold held in ETF form or through unallocated bank accounts carries counterparty risk that physical allocated metal does not. In an ETF structure, the investor holds a claim on the fund, not on the metal itself. In a systemic stress event, the distinction between a paper claim and physical possession of allocated, segregated metal becomes critically important.
Large-scale exit flows from COMEX and LBMA vaults in recent years, with nations and institutions repatriating physical metal, reflect exactly this calculation being made at an institutional level. Gold surpassing US treasuries as the largest reserve asset is, in many respects, the institutional expression of this same preference for unencumbered physical ownership.
Jurisdiction and Vault Security
Where physical gold is stored matters as much as whether it is held in physical form. Jurisdictions with strong rule of law, political neutrality, and established vault infrastructure, such as Switzerland and Singapore, are considered significantly safer than holding metal within the domestic banking system of countries experiencing sovereign stress.
FAQ: Gold Surpassing U.S. Treasuries as the Largest Reserve Asset
Has gold permanently surpassed U.S. Treasuries as the top reserve asset?
The current data reflects a valuation-driven shift as of end-2025. If gold prices were held at 2023 levels, Treasuries would still rank ahead. The trend is structural but not yet irreversible.
Does this mean the U.S. dollar is losing its reserve currency status?
Not immediately. The dollar still accounts for approximately 57% of global FX reserves. However, its share has declined from around 80% over the past two decades, reflecting a slow but measurable structural shift.
Why are central banks buying gold instead of Treasuries?
Multiple factors converge: geopolitical counterparty risk following the 2022 asset freeze precedent, rising Treasury yields reducing bond attractiveness, and a broader institutional reassessment of what constitutes a reliable store of value.
Is silver a reserve asset like gold?
Central banks do not accumulate silver as a formal reserve asset. Silver's investment case rests on a combination of monetary metal characteristics, critical industrial demand, and structural supply deficits, making it a distinct but complementary thesis.
What is the gold-silver ratio and why does it matter?
The gold-silver ratio measures how many ounces of silver are required to purchase one ounce of gold. Historically, compression of this ratio toward the low teens or high single digits has signalled peak silver valuations relative to gold, providing a useful framework for long-term position management.
Are gold mining stocks a better investment than physical gold?
They serve different purposes. Physical gold functions as wealth preservation and currency debasement insurance. Mining equities offer leveraged exposure to gold price movements but carry operational, management, and geopolitical risks that physical metal does not.
Key Takeaways: The Structural Case for Gold in a Fracturing Reserve System
- Gold's share of global foreign reserves reached ~27% in 2025, exceeding U.S. Treasuries at ~22%, the first such inversion since 1996
- The shift is driven by price appreciation combined with sustained central bank accumulation, not a single triggering event
- The U.S. dollar retains reserve dominance at ~57% of global FX reserves, but the directional trend reflects gradual structural erosion from ~80% over two decades
- Rising sovereign yields globally signal declining institutional confidence in government debt instruments without corresponding central bank rate increases
- Silver's structural supply deficit exceeds 1 billion ounces cumulatively, with lease rates above 8% confirming genuine physical scarcity
- Long-term portfolio positioning in an inflationary environment favours hard assets, productive land, energy, and physical precious metals held outside the banking system over growth equities and government bonds
- The traditional inverse relationship between stocks and bonds has broken down, eliminating the foundational assumption behind conventional 60/40 portfolio construction
This article is intended for informational and educational purposes only and does not constitute financial or investment advice. All forward-looking statements, projections, and market analyses involve uncertainty and should not be relied upon as predictions of future performance. Readers should conduct independent research and consult qualified financial advisors before making any investment decisions.
Want To Know When The Next Major Mineral Discovery Hits The ASX?
Discovery Alert's proprietary Discovery IQ model delivers real-time alerts the moment significant mineral discoveries are announced on the ASX, transforming complex geological data into clear, actionable insights for both short-term traders and long-term investors — start your 14-day free trial today and see why historic discoveries have generated extraordinary returns.