
August 22, 2026
The Structural Forces Reshaping Gold's Role in Modern Portfolios
Precious metals markets have historically operated in long cycles shaped by monetary policy shifts, currency dynamics, and investor psychology. Understanding these cycles, rather than reacting to individual price prints, separates disciplined market participants from those who chase momentum into unfavourable positions. August 2026 represents one of those inflection moments where multiple technical and macroeconomic signals are converging simultaneously, making a gold price exclusive update not just timely but essential for anyone tracking the broader precious metals landscape.
When big ASX news breaks, our subscribers know first
Gold's Current Price Landscape: Context Before Numbers
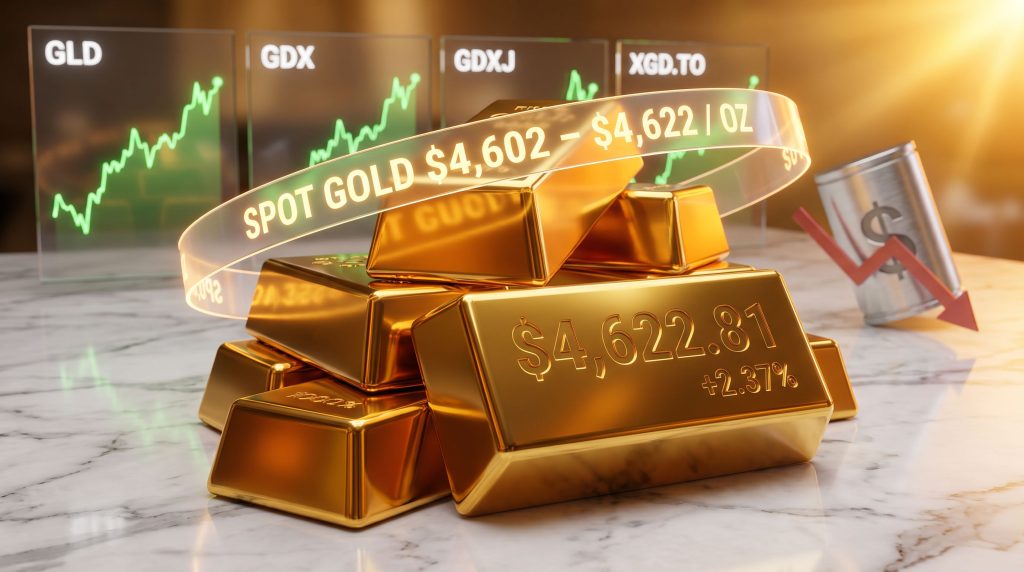
Before fixating on a single price point, it helps to understand what the current trading range means structurally. Spot gold is consolidating in the $4,602 to $4,622 per troy ounce range as of August 21 to 22, 2026, a zone that reflects genuine price discovery rather than thin-market volatility.
Kitco data records a bid of $4,602.40 and an ask of $4,604.40 as of August 21 at 18:59 New York time. Trading Economics confirmed an intraday high of $4,622.81 on August 21, representing a single-session gain of +2.37%. BullionVault places the price at $4,603.53 per troy ounce, the equivalent of approximately $148,007 per kilogram when converted.
These aren't just numbers. A consolidation band in this range, after a multi-week climb, signals that buyers are absorbing supply at successive price levels without triggering a sharp reversal. That dynamic is characteristic of a structurally supported uptrend, not a speculative blow-off top.
Furthermore, the upward gold price forecast that many analysts anticipated earlier in the cycle now appears to be materialising in real time, with each consolidation phase reinforcing rather than undermining the broader bullish structure.
Gold's ability to hold above $4,585 per ounce while pushing toward $4,622 reflects a market where demand pressure is absorbing resistance at each successive level. This is the behaviour of an asset in a confirmed uptrend, not one riding a sentiment bubble.
What Is Actually Driving Gold Higher Right Now
The U.S. Dollar Deterioration and Its Multiplier Effect
Reuters confirms that a weakening U.S. dollar is among the primary catalysts sustaining gold's current price support. The mechanism here is straightforward but frequently misunderstood in its full scope: when the dollar declines, gold becomes cheaper in every other currency simultaneously. That isn't a marginal shift in demand — it is a simultaneous repricing of gold's accessibility for buyers in Europe, Asia, the Middle East, and Latin America.
A bearish USD trend also reduces the opportunity cost of holding non-yielding assets. When dollar-denominated bonds and cash instruments are losing real purchasing power, the traditional argument against owning gold as a non-income-producing asset loses traction. Moreover, the gold safe-haven appeal intensifies during periods of dollar weakness, as investors across multiple regions simultaneously seek protection from currency depreciation.
Technical models tracking dollar direction currently point to a sustained bearish trajectory, and history shows that USD bear markets frequently coincide with multi-month gold rallies with minimal fundamental interruption.
Three Consecutive Weekly Gains and What the Streak Signals
Gold is on track for its third straight weekly gain, reaching what Reuters describes as a more than three-month high. This context matters enormously. A three-month high reached on a third consecutive weekly gain is not the same as a spike off a base. It indicates sustained buying pressure across institutional and retail participants over an extended window.
Statistically, multi-week winning streaks in gold tend to precede broader institutional reallocation into the precious metals complex. Fund managers who have been underweight gold begin to face tracking error pressure, and that mechanical reallocation can extend a rally well beyond what pure technical analysis might suggest.
Macro Data as the Short-Term Price Engine
Softer-than-expected inflation-related data has reduced the perceived need for additional monetary tightening. Market participants are recalibrating rate expectations — a shift that historically benefits non-yielding assets like gold more than almost any other macro variable. In addition, central bank gold demand has remained a persistent structural tailwind, reinforcing price floors even during periods of short-term volatility. This recalibration dynamic is expected to remain the dominant near-term price driver heading into the final weeks of August 2026.
How Technical Models Are Reading the Gold Market
Understanding Cycle Indicators as Timing Tools
Cycle-based trading models are frequently misunderstood by investors who conflate them with fundamental forecasting. They are not. Cycle indicators function as timing tools, designed to identify when a market is approaching a high-probability entry or exit window, not to explain why a particular price level is justified by economic fundamentals.
The distinction is critical. A cycle indicator can signal an optimal entry even when macroeconomic news is ambiguous, because it is measuring the rhythmic patterns of price behaviour rather than attempting to quantify the underlying drivers. This is why cycle models are most powerful when used alongside trend confirmation signals, and most dangerous when deployed in isolation.
It is important to acknowledge that cycle-based models are not infallible. Periodically, elevated market volatility can produce short-term whipsaws, meaning temporary signals that deviate from the broader directional trend before correcting. Position sizing and stop-loss discipline are not optional in this framework. They are the framework.
The proprietary cycle indicator currently tracking the gold sector is reading UP, indicating the market is positioned within a bullish cycle phase as of August 22, 2026.
Buy Signals Across All Major Gold Instruments
What makes the current technical setup unusually significant is the breadth of the signal. All four major gold-linked instruments are simultaneously showing short-term buy signals:
| Instrument | Signal Type | What It Represents |
|---|---|---|
| GLD (Gold ETF) | Short-term buy | Broad physical gold price exposure |
| GDX (Gold Miners ETF) | Short-term buy | Large-cap gold producer equities |
| GDXJ (Junior Gold Miners ETF) | Short-term buy | Higher-beta junior mining exposure |
| XGD.TO (TSX Gold Index) | Short-term buy | Canadian gold sector confirmation |
When GLD, GDX, GDXJ, and XGD.TO all align on simultaneous buy signals, technical analysts treat this as a high-conviction directional reading. The rally is not confined to the metal itself or to one segment of the equity market. It is broad-based, spanning physical gold proxies, senior producers, junior developers, and the Canadian mining complex. That cross-instrument alignment reduces the probability that any single instrument's signal is a false positive.
The Gold-to-Miner Ratio: An Often-Overlooked Signal
The ratio between gold prices and gold mining equities has moved onto a buy signal, which carries specific implications that many investors overlook. Understanding gold vs mining equities is essential here — when this ratio favours miners, it suggests that gold equities are undervalued relative to the metal itself, creating a potential catch-up trade.
This dynamic has historical precedent. In the middle and later stages of a gold bull market, mining equities have repeatedly outperformed the underlying metal because their earnings leverage to rising gold prices compounds rapidly. A gold miner producing an ounce at an all-in sustaining cost of, for example, $1,800 per ounce earns dramatically more at $4,600 gold than at $2,500 gold. The margin expansion is non-linear, and markets eventually reprice that leverage.
Gold Equities at Resistance: The Critical Test Ahead
Despite the bullish alignment across instruments, gold stocks are approaching a key resistance zone. Resistance levels represent price points where historical selling pressure has previously capped advances. This doesn't mean the rally ends at resistance, but it does mean this zone demands attention.
A confirmed break above resistance in gold equities would be a structurally important development, potentially unlocking the next leg higher for GDX, GDXJ, and XGD.TO. Traders using cycle models typically wait for that confirmation before adding meaningfully to positions rather than front-running the breakout.
Strategic Positioning: A Framework by Participant Type
Different market participants should interpret the current setup differently. A one-size-fits-all approach to gold market positioning is one of the most common and costly mistakes in precious metals investing.
| Participant Type | Recommended Posture | Core Rationale |
|---|---|---|
| Long-term investors | Hold cash or maintain hedged positions | Cycle tops can produce sharp reversals; capital protection takes priority |
| Short-term traders | Enter near cycle bottoms, exit near cycle tops | Cycle signals provide structured entry and exit discipline |
| Portfolio allocators | Monitor USD trend and gold-to-miner ratio | Macro alignment supports a tactical overweight in gold assets |
The framework above reflects a core principle of cycle-based investing: the when often matters more than the what. Buying gold at a cycle top produces inferior results even if the long-term trend is intact. Entering near a cycle bottom, by contrast, compresses risk and maximises the return window before the next top.
Is the Rally Structurally Sound or Technically Stretched?
Recovery Rally Dynamics Versus Overextension
The current price movement is best characterised as a recovery rally, meaning gold bounced from a meaningful support level rather than extending directly from an already overbought condition. This distinction carries probability implications. Recovery rallies that emerge within established uptrends have a higher statistical likelihood of continuation than rallies that begin from stretched technical positions.
Both the gold price trend and the gold equities trend are currently reading UP across multiple technical timeframes. This multi-timeframe confirmation reduces the probability that the current move is a one-week phenomenon driven by a single catalyst.
What a Sustained USD Downtrend Unlocks for Gold
If the dollar continues its bearish trajectory, the ceiling for gold prices expands materially. Historical analysis of prolonged USD bear markets shows that gold can sustain rallies over many months with relatively few fundamental interruptions, because the currency mechanism continuously reprices gold's accessibility for global buyers.
A weakening dollar combined with a rising gold-to-miner ratio creates a dual-confirmation environment that technical models treat as a high-probability setup. Investors seeking additional context may find the gold-silver ratio analysis useful, as silver's relative performance during these phases can provide further confirmation of precious metals strength broadly. These two signals operating simultaneously are uncommon enough that when they do align, they deserve serious attention from investors across the risk spectrum.
The next major ASX story will hit our subscribers first
Frequently Asked Questions: Gold Price Exclusive Update August 2026
What is gold trading at right now in August 2026?
Spot gold is trading between $4,602 and $4,622 per troy ounce as of August 21 to 22, 2026, depending on the data source and timestamp. This represents a more than three-month high and the third consecutive week of gains for the metal.
Why is gold rising in August 2026?
The primary drivers include a weakening U.S. dollar, softening inflation-related market expectations, and broad technical buy signals across gold ETFs and mining equity indices. Macro data releases are functioning as near-term catalysts while the structural USD trend provides a sustained tailwind. According to World Gold Council research, central bank buying and institutional demand have also played a meaningful structural role in supporting prices at elevated levels.
What does a cycle indicator actually measure?
A cycle indicator is a proprietary technical timing tool designed to identify when markets are approaching a high-probability bottom, representing a buy zone, or top, representing a sell zone. These models help traders structure entry and exit points without requiring fundamental analysis of underlying economic conditions. They measure when, not why.
Are gold mining stocks outperforming gold right now?
GDX, GDXJ, and XGD.TO are all showing short-term buy signals, and the gold-to-miner ratio has moved onto a buy signal. However, gold equities are currently approaching a resistance zone, which represents the key near-term test of whether the rally has sufficient momentum to extend further.
Should investors buy gold right now?
This content is educational in nature and does not constitute financial advice. The technical framework discussed here indicates the trend is currently upward for both gold and gold equities, with the USD trend providing macro-level support. Individual investors should consult a licensed financial adviser before making any investment decisions.
Technical Summary: Gold Market Snapshot as of August 22, 2026
- Gold spot price: $4,602 to $4,622 per troy ounce, a three-month high on a third consecutive weekly gain
- Cycle indicator: Bullish (UP)
- GLD, GDX, GDXJ, XGD.TO: All on short-term buy signals simultaneously
- USD trend: Bearish, providing sustained macro support for gold
- Gold-to-miner ratio: On a buy signal, suggesting miners are undervalued relative to the metal
- Gold equities: Approaching a resistance zone; watch for breakout confirmation before adding aggressively to positions
- Short-term whipsaw risk: Remains present; position sizing and stop discipline are essential components of any trading approach
Disclosure: Technical analysis models and cycle indicators are trading tools, not guarantees of future performance. All market participation carries risk. This content is provided for educational purposes only and does not represent investment advice. Readers should conduct their own due diligence and consult a licensed financial adviser before making any investment decisions.
Want to Be First When the Next Major Gold Discovery Hits the ASX?
Discovery Alert's proprietary Discovery IQ model delivers real-time alerts on significant ASX mineral discoveries — instantly cutting through the noise to surface actionable opportunities in gold and across 30+ commodities before the broader market catches on. Explore why historic discoveries have generated extraordinary returns on Discovery Alert's dedicated discoveries page, and begin your 14-day free trial today to position yourself ahead of the next major move.