July 17, 2026
When the Fed Goes Silent, Gold Speaks for Itself
For most of the past decade and a half, the most consequential variable in global financial markets was not unemployment data, not GDP growth, and not even inflation readings. It was a single paragraph buried inside a Federal Reserve policy statement. The architecture of modern monetary communication, built layer by layer since 2012, trained an entire generation of traders to watch central bank language more closely than the underlying economy. That system is now being deliberately dismantled, and the implications for gold price and Fed policy dynamics in 2026 are more significant than most market participants have yet appreciated.
When big ASX news breaks, our subscribers know first
Why Fed Communication Architecture Matters More Than Most Investors Realise
From Dot Plots to Deliberate Silence
The dot plot was introduced by the Federal Reserve in January 2012 under then-Chair Ben Bernanke. Its stated purpose was transparency: by showing each FOMC member's individual interest rate projections anonymously, the Fed could provide markets with a clearer view of its expected policy path. In practice, the dot plot became something far more powerful. Traders quickly learned to treat it as a tradeable instrument in its own right, often overriding incoming economic data entirely when the dot plot pointed in a different direction.
The consequence of this over roughly 14 years of operation was the creation of what might be called a shadow market in Fed language. Policy statements, press conference transcripts, and individual dot projections were dissected word by word. Algorithmic trading systems were calibrated to respond to specific phrases within seconds of their release. The actual economic data that the Fed was supposedly responding to became secondary.
Fed Chair Kevin Warsh has moved decisively to reverse this dynamic. His first FOMC policy statement ran to just 130 words, a stark contrast to the multi-page communications that had become standard. He withheld his own rate projection from the June 2026 dot plot entirely. In testimony before the Senate Banking Committee on July 14 and 15, 2026, he articulated the philosophy underpinning this approach: his direction to markets was to focus on real economic developments and incoming data rather than treating Fed communication as the primary investment signal.
This shift represents a structural break in the relationship between monetary communication and asset pricing. For gold specifically, the implications operate on two distinct timeframes: a more volatile and data-sensitive near term, and a structurally more transparent long-term pricing environment.
What the Dot Plot Suppressed That Gold Markets Always Priced
One of the less-discussed features of the forward guidance era is that it gave market participants implicit permission to discount monetary fundamentals that gold holders had always treated as primary. The 2021–2022 inflation episode is the clearest illustration of this dynamic. During that period, the FOMC's characterisation of accelerating price growth as transitory effectively suppressed gold's natural response to a significant monetary expansion.
Without that guidance filter in place, the monetary fundamentals that underpin gold's long-term value proposition become directly visible. These include a US national debt that has crossed $39 trillion, annual federal interest payments that have surpassed $1 trillion, and a deeply divided FOMC where the internal distribution of rate projections reveals genuine uncertainty about the policy path ahead. Furthermore, central bank gold demand continues to act as a structural underpinning for prices irrespective of short-term Fed communication shifts.
The Three Data Points Driving Gold Price in Mid-2026
With Fed language no longer functioning as the dominant pricing mechanism, gold price and Fed policy are now mediated entirely through hard economic releases. As of mid-July 2026, three specific datasets are shaping the near-term gold outlook.
| Data Point | Reading | Market Implication for Gold |
|---|---|---|
| June CPI (month-over-month) | -0.4% (largest single-month decline since April 2020) | Short-term disinflationary tailwind |
| June CPI (year-over-year) | 3.5% (below 3.8% consensus forecast) | Softening inflation reduces safe-haven urgency |
| June Retail Sales (headline) | +0.2% | Resilient consumer limits rate-cut probability |
| Retail Sales ex-Gasoline Stations | +0.7% | Underlying consumer strength remains intact |
| Gasoline Station Sales | -5.3% | Lower pump prices distort headline softness |
| Strait of Hormuz Oil Escalation | Oil +9% over five days | Re-introduces forward energy inflation premium |
| CME FedWatch: September Rate Hike Probability | ~44% | Keeps real yield pressure elevated near term |
Sources: Bureau of Labor Statistics, June 2026 CPI release; US Census Bureau, Advance Monthly Retail Trade Survey, June 2026; CME Group FedWatch Tool, July 2026.
The CPI Reading and Why It Did Not Rescue Gold
June CPI falling 0.4% month-over-month represented the steepest single-month price decline since April 2020. On a year-over-year basis, the 3.5% reading came in meaningfully below the 3.8% consensus forecast, which did provide a brief tailwind for metals earlier in the week. However, as Yahoo Finance reports on Fed rate decisions, CPI is a backward-looking measure that captures what inflation was doing last month rather than where it is headed.
What oil markets are pricing right now, given the Strait of Hormuz escalation, is forward inflation expectations, and those are moving in the opposite direction. The gold market, pricing in real time, responded to the forward signal rather than the historical data point.
Retail Sales: The Consumer Complexity That Keeps the Fed Parked
The June retail sales print requires careful interpretation. The headline figure of +0.2% looks modest, but gasoline station sales fell 5.3% due to lower pump prices. Stripping out that distortion, retail sales excluding gasoline stations rose a solid 0.7%, indicating that underlying consumer spending remains resilient.
A resilient consumer is problematic for gold because it reduces the probability of near-term rate cuts. When consumer spending holds up, the Fed has less economic justification to ease. Elevated Fed rates mean elevated real yields, and elevated real yields raise the opportunity cost of holding a non-yielding asset like gold.
The Oil-to-Gold Transmission Chain: A Step-by-Step Breakdown
The Strait of Hormuz situation is the most complex and counterintuitive element of the current gold pricing environment. Here is how the transmission chain operates from geopolitical escalation through to gold price pressure:
- US-Iran military strikes continued for a fifth consecutive day as of July 16, 2026, with a naval blockade of Iranian ports reinstated.
- Crude oil prices rose more than 9% over five trading sessions in response to the supply disruption threat.
- Higher energy prices feed into forward inflation expectations, meaning markets begin pricing in inflation that has not yet appeared in official data.
- Rising forward inflation expectations push nominal bond yields higher as investors demand greater compensation for anticipated purchasing power erosion.
- When nominal yields rise faster than current inflation readings, real yields (nominal yields minus inflation) increase.
- Higher real yields increase the opportunity cost of holding gold, which generates no income stream.
- Gold prices face downward pressure as the real yield calculus shifts against non-yielding assets.
Critical Distinction: Oil-driven inflation is supply-chain inflation. It operates differently from monetary inflation as a gold pricing input. Supply-chain inflation can pressure gold in the short term by pushing real yields higher, while monetary inflation, driven by excessive money creation, tends to be structurally gold-positive over longer horizons. Conflating the two leads to misread entry and exit signals for gold investors.
Gold Price Performance: The June–July 2026 Timeline
| Date | Gold Spot Price | Primary Catalyst |
|---|---|---|
| June 18, 2026 | $4,502 (cycle peak) | US-Iran nuclear deal signed |
| June 30, 2026 | $4,010 | Q2 close; hawkish FOMC tone |
| July 8, 2026 | $4,075 | FOMC minutes release |
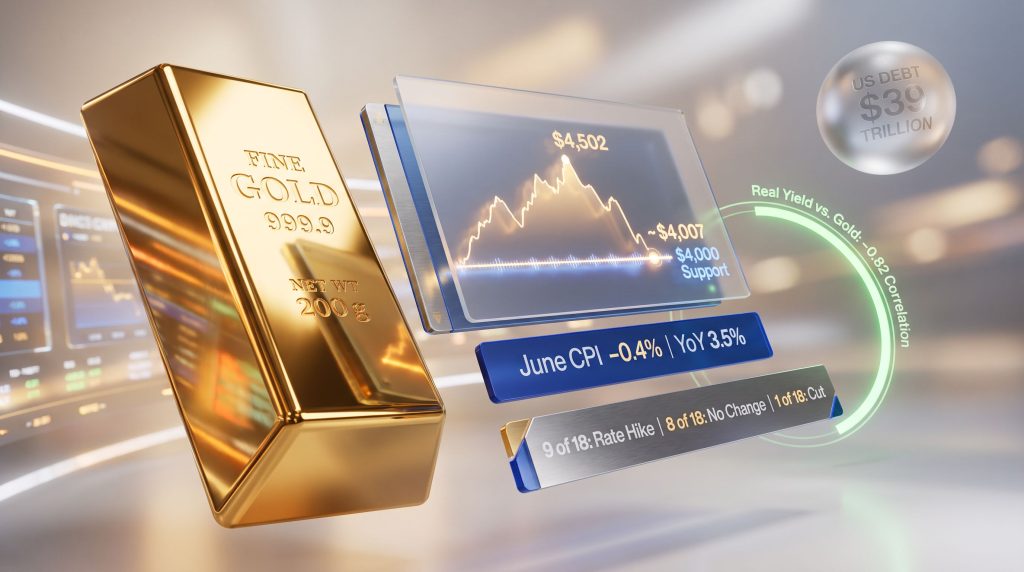
| July 16, 2026 | ~$4,007–$4,010 | CPI softness offset by oil escalation and retail resilience |
The approximately $500 decline from the June 18 peak to mid-July levels represents a data-driven repricing, not a shift in long-term monetary fundamentals. The $4,000 level has emerged as a critical psychological and technical support threshold. A sustained break below that level would most likely require either a significant hawkish surprise from the Fed or a meaningful reversal in geopolitical risk premiums.
It is also worth noting the March 2026 episode as an instructive precedent: gold fell 2.2% to $4,895.61 when the Fed held rates but signalled caution in its accompanying language. That move illustrated that even under a reduced forward guidance regime, market expectations about future policy continue to drive near-term pricing. This will remain true until the new communication framework is fully internalised by market participants.
How Analyst Price Targets Reflect Rate Path Uncertainty
Deutsche Bank's 2026 projection range captures the breadth of uncertainty embedded in the current environment. The base case, which assumes the Fed maintains its current stance, targets gold at $4,800 by Q4 2026. The downside scenario, which assumes three to four rate hikes materialise, prices gold at $3,800. The $1,000 spread between those two scenarios is a direct function of rate path uncertainty, which is why tracking the gold price forecast across multiple scenarios has become essential for investors.
The FOMC's Internal Division: What the 2026 Dot Distribution Reveals
One underappreciated consequence of the Warsh communication approach is that FOMC internal divisions become more market-visible rather than less. When the chair anchors expectations through explicit public guidance, internal disagreement is partially masked. Without that anchor, the distribution of projections across committee members speaks more directly to genuine policy uncertainty.
| FOMC Projection Category | Number of Officials | Implication |
|---|---|---|
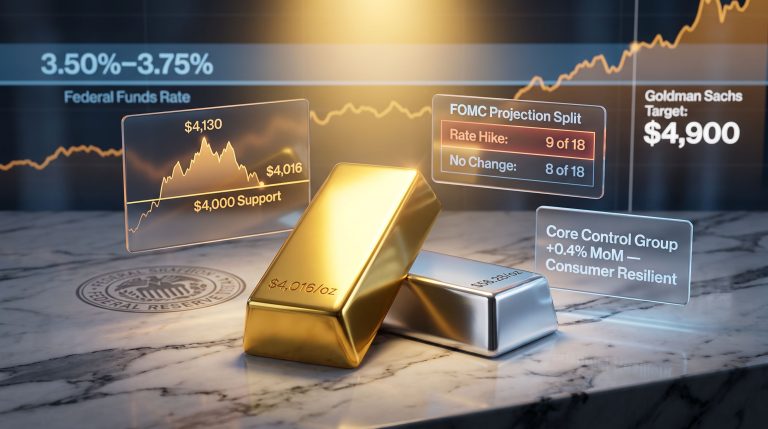
| At least one rate hike projected in 2026 | 9 of 18 | Majority lean hawkish |
| No change to rates projected in 2026 | 8 of 18 | Substantial dovish contingent |
| Rate cut projected in 2026 | 1 of 18 | Marginal outlier view |
Source: CNBC, Fed Interest Rate Decision June 2026: Dot Plot and SEP Details, June 17, 2026.
With nine officials projecting at least one hike and eight projecting no change, the committee is as closely divided as it has been at any point in the current cycle. Rates were held at 3.50%–3.75% at the June meeting, with a hike signalled as a possibility later in the year. That forward signal caused gold to drop more than 1%, with spot falling to $4,299.89 at the time, demonstrating that even a restrained communication regime retains the capacity to move markets.
The next major ASX story will hit our subscribers first
Real Interest Rates: The Primary Analytical Framework for Gold Investors
Defining the Real Yield Relationship
Real interest rates are calculated as nominal interest rates minus the prevailing inflation rate. When real rates rise, the relative attractiveness of yield-bearing assets improves against non-yielding alternatives like gold. When real rates fall or turn negative, gold's value proposition as a store of purchasing power strengthens considerably.
The historical correlation between gold prices and real interest rates sits at approximately -0.82, meaning the two variables move in opposite directions with high consistency. This relationship is more analytically reliable than monitoring Fed press conferences or dot plot distributions, particularly in the current environment. Furthermore, understanding gold-bond dynamics provides an additional layer of clarity when assessing real yield movements and their implications for precious metals positioning.
Dollar Strength as a Compounding Factor
Because gold is priced globally in US dollars, dollar appreciation creates a direct headwind for gold prices independent of the real yield dynamic. The transmission chain runs as follows: hawkish Fed expectations strengthen the dollar, dollar strength makes gold more expensive in non-dollar currencies, and reduced non-dollar demand consequently weighs on spot prices.
Critically, this mechanism is activated by market expectations of Fed rate changes, not by actual FOMC decisions. By the time the Fed moves, the dollar and gold markets have typically already priced the move. This reinforces the importance of monitoring leading indicators rather than waiting for FOMC announcements to adjust positioning.
The PCE Report: The Single Most Important Near-Term Catalyst
Why June PCE on July 30 Outweighs the July FOMC Meeting
The Personal Consumption Expenditures index is the Federal Reserve's preferred inflation gauge because it accounts for changes in consumer behaviour in response to price changes, making it a more dynamic measure than the fixed-basket CPI methodology. According to Investopedia's analysis of gold price drivers, PCE data carries particular weight in shaping real yield expectations and, consequently, precious metals pricing.
The decision tree for gold based on the July 30 release is binary:
- If June PCE confirms the softening visible in CPI and PPI: The probability of a September rate hike compresses from its current ~44% reading. Compressed September hike probability eases real yield pressure. Gold's near-term headwind lifts, supporting a potential move back toward $4,200–$4,300.
- If June PCE comes in above expectations: September hike probability rises toward 60% or higher. Real yield pressure intensifies. Gold tests the $4,000 support level more aggressively, with downside risk toward $3,900 if the $4,000 floor fails.
The FOMC meeting on July 28–29, with a current hike probability of approximately 15–20%, is a lower-conviction event by comparison. Under the current communication regime, even the meeting's surrounding language carries reduced directional authority. The PCE release the following day is the genuine signal.
Historical Context: What Past Fed Communication Regimes Reveal About Gold's Behaviour
| Era | Fed Communication Style | Gold's Primary Pricing Driver | Gold Behaviour |
|---|---|---|---|
| Pre-2012 | Minimal forward guidance | Real yields and inflation data | Highly responsive to fundamentals |
| 2012–2021 | Dot plot and explicit guidance | Fed language and dot plot signals | Partially decoupled from economic data |
| 2021–2022 | Transitory inflation framing | Fed credibility collapse | Lagged response to inflation shock |
| 2026 (current) | Minimal guidance; data-first | Hard economic data directly | Re-coupling with monetary fundamentals |
The current regime most closely resembles the pre-2012 environment, when gold's pricing was more directly anchored to real economic conditions. During that earlier period, gold responded quickly and proportionally to shifts in real yields, inflation data, and dollar dynamics. The re-coupling of gold to those fundamentals is arguably a long-term structural positive for physical metal holders, even if it introduces greater near-term price volatility.
Frequently Asked Questions: Gold Price and Fed Policy in 2026
Does gold always fall when the Fed raises interest rates?
The relationship is more nuanced than a simple inverse. Gold responds primarily to real interest rates, not nominal rates alone. If the Fed raises nominal rates by 0.25% while inflation simultaneously rises by 0.50%, real rates actually decline and gold can rally during a nominal hiking cycle. The approximately -0.82 historical correlation between gold and real yields serves as a directional guide rather than an absolute rule.
Why did gold fall even though June CPI came in softer than expected?
The oil re-escalation dynamic overrode the backward-looking CPI signal. Forward inflation expectations, repriced upward by the Hormuz-driven oil spike, exerted more influence on real yield calculations than the June CPI data. Gold markets price future real yields, not past inflation readings. In addition, gold safe-haven demand was partially offset by the real yield pressure generated through the energy inflation channel.
What does removing forward guidance mean for long-term gold holders?
Without the Fed's capacity to verbally manage gold lower through guidance language, the monetary fundamentals that underpin physical metal's value proposition price more directly into spot gold. The structural data points that forward guidance previously filtered, including the $39 trillion national debt and $1 trillion annual interest payments, become more visible to the market. Over a multi-year horizon, this represents a structurally supportive condition for physical gold ownership.
How does the Strait of Hormuz situation create a counterintuitive gold outcome?
Geopolitical events typically support gold through safe-haven demand. The Hormuz escalation is currently functioning more as an energy inflation driver than a safe-haven catalyst. The oil price spike it has generated creates forward inflation expectations that push real yields higher, which is a gold headwind, partially offsetting the safe-haven demand the conflict would otherwise generate. The net result is gold that holds relatively flat or declines even as geopolitical risk rises. Historical analysis of gold in recessions and stress events confirms that the transmission mechanism varies significantly depending on whether the shock is supply-side or demand-driven.
Key Takeaways for Investors Navigating Gold Price and Fed Policy in 2026
- Short-term headwinds are data-driven: Resilient consumer spending, oil-driven forward inflation expectations, and a ~44% September rate hike probability collectively keep real yield pressure elevated and gold constrained below $4,050.
- The July 30 PCE release is the most important near-term catalyst: A soft PCE reading compresses September hike odds and removes the primary near-term headwind for gold. A hot reading intensifies real yield pressure and tests $4,000 support.
- Long-term structural support is strengthening: The Fed's retreat from forward guidance removes its capacity to verbally suppress gold. Monetary fundamentals, including $39 trillion in national debt and $1 trillion-plus in annual interest payments, now price into gold without a guidance filter.
- The analytical framework that matters: Investors should track real yield direction, PCE and CPI trends, and dollar strength as the primary gold pricing inputs, not Fed press conference language or dot plot distributions.
- The $4,000 level is the technical floor to watch: A sustained break below that threshold would require either multiple unexpected rate hikes materialising or a significant reversal in geopolitical risk premiums.
Analytical framework for 2026: The sequence that matters is PCE data on July 30, followed by September rate hike probability repricing, followed by real yield adjustment, followed by gold's directional move. The FOMC meeting itself is a secondary event under the current communication regime.
This article is for informational and educational purposes only and does not constitute financial or investment advice. Past performance is not indicative of future results. Readers should consult a qualified financial adviser before making any investment decisions. For ongoing data-driven analysis of precious metals and monetary policy, GoldSilver.com's Industry News section publishes regular market commentary and updates.
Want to Stay Ahead of the Next Major ASX Mineral Discovery?
While gold price dynamics and Fed policy shifts reshape investment conditions in 2026, Discovery Alert's proprietary Discovery IQ model delivers real-time alerts on significant ASX mineral discoveries, translating complex data across 30-plus commodities into clear, actionable insights for investors at every level. Explore Discovery Alert's dedicated discoveries page to understand how historic mineral discoveries have generated substantial market returns, and begin your 14-day free trial today to secure a decisive market-leading advantage.