July 17, 2026
Why a Resilient U.S. Consumer Is the Single Biggest Headwind Facing Gold Right Now
Most investors watching gold in mid-2026 are focused on the wrong variable. They are tracking inflation headlines, geopolitical flashpoints, and central bank commentary, when the real force suppressing prices sits in an unglamorous monthly government spreadsheet: the U.S. retail sales report. Understanding why consumer spending data has become the dominant short-term driver of the gold price, retail sales, and Fed rate cuts relationship requires stepping back from daily price moves and examining the transmission mechanism that connects a shopper's checkout receipt to a gold bar's market valuation.
When big ASX news breaks, our subscribers know first
The Three-Stage Chain That Connects Consumer Spending to Gold
Gold does not respond to retail data directly. The relationship works through a sequential chain of economic logic, and missing any link in that chain leads investors to misread price movements entirely.
When consumer spending comes in stronger than anticipated, it signals that household balance sheets remain intact and that the broader economy does not require monetary stimulus. A resilient economy removes the justification for Federal Reserve rate cuts. And when rate cuts stay off the table, real interest rates, defined as nominal rates adjusted for inflation, remain elevated. Because gold generates zero yield, elevated real rates impose a measurable opportunity cost on holders. The higher that opportunity cost, the more capital rotates toward interest-bearing alternatives.
The reverse sequence is equally important. Furthermore, understanding this sequence helps investors anticipate gold movements before they occur:
- Deteriorating consumer spending signals economic cooling and potential disinflation
- Cooling conditions increase the probability the Fed will begin easing monetary policy
- Rate cut expectations compress real yields, weaken the U.S. dollar, and reduce the opportunity cost of holding gold
- Lower opportunity cost supports higher gold valuations
This three-stage mechanism explains why gold can fall on the same day that inflation data softens, a counterintuitive outcome that confuses many retail investors. The gold price forecast for the coming months hinges heavily on which direction this chain ultimately resolves.
Decoding the June 2026 Retail Sales Report
The June 2026 retail sales report, published by the U.S. Census Bureau on July 16, 2026, required careful decomposition to interpret accurately. The headline figure of +0.2% month-over-month appeared unremarkable at first glance, but the sub-components told a more consequential story.
| Retail Sales Component | June 2026 Monthly Change | Signal for Gold |
|---|---|---|
| Total Retail Sales (Headline) | +0.2% | Neutral without context |
| Gasoline Station Receipts | -5.3% | Energy normalization, not demand collapse |
| Sales Excluding Gasoline | +0.7% | Genuine consumer strength |
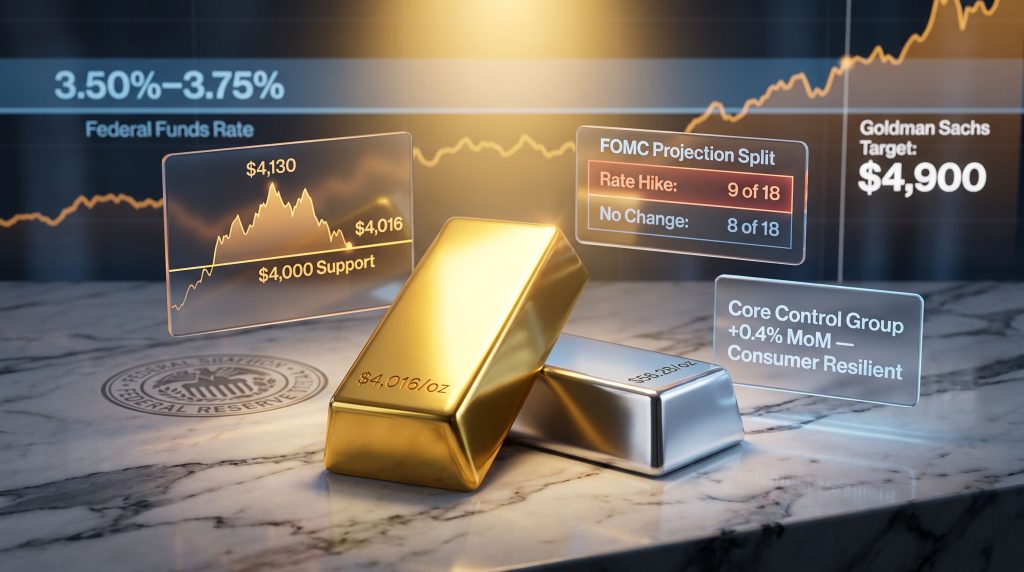
| Core Control Group (ex-gas, ex-autos) | +0.4% | Fed's preferred gauge; bearish for near-term gold |
The core control group is the sub-index that Federal Reserve economists weight most heavily when assessing underlying consumer demand. A +0.4% reading in this category confirmed that household spending momentum had not broken down. For gold, that confirmation carried a direct implication: the Fed retained no data-driven justification to cut rates.
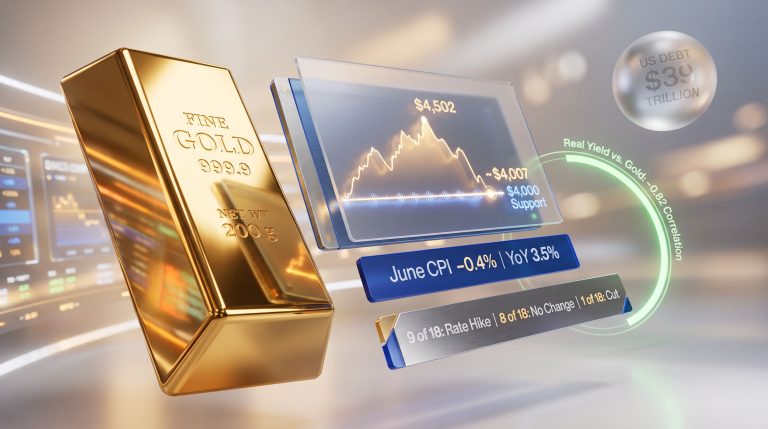
The federal funds rate remained at 3.50%-3.75%, and with nine of eighteen FOMC members still projecting at least one additional rate hike before year-end at the June meeting, the committee was not debating when to ease but whether to tighten further.
Key Insight: A single retail sales number rarely moves markets on its own. What the June report provided was confirmation of an existing condition: the U.S. consumer has not broken down, and until that changes, the Fed has no mandate to pivot. Gold prices reflect that institutional reality.
The Energy Distortion That Shaped Gold's 2026 Correction
One of the most underappreciated dynamics in the 2026 gold correction was the degree to which petroleum prices, rather than broad-based inflation, were driving the headline economic readings that pressured the metal.
The sequence began in the first quarter of 2026. U.S. military strikes on Iranian targets combined with escalating threats to shipping lanes through the Strait of Hormuz sent crude oil prices sharply higher. That energy shock fed directly into retail spending data through gasoline station receipts, which surged by the following margins:
- March 2026: +15.5% month-over-month
- April 2026: +2.8% month-over-month
- May 2026: +3.4% month-over-month
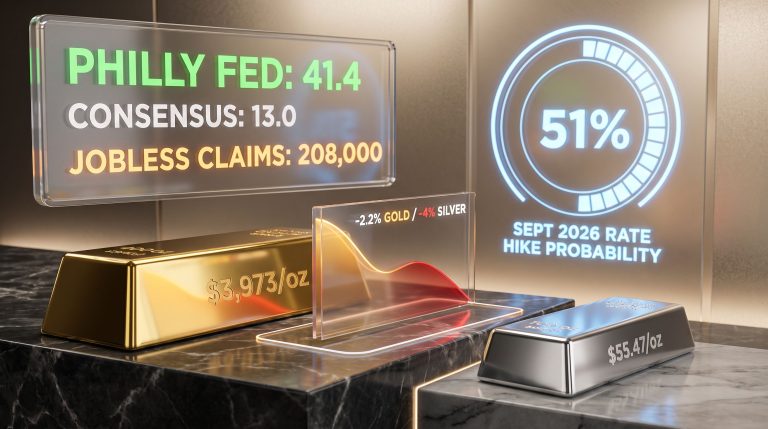
These energy-driven gains simultaneously inflated both headline retail sales figures and consumer price data. CPI climbed from 2.4% in February 2026 to 4.2% by May 2026, a trajectory that pushed September rate-hike probabilities above 50% and pressured gold from approximately $5,589 in January to briefly below $4,000 in mid-July.
By June, a brief ceasefire between Iran and U.S.-aligned forces temporarily softened crude prices. June CPI fell 0.4%, the largest single-month decline since April 2020. June PPI retreated from 6.5% to 5.5% year-over-year. And gasoline station receipts dropped 5.3% in the retail report.
Warning for Investors: Falling inflation and falling gold prices can coexist. When disinflation originates from energy price normalisation rather than broad demand destruction, it does not automatically translate into Fed rate cuts. The core consumer remaining healthy satisfies the employment half of the Fed's dual mandate, removing urgency to ease even as headline inflation softens.
This distinction separates supply-side disinflation from demand-side weakness, and it is a nuance that retail investors frequently miss when interpreting monthly CPI and PPI releases. In addition, the relationship between gold and bond yields during such periods further complicates the picture for investors relying solely on inflation readings.
Real Yields: The Variable Gold Investors Should Track Instead
Rather than monitoring headline inflation or retail sales figures in isolation, sophisticated gold investors track 10-year Treasury Inflation-Protected Securities (TIPS) yields as a more direct signal of the opportunity cost environment.
TIPS yields represent the real return available on U.S. government debt after accounting for inflation. When this yield rises, the cost of holding non-yielding gold increases proportionally. When TIPS yields fall, either because nominal rates are cut or because inflation expectations rise faster than nominal yields, gold's relative attractiveness improves.
What Should Investors Monitor Simultaneously?
The practical framework for gold investors involves monitoring three parallel data streams:
- Core PCE and core retail control group data to assess whether the consumer is weakening structurally
- 10-year TIPS yield to track real opportunity cost in real time
- CME FedWatch Tool probabilities to gauge how institutional investors are pricing rate change expectations ahead of FOMC meetings
The FedWatch Tool aggregates federal funds futures market pricing to produce implied probabilities for rate changes at each upcoming FOMC meeting. When cut probabilities shift materially upward, they typically precede gold price appreciation by days to weeks, providing a leading indicator advantage over lagging economic reports.
Two Catalysts That Will Determine Gold's Near-Term Direction
With the structural analysis established, two specific calendar events carry outsized significance for gold price, retail sales, and Fed rate cuts dynamics through late July 2026.
The July 28-29 FOMC Meeting
The Federal Open Market Committee's July gathering matters for two distinct reasons. First, any shift in the official policy statement language, whether toward greater caution about further tightening or toward acknowledgment of disinflation progress, will be immediately priced into gold and silver. Second, Fed Chair Kevin Warsh's press conference characterisation of September rate probabilities carries considerable market-moving potential.
Warsh has previously signalled that policy decisions will be driven entirely by incoming data rather than forward guidance, meaning markets must now interpret each economic release through the lens of what it implies for the next meeting rather than relying on pre-signalled trajectories.
The June PCE Release (July 30, 2026)
The Personal Consumption Expenditures price index is the Federal Reserve's preferred inflation measurement tool. Unlike CPI, which uses fixed expenditure weights, PCE adjusts dynamically for substitution behaviour and captures a broader consumption basket. The June PCE reading will answer whether the energy-driven disinflation visible in CPI and PPI has filtered through to the gauge the Fed actually relies on when calibrating policy.
| PCE Outcome | Likely Gold Market Response |
|---|---|
| Below-consensus (soft) | Rate-hike probabilities compress; gold positioned to reclaim territory above $4,100 |
| At or above consensus (resilient) | Fed remains in holding pattern; real yields stay elevated; pressure on gold continues |
Goldman Sachs has identified $4,100 as the threshold gold needs to clear on the path back toward their $4,900 year-end target. A soft June PCE reading on July 30 represents the most immediate data-driven catalyst for initiating that recovery leg.
The next major ASX story will hit our subscribers first
What Historical Rate Cut Cycles Tell Us About Gold's Potential
The near-term headwinds facing gold exist within a longer-term framework that has historically been highly constructive for the metal. When the Federal Reserve has commenced sustained easing cycles, gold has delivered substantial returns in the subsequent 24-month windows.
| Rate Cut Cycle | Gold Performance in 24 Months After First Cut |
|---|---|
| 2000 (Post-dot-com) | +26% to +39% |
| 2007 (Pre-GFC) | Significant multi-year rally |
| 2019 (Mid-cycle adjustment) | +26% to +39% |
The critical mechanism here is not the first cut itself but the expectation of a sustained cutting cycle, which forms in economic data months before the FOMC formally acts. Markets begin pricing that expectation into gold once the underlying data pattern becomes convincing enough to shift institutional positioning. This is why monitoring core retail sales, TIPS yields, and FedWatch probabilities simultaneously gives investors a meaningful informational edge over those who wait for the Fed to announce a pivot before repositioning.
The Gold-Silver Ratio as a Sentiment Gauge
Silver's behaviour during this period adds another analytical dimension. Silver declined to $56.28 on July 16, recording its sharpest single-session drop in over a week, while the gold-silver ratio reached 70:1. This divergence is not arbitrary.
Silver carries a dual identity that gold does not: it functions as both a monetary metal and an industrial commodity. When rate expectations remain hawkish and growth signals are strong, silver tends to underperform gold because industrial demand signals get overshadowed by the same real-yield headwind that suppresses gold, while its monetary premium gets compressed alongside gold's. A ratio above 70:1 has historically tended to precede periods of silver outperformance once the rate environment eventually shifts, making it a useful long-term positioning signal for precious metals investors.
The Structural Bull Case Remains Independent of Short-Term Data
Short-term gold price weakness driven by retail data and elevated real yields does not invalidate the multi-year investment thesis. However, several structural demand drivers remained intact throughout the 2026 correction:
- Central bank accumulation: Central bank gold demand continued throughout the correction period, providing a structural demand floor that retail sales reports cannot override
- Currency debasement thesis: The long-term case for gold as a store of value against monetary expansion does not hinge on any single month's gasoline price movements
- Dollar reserve diversification: Central banks in emerging market economies have been systematically reducing U.S. dollar exposure in favour of gold, a trend driven by geopolitical risk management rather than short-term yield differentials
- Real yield sensitivity in a cutting cycle: Gold's historical performance in post-peak-rate environments, once the Fed does eventually pivot, suggests meaningful upside for patient holders
Long-Term Perspective: The energy-driven inflation shock of early 2026 created conditions that suppressed gold from its January peak. As that shock normalises, the structural forces supporting gold over a multi-year horizon, sovereign demand, monetary debasement, and eventual rate cuts, remain fully intact.
Furthermore, gold safe haven demand from institutional and sovereign investors provides an additional layer of support that consumer spending data alone cannot erode. The World Gold Council regularly publishes data confirming this persistent structural demand across market cycles.
Key Data Summary: Gold Price Drivers as of July 16, 2026
| Economic Indicator | Recent Reading | Gold Price Implication |
|---|---|---|
| June Retail Sales (Headline) | +0.2% month-over-month | Neutral without decomposition |
| June Core Control Group | +0.4% month-over-month | Bearish near-term (consumer resilient) |
| Gasoline Station Receipts (June) | -5.3% month-over-month | Energy normalisation, not Fed cut trigger |
| June CPI | -0.4% month-over-month | Disinflation, but demand-side still intact |
| June PPI (Year-over-Year) | 5.5% (down from 6.5%) | Moderately positive; watch June PCE |
| Federal Funds Rate | 3.50%-3.75% | Elevated real yields remain a headwind |
| FOMC Members Projecting Rate Hike | 9 of 18 | Hawkish lean; negative for near-term gold |
| Gold Spot Price (July 16, 2026) | $4,016/oz | Testing $4,000 psychological support |
| Silver Spot Price (July 16, 2026) | $56.28/oz | Sharpest single-session drop in over a week |
The $4,000 level represents both a psychologically significant threshold and a technically important support zone. Gold briefly traded below this level in the prior week before recovering, reflecting the tension between near-term rate headwinds and the structural demand floor provided by central bank accumulation.
For investors navigating the current environment, the discipline required is separating what the data says about the next FOMC meeting from what the longer-term rate cycle implies for the gold price, retail sales, and Fed rate cuts outlook over the subsequent 24 months. Both questions matter, but they operate on entirely different timeframes and demand entirely different analytical frameworks.
This article is for informational purposes only and does not constitute financial or investment advice. Precious metals investing involves risk, including the potential loss of principal. Past performance of gold during prior rate cut cycles does not guarantee future results. Always consult a qualified financial adviser before making investment decisions.
Want to Stay Ahead of the Next Major Mineral Discovery on the ASX?
While macroeconomic forces shape gold's near-term trajectory, the most significant returns in the resources sector have historically come from being first to identify a major mineral discovery — and Discovery Alert's proprietary Discovery IQ model delivers real-time alerts the moment significant ASX discoveries are announced, transforming complex geological data into actionable investment insights. Explore historic discovery returns on Discovery Alert's dedicated discoveries page and begin your 14-day free trial today to position yourself ahead of the broader market.